
Chapter 7
You Want This Project Done When?
IN THIS CHAPTER
![]() Creating a network diagram for your project
Creating a network diagram for your project
![]() Using your network diagram to determine schedule possibilities
Using your network diagram to determine schedule possibilities
![]() Approximating activity durations and forming your project’s initial schedule
Approximating activity durations and forming your project’s initial schedule
![]() Presenting your project’s schedule
Presenting your project’s schedule
Project assignments always have deadlines. So even though you’re not sure what your new project is supposed to accomplish, you want to know when it has to be finished. Unfortunately, when you find out the desired end date, your immediate reaction is often one of panic: “But…but…that won’t be enough time!”
The truth is, when you first receive your project assignment, you usually have no idea how long it’ll take to complete. Initial reactions tend to be based more on fear and anxiety than on facts, especially when you’re trying to juggle multiple responsibilities and the project sounds complex.
To help you develop a more realistic estimate of how long your project will take, you need an organized approach that clarifies how you plan to perform your project’s activities, what schedules are possible, and how you’ll meet deadlines that initially appear unrealistic. This chapter describes a technique that helps you proactively develop an achievable schedule (while keeping your anxiety in check).
 The discussion in this chapter on using network diagrams to develop project schedules is the most technically detailed presentation in this book. Even though the technique takes about ten minutes to master, the explanations and illustrations can appear overwhelming at first glance. If this chapter is your first exposure to flowcharts, we suggest you initially scan it for the main points and then read the different sections several times. The more you read the text, the more logical the explanations become. However, if you get frustrated with the technical details, take a break and come back to it later. You’ll be surprised how much clearer the details are the second or third time around!
Picture This: Illustrating a Work Plan with a Network Diagram
To determine the amount of time you need for any project, you have to determine the following two pieces of information:
- Sequence: The order in which you perform the activities
- Duration: How long each individual activity takes
For example, suppose you have a project consisting of ten activities, each of which takes one week to complete. How long will you take to complete your project? The truth is, you can’t tell. You may finish the project in one week if you have the ability and resources to perform all ten activities at the same time. You may take ten weeks if you have to do the activities one at a time in sequential order. Or you may take between one and ten weeks if you have to do some but not all activities in sequence.
To develop a schedule for a small project, you can probably consider the durations and sequential interdependencies in your head. But projects with 15 to 20 activities or more — many of which you can perform at the same time — require an organized method to guide your analysis.
This section helps you develop feasible schedules by showing you how to draw network diagrams and then how to choose the best one for your project.
Defining a network diagram’s elements
A network diagram is a flowchart that illustrates the order in which you perform project activities. It’s your project’s test laboratory — it gives you a chance to try out different strategies before performing the work.
No matter how complex your project is, its network diagram has the following three elements: milestones, activities, and durations.
Milestone
A milestone, sometimes called an event, is a significant occurrence in the life of a project. Milestones take no time and consume no resources; they occur instantaneously. Think of them as signposts that signify a point in your trip to project completion. Milestones mark the start or end of one or more activities or the creation of deliverables. (See Chapters 5 and 6 for more on deliverables.) Examples of milestones are draft report approved and design begun.
Activity
An activity, also called a task, is a component of work performed during the course of a project. Activities take time and consume resources; you describe them by using action verbs. Examples of activities are design report and conduct survey.
Make sure you clearly define activities and milestones. The more clearly and granularly you define them, the more accurately you can estimate the time and resources needed to perform them, the more easily you can assign them to someone else, and the more meaningful your reporting of schedule progress becomes.
Duration
Duration is the total number of work periods required to complete an activity. Several factors can affect duration:
- The amount of work effort (the amount of time a person needs to work full time on the activity to complete it) required. See Chapter 8 for details on work effort.
- People’s availability to work on the project.
- Whether multiple people can work on the activity at the same time.
- Capacity of non-personnel resources (for example, a computer’s processing speed and the pages per minute that a copier can print) and their availability.
- Delay. For example, if your manager spends one hour reading your memo after it sat in their inbox for four days and seven hours, the activity’s duration is five days, even though your manager spends only one hour reading it.
The units of time describe two related but different activity characteristics. Duration is the number of work periods required to perform an activity; work effort is the amount of time a person needs to complete the activity. For example, suppose four people have to work together full time for five days to complete an activity. The activity’s duration is five days. The work effort is 20 person-days (4 people times 5 days).
Understanding the basis of a duration estimate helps you figure out ways to reduce it. For example, suppose you estimate that testing a software package requires that it run for 24 hours on a computer. If you can use the computer only six hours in any one day, the duration for your software test is four days. Doubling the number of people working on the test doesn’t reduce the duration to two days, but getting approval to use the computer for 12 hours a day does.
Drawing a network diagram
Determining your project’s end date requires you to choose the dates that each project activity starts and ends and the dates that each milestone is reached. You can determine these dates with the help of a network diagram.
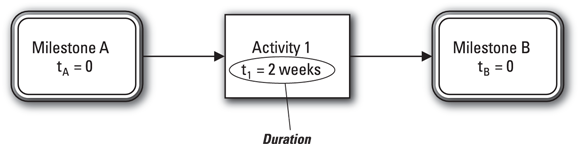
The activity-on-node technique (also called activity-in-box or precedence diagramming method) for drawing a network diagram uses the following three symbols to describe the diagram’s three elements:
- Boxes: Boxes represent activities and milestones. If the duration is 0, it’s a milestone; if it’s greater than 0, it’s an activity. Note that milestone boxes are sometimes highlighted with lines that are bold, double, or otherwise more noticeable.
- Letter t: The letter t represents duration.
- Arrows: Arrows represent the direction work flows from one activity or milestone to the next. Upon completing an activity or reaching a milestone, you can proceed either to a milestone or directly to another activity as indicated by the arrow(s) leaving that box.
Figure 7-1 presents a simple example of an activity-on-node network diagram. When you reach Milestone A (the box on the left), you can perform Activity 1 (the box in the middle), which you estimated will take two weeks to complete. Upon completing Activity 1, you reach Milestone B (the box on the right). The arrows indicate the direction of workflow.
© John Wiley & Sons, Inc.
FIGURE 7-1: The three symbols in an activity-on-node network diagram.
Note: If you’ve worked with network diagrams in the past, you may have seen them drawn in another format called activity-on-arrow, also called the classical approach, an arrow diagram, or a PERT chart (see the section “Improving activity duration estimates” later in this chapter for an explanation of PERT analysis). This format represents milestones with circles and activities with arrows. However, because the activity-on-node technique is the one most used today, all network diagrams in this book are drawn in this format.
Analyzing a Network Diagram
Think of your project as a trip you and several friends are planning to take. Each of you has a car and will travel a different route to the final destination. During the trip, two or more of your routes will cross at certain places. You agree that all people who pass through a common point must arrive at that point before anyone can proceed on the next leg of the journey. The trip is over when all of you reach the final destination.
You certainly don’t want to undertake a trip this complex without planning it out on a roadmap. After all, planning your trip allows you to:
- Determine how long the entire trip will take
- Identify potential difficulties along the way
- Consider alternate routes to get to your final destination
This section helps you plan your project schedule by telling you how to read and interpret a roadmap (your network diagram) so you can determine the likely consequences of your alternative approaches.
Reading a network diagram
Use the following two rules as you draw and interpret your network diagram. After you understand these rules, analyzing the diagram is a breeze:
- Rule 1: After you finish an activity or reach a milestone, you can proceed to the next activity or milestone, as indicated by the arrow(s).
- Rule 2: Before you can start an activity or reach a milestone, you must first complete all activities and reach all milestones with arrows pointing to the activity you want to start or the milestone you want to reach.
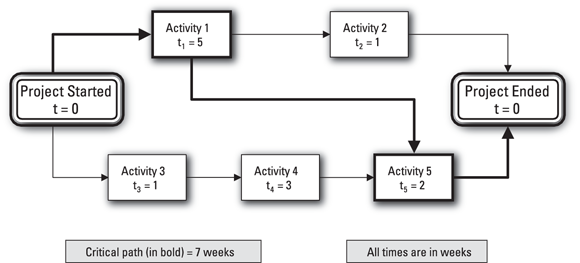
Figure 7-2 illustrates a network diagram. According to Rule 1, from Project Started, you can proceed to work on either Activity 1 or 3, which means you can do either Activity 1 or Activity 3 by itself or both Activities 1 and 3 at the same time. In other words, these two activities are independent of each other.
© John Wiley & Sons, Inc.
FIGURE 7-2: An example of a network diagram.
You may also choose to do neither of the activities. Rule 1 is an allowing relationship, not a forcing (or requiring) relationship. In other words, you can work on any of the activities that the arrows from Project Started lead to, but you don’t have to work on any of them.
For example, suppose a part of your plan includes two activities to build a device: receive parts and assemble parts. As soon as you receive the parts, you can start to assemble them; in fact, you can’t start to assemble them until you receive them. But after you receive all the parts you ordered, neither rule says you must start to assemble them immediately; you can assemble them if you want to, or you can wait. Of course, if you wait, the completion of the assembly will be delayed. But that’s your choice.
According to Rule 2, you can start working on Activity 2 in Figure 7-2 as soon as you complete Activity 1 because the arrow from Activity 1 is the only one leading to Activity 2. Rule 2, therefore, is a forcing relationship, because it forces you to wait until you complete Activity 1 before you can begin working on Activity 2. If arrows from three activities led to Activity 2, you’d have to complete all three activities before starting Activity 2 (the diagram wouldn’t indicate that you could start working on Activity 2 by completing only one or two of the three activities that led to it).
Interpreting a network diagram
You can use your network diagram to figure out when to start and end activities and when you’ll finish the entire project if you perform the activities in this way. To find out the schedule that your approach will allow, you need the following information:
- Critical path: A sequence of activities that takes the longest time to complete (this is also the shortest time in which you can complete your project)
- Noncritical path: A sequence of activities in which you can delay activities and still finish your project in the shortest possible time
- Slack time (also called float): The maximum amount of time you can delay an activity and still finish your project in the shortest possible time
- Earliest start date: The earliest date you can start an activity
- Earliest finish date: The earliest date you can finish an activity
- Latest start date: The latest date you can start an activity and still finish your project in the shortest possible time
- Latest finish date: The latest date you can finish an activity and still finish your project in the shortest possible time
You can use the critical path method (CPM) to determine this information and to build your project’s overall schedule. The following sections illustrate how this method works.
The importance of the critical path
The length of your project’s critical path(s) in your network diagram defines your project’s length (hence, the critical path method for determining your project’s schedule). If you want to finish your project in less time, consider ways to shorten its critical path.
 Monitor critical-path activities closely during performance because any delay in critical-path activities delays your project’s completion. Also closely monitor any activities on paths that are close to being critical, because any minor delay on those paths can also delay your project’s completion.
Your project can have two or more critical paths at the same time. In fact, every path in your project can be critical if every one of them takes the same amount of time. However, when every path is critical, you have a high-risk situation; a delay in any activity immediately causes a delay in the completion of the project.
Critical paths can change as your project unfolds. Sometimes activities on a critical path finish so early that the path becomes shorter than one or more other paths that were initially considered noncritical. Other times, activities on an initially noncritical path are delayed to the point where the sum of their completion times becomes greater than the length of the current critical path (which turns the initially noncritical path into a critical one).
The forward pass: Determining critical paths, noncritical paths, and earliest start and finish dates
Your first step in analyzing your project’s network diagram is to start at the beginning and see how quickly you can complete the activities along each path. You should determine this information without taking into account any effects that constraints on the availability of personnel or other resources may have. This start-to-finish analysis is called the forward pass.
To help you understand what a forward pass is, you can perform one through the diagram in Figure 7-2. According to Rule 1, you can consider working on either Activity 1 or Activity 3 (or both together) as soon as the project starts (check out the earlier section “Reading a network diagram” for more info on the two rules of network diagram analysis). First, consider Activities 1 and 2 on the upper path:
- The earliest you can start Activity 1 is right when the project starts (the beginning of week 1).
- The earliest you can finish Activity 1 is the end of week 5 (add Activity 1’s estimated duration of five weeks to its earliest start time, which is the start of the project).
- According to Rule 2, the earliest you can start Activity 2 is the beginning of week 6 because the arrow from Activity 1 is the only one leading to Activity 2.
- The earliest you can finish Activity 2 is the end of week 6 (add Activity 2’s estimated duration of one week to its earliest start time at the beginning of week 6).
So far, so good. Now consider Activities 3 and 4 on the lower path of the diagram:
- The earliest you can start Activity 3 is right when the project starts (the beginning of week 1).
- The earliest you can finish Activity 3 is the end of week 1.
- The earliest you can start Activity 4 is the beginning of week 2.
- The earliest you can finish Activity 4 is the end of week 4.
You have to be careful when you try to determine the earliest you can start Activity 5. According to Rule 2, the two arrows entering Activity 5 indicate you must finish both Activity 1 and Activity 4 before you begin Activity 5. Even though you can finish Activity 4 by the end of week 4, you can’t finish Activity 1 until the end of week 5. Therefore, the earliest you can start Activity 5 is the beginning of week 6.
If two or more activities or milestones lead to the same activity, the earliest you can start that activity is the latest of the earliest finish dates for those preceding activities or milestones.
Is your head spinning yet? Take heart; the end is in sight:
- The earliest you can start Activity 5 is the beginning of week 6.
- The earliest you can finish Activity 5 is the end of week 7.
- The earliest you can finish Activity 2 is the end of week 6. Therefore, the earliest you can finish the entire project (and reach the milestone called Project Ended) is the end of week 7.
So far, you have the following information about your project:
- The length of the critical path (the shortest time in which you can complete the project) is seven weeks. Only one critical path takes seven weeks; it includes the milestone Project Started, Activity 1, Activity 5, and the milestone Project Ended.
- Activity 2, Activity 3, and Activity 4 aren’t on critical paths.
The backward pass: Calculating the latest start and finish dates and slack times
You’re halfway home. In case resource conflicts or unexpected delays prevent you from beginning all the project activities at their earliest possible start times, you want to know how much you can delay the activities along each path and still finish the project at the earliest possible date. This finish-to-start analysis is called the backward pass.
To expand on the example we introduce in the preceding section, the forward pass indicates that the earliest date you can reach the milestone Project Ended is the end of week 7. However, Rule 2 in the earlier section “Reading a network diagram” says you can’t reach the milestone Project Ended until you’ve completed Activities 2 and 5. Therefore, to finish your project by the end of week 7, the latest you can finish Activities 2 and 5 is the end of week 7. Consider the lower path on the diagram in Figure 7-2 with Activities 3, 4, and 5:
- You must start Activity 5 by the beginning of week 6 to finish it by the end of week 7 (because Activity 5’s estimated duration is two weeks).
- According to Rule 2, you can’t start Activity 5 until you finish Activities 1 and 4. So you must finish Activities 1 and 4 by the end of week 5.
- You must start Activity 4 by the beginning of week 3.
- You must finish Activity 3 before you can work on Activity 4. Therefore, you must finish Activity 3 by the end of week 2.
- You must start Activity 3 by the beginning of week 2.
Finally, consider the upper path on the network diagram in Figure 7-2:
- You must start Activity 2 by the beginning of week 7.
- You can’t work on Activity 2 until you finish Activity 1. Therefore, you must finish Activity 1 by the end of week 6.
Be careful in your calculations. You must finish Activity 1 by the end of week 5 to start Activity 5 at the beginning of week 6. But to start work on Activity 2 at the beginning of week 7, you must finish Activity 1 by the end of week 6. So finishing Activity 1 by the end of week 5 satisfies both requirements.
If two or more arrows leave the same activity or milestone, the latest date you can finish the activity or reach the milestone is the earliest of the latest dates that you must start the next activities or reach the next milestones.
In Figure 7-2, the latest start dates for Activities 2 and 5 are the beginnings of week 7 and week 6, respectively. Therefore, the latest date to finish Activity 1 is the end of week 5. The rest is straightforward: You must start Activity 1 by the beginning of week 1 at the latest.
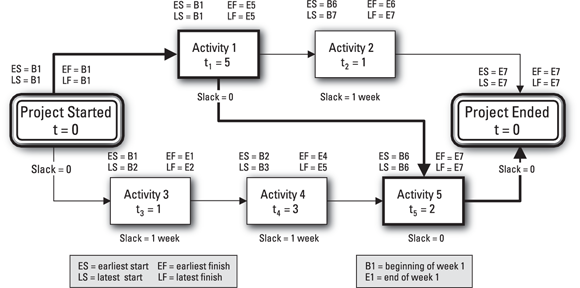
 To organize the dates you calculate in the forward and backward passes, consider writing the earliest and latest start dates and the earliest and latest finish dates at the top of each milestone or activity box in the project’s network diagram. Figure 7-3 illustrates how this looks for the example in Figure 7-2.
© John Wiley & Sons, Inc.
FIGURE 7-3: An example of a network diagram with earliest and latest start and finish dates as well as slack times.
Now that you have all the earliest and latest start and finish dates for your milestones and activities, you need to determine the slack time for each activity or milestone. You can determine slack time in one of two ways:
- Subtract the earliest possible start date from the latest allowable start date.
- Subtract the earliest possible finish date from the latest allowable finish date.
Thus, you can determine that Activities 2, 3, and 4 have slack times of one week, while Activities 1 and 5 have no slack time. Figure 7-3 displays this information.
If an activity’s slack time is zero, the activity is on a critical path.
Although slack time is defined as the amount of time an activity or milestone can be delayed without delaying your project’s completion date, slack time is actually associated with a path of activities rather than with an individual activity. The information in Figure 7-3 indicates that both Activity 3 and Activity 4 (which are on the same path) have slack times of one week. However, if the start of Activity 3 is delayed by a week to the beginning of week 2, the earliest that Activity 4 can start will be the beginning of week 3, and it will have zero slack time.
A Guide to the Project Management Body of Knowledge, 7th Edition (PMBOK 7) no longer addresses the concept of slack, although prior editions identify the following two types:
- Total slack: The amount of time a schedule activity may be delayed from its earliest start date without delaying the project’s end date or violating a schedule constraint. This is what we refer to as slack.
- Free slack: The amount of time a schedule activity may be delayed without delaying the earliest start date of any immediately following schedule activities or violating a schedule constraint.
As an example of these terms, look at the network diagram in Figure 7-3. Consider that Activity 3 is scheduled to start at its earliest start, or ES (the beginning of week 1), and Activity 4 is scheduled to start at its ES (the beginning of week 2). If you delay the start of Activity 3 by up to one week, you’ll still be able to start Activity 4 at the beginning of week 3 (its LS, or latest start) and end it by the end of week 5, its LF (latest finish). So Activity 3 has a free slack of zero (because delaying its scheduled start date of ES at all will cause the start date of Activity 4 to be delayed), while Activity 4 has a free slack of one week. Coincidently, each activity (3 and 4) has a total slack of one week, since delaying the start of either one by more than one week will delay the completion of the project beyond the current scheduled completion date of the end of week 7.
Note: The concept of total slack is more often used in schedule analyses, and that’s the concept we use in this book. For simplicity, we refer to this information item simply as slack rather than total slack.
Working with Your Project’s Network Diagram
The preceding sections explain the general rules and procedures for drawing and analyzing any network diagram. This section tells you how to create and analyze the network diagram for your own project.
Determining precedence
To draw your project’s network diagram, you first have to decide the order of your project’s activities. This section tells you different reasons you may need to perform activities in a particular order.
Looking at factors that affect predecessors
A predecessor to an activity (Activity A, for example) is an activity or milestone that determines when work on Activity A can begin. PMBOK 7 identifies the following four relationships that can exist between a predecessor and the activity or milestone coming immediately after it (termed its successor):
- Finish-to-start: The predecessor must finish before the successor can start.
- Finish-to-finish: The predecessor must finish before the successor can finish.
- Start-to-start: The predecessor must start before the successor can start.
- Start-to-finish: The predecessor must start before the successor can finish.
The finish-to-start precedence relationship is the one most commonly used, so it’s the one we address in this book. In other words, in this book, a predecessor is an activity that must be completed before its successor activity can start or its successor milestone can be reached.
Sometimes an activity can’t start precisely when its predecessor is finished. A lag is the amount of time after its predecessor is completed that you must wait before an activity can start. A lead is the amount of time before its predecessor is finished that an activity can begin. In this book, we consider only situations where lead and lag times are zero.
An activity is an immediate predecessor to Activity A if you don’t have any other activities between it and Activity A. When you determine the immediate predecessors for every activity, you have all the information you need to draw your project’s network diagram. The following considerations affect the order in which you must perform your project’s activities:
- Mandatory dependencies: These relationships must be observed if project work is to be a success. They include:
- Legal requirements: Federal, state, and local laws or regulations require that certain activities be done before others. As an example, consider a pharmaceutical company that has developed a new drug in the laboratory and demonstrated its safety and effectiveness in clinical trials. The manufacturer wants to start producing and selling the drug immediately but can’t. Federal law requires that the company obtain Food and Drug Administration (FDA) approval of the drug before selling it.
- Procedural requirements: Company policies and procedures require that certain activities be done before others. Suppose you’re purchasing new furniture for your company’s offices. You’ve finished selecting and pricing the furniture you want and would like to begin the process of selecting a vendor and placing the order. However, your organization follows a procurement process for large purchases, which requires that the vice president of finance formally approve the expenditure of the funds required before you can proceed.
- Hard logic: Certain processes must logically occur before others. For example, when building a house, you must pour the concrete for the foundation before you erect the frame.
- Discretionary dependencies: You may choose to establish these relationships between activities, but they aren’t required. They include:
- Logical dependencies: Performing certain activities before others sometimes seems to make the most sense. Suppose you’re writing a report. Because much of Chapter 3 depends on what you write in Chapter 2, you decide to write Chapter 2 first. You can write Chapter 3 first or work on both at the same time, but that plan increases the chance that you’ll have to rewrite some of Chapter 3 after you finish Chapter 2.
- Managerial choices: Sometimes you make arbitrary decisions to work on certain activities before others. Consider that you have to perform both Activity C and Activity D. You can’t work on them at the same time, and you know of no legal or logical reason why you should work on one or the other first. You decide to work on Activity C first.
- External dependencies: Starting a project activity may require that certain work external to the project be completed first. For example, imagine that your project includes an activity to test a device you’re developing. You want to start testing right away, but you can’t start this activity until your organization’s test laboratory receives and installs a new piece of test equipment they plan to order.
Choosing immediate predecessors
You can decide on the immediate predecessors for your project’s activities in one of two ways:
- Front-to-back: Start with the activities you can perform as soon as your project begins and work your way through to the end. To use this method, follow these steps:
- Select the first activity or activities to perform as soon as your project starts.
- Decide which activity or activities you can perform when you finish the first ones (from Step 1).
- Continue in this way until you’ve considered all activities in the project.
- Back-to-front: Choose the activity or activities that will be done last on the project and continue backward toward the beginning. To use this method, follow these steps:
- Identify the last project activity or activities you’ll conduct.
- Decide which activity or activities you must complete right before you can start to work on the last activities (from Step 1).
- Continue in this manner until you’ve considered all activities in your project.
Regardless of which method you use to find your project’s immediate predecessors, record the immediate predecessors in a simple table like Table 7-1. (This table lists the immediate predecessors in the example shown in Figure 7-2.)
TABLE 7-1 Immediate Predecessors for Figure 7-2
Activity Code | Activity Description | Immediate Predecessors |
|---|---|---|
1 | Activity 1 | None |
2 | Activity 2 | 1 |
3 | Activity 3 | None |
4 | Activity 4 | 3 |
5 | Activity 5 | 1, 4 |
Determine precedence based on the nature and requirements of the activities, not on the resources you think will be available. Suppose Activities A and B of your project can be performed at the same time but you plan to assign them to the same person. In this case, don’t make Activity A the immediate predecessor for B, thinking that the person can work on only one activity at a time. Instead, let your diagram show that A and B can be done at the same time. Later, if you find out you have another person who can help out with this work, you can evaluate the impact of performing Activities A and B at the same time. (See Chapter 8 for a discussion on how to determine when people are overcommitted and how to resolve these situations.)
When you create your network diagram for simple projects, consider writing the names of your activities and milestones on sticky-back notes and attaching them to chart paper or a wall. For more complex projects, consider using an integrated project management software package. See Chapter 18 for a discussion of how to use software to support your project planning, and check out Microsoft Project 2019 For Dummies by Cynthia Snyder Dionisio (Wiley) for the lowdown on Microsoft Project, the most popular project management software package.
Using a network diagram to analyze a simple example
Consider the following example of preparing for a picnic to illustrate how to use a network diagram to determine possible schedules while meeting project expectations and satisfying project constraints. We are not suggesting that you plan all your picnics this way, but the situation does illustrate the technique rather nicely!
Deciding on the activities
It’s Friday evening, and you and your friend are considering what to do during the weekend to unwind and relax. The forecast for Saturday is for sunny and mild weather, so you decide to go on a picnic at a local lake. Because you want to get the most enjoyment possible from your picnic, you decide to plan the outing carefully by drawing and analyzing a network diagram. Table 7-2 illustrates the seven activities you decide you must perform to prepare for your picnic and get to the lake.
TABLE 7-2 Activities for Your Picnic at the Lake
Activity Code | Activity Description | Who Will Be Present | Duration (In Minutes) |
|---|---|---|---|
1 | Load car | You and your friend | 5 |
2 | Get money from bank | You | 5 |
3 | Make egg sandwiches | Your friend | 10 |
4 | Drive to the lake | You and your friend | 30 |
5 | Decide which lake to go to | You and your friend | 2 |
6 | Buy gasoline | You | 10 |
7 | Boil eggs (for egg sandwiches) | Your friend | 10 |
In addition, you agree to observe the following constraints:
- You and your friend will start all activities at your house at 8 a.m. Saturday — you can’t do anything before that time.
- You must perform all seven activities to complete your project.
- You can’t change who must be present during each activity.
- The two lakes you’re considering are in opposite directions from your house, so you must decide where you’re going to have your picnic before you begin your drive.
Setting the order of the activities
Now that you have all your activities listed, you need to decide the order in which you’ll do them. In other words, you need to determine the immediate predecessors for each activity. The following dependencies are required: Your friend must boil the eggs before they can make the egg sandwiches (duh!), and both of you must load the car and decide which lake to visit before you start your drive.
The order of the rest of the activities is up to you. You may consider the following approach:
- Decide which lake before you do anything else.
- After you both agree on the lake, you drive to the bank to get money.
- After you get money from the bank, you get gasoline.
- At the same time, after you agree on the lake, your friend starts to boil the eggs.
- After the eggs are boiled, your friend makes the egg sandwiches.
- After you return with gas and your friend finishes the egg sandwiches, you both load the car.
- After you both load the car, you drive to the lake.
Table 7-3 depicts these predecessor relationships.
TABLE 7-3 Predecessor Relationships for Your Picnic
Activity Code | Activity Description | Immediate Predecessors |
|---|---|---|
1 | Load car | 3, 6 |
2 | Get money from bank | 5 |
3 | Make egg sandwiches | 7 |
4 | Drive to lake | 1 |
5 | Decide which lake | None |
6 | Buy gasoline | 2 |
7 | Boil eggs (for egg sandwiches) | 5 |
Creating the network diagram
Now that you have your immediate predecessors in mind, you can draw the network diagram for your project from the information in Table 7-3.
Observe the following guidelines when drawing your network diagram:
- Begin your diagram with a single milestone (a commonly used name for this milestone is Project Started).
- Clearly specify all conditions that must be met for a milestone to be reached.
- Don’t leave activities or events hanging; have them all come together in a common milestone that represents the end of the project (a commonly used name for this milestone is Project Ended).
- If your network diagram is excessively complex, look for groups of activities that are self-contained (that is, have only each other as predecessors). Define each of these groups as a subproject, where the duration of the subproject is equal to the length of the critical path(s) of the diagram representing the order in which the self-contained activities will be performed.
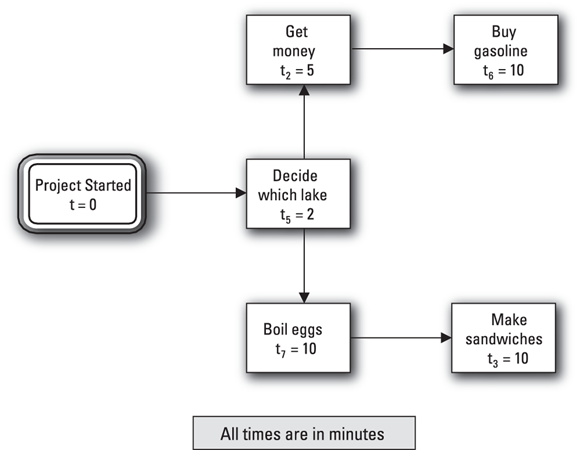
To create the network diagram for the picnic example, follow these steps:
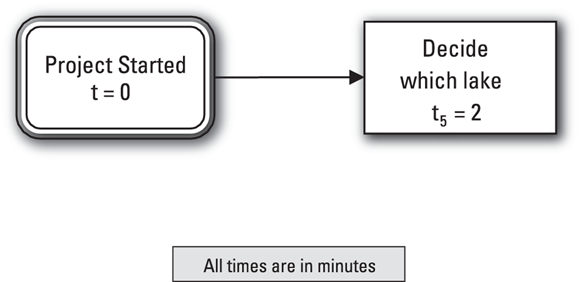
- Begin your project with a single milestone and label it Project Started.
Find all activities in the table that have no immediate predecessors — they can all start as soon as you begin your project.
In this case, only Activity 5 has no immediate predecessors.
Begin your diagram by drawing the relationship between Project Started and the beginning of Activity 5 (see Figure 7-4).
Depict Activity 5 with a box and draw an arrow to it from the Project Started box.
Find all activities that have your first activity as an immediate predecessor.
In this case, Table 7-3 shows that Activities 2 and 7 have Activity 5 as an immediate predecessor. Draw boxes to represent these two activities and draw arrows from Activity 5 to Activities 2 and 7 (see Figure 7-5).
Continue in the same way with the remaining activities.
Recognize from Table 7-3 that only Activity 6 has Activity 2 as an immediate predecessor. Therefore, draw a box to represent Activity 6 and draw an arrow from Activity 2 to that box.
Table 7-3 also shows that only Activity 3 has Activity 7 as an immediate predecessor. So draw a box to represent Activity 3 and draw an arrow from Activity 7 to Activity 3. Figure 7-5 depicts your diagram in progress.
Now realize that Activity 1 has both Activities 3 and 6 as immediate predecessors. Therefore, draw a box representing Activity 1 and draw arrows from Activities 3 and 6 to this box.
The rest is pretty straightforward. Because only Activity 4 has Activity 1 as its immediate predecessor, draw a box representing Activity 4 and an arrow from Activity 1 to Activity 4.
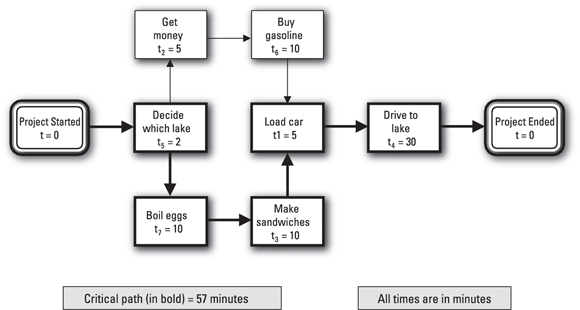
- After adding all the activities to the diagram, draw a box to represent Project Ended and draw an arrow from Activity 4 (the last activity you have to complete) to that box (see Figure 7-6 for the complete network diagram).
© John Wiley & Sons, Inc.
FIGURE 7-4: Starting your picnic-at-the-lake network diagram.
© John Wiley & Sons, Inc.
FIGURE 7-5: Continuing your picnic-at-the-lake network diagram.
© John Wiley & Sons, Inc.
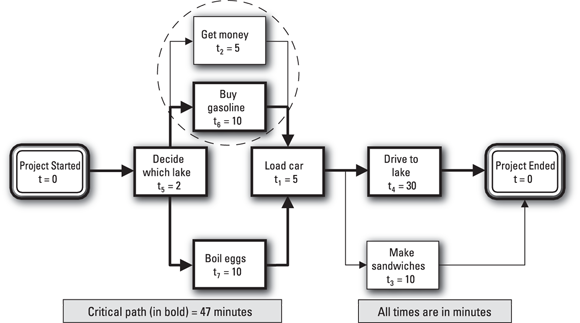
FIGURE 7-6: The completed picnic-at-the-lake network diagram.
Now for the important timing-related questions. First, how long will you and your friend take to get to the lake for your picnic? The upper path (Project Started; Activities 5, 2, 6, 1, and 4; and Project Ended) takes 52 minutes to complete, and the lower path (Project Started; Activities 5, 7, 3, 1, and 4; and Project Ended) takes 57 minutes to complete. Thus, the trip will take 57 minutes from the time you start until you arrive at the lake for your picnic, and the lower path is the critical path.
The second timing-related question you have to answer is whether you can delay any activities and still get to the lake in 57 minutes. If so, which ones can you delay and by how much? To answer these questions, consider the following:
- The network diagram reveals that Activities 5, 7, 3, 1, and 4 are all on the critical path. Therefore, you can’t delay any of them if you want to get to the lake in 57 minutes.
- Activities 2 and 6 aren’t on the critical path, and they can be performed at the same time as Activities 7 and 3. Activities 7 and 3 take 20 minutes to perform, while Activities 2 and 6 take 15 minutes. Therefore, Activities 2 and 6 have a total slack time of 5 minutes.
Developing Your Project’s Schedule
Developing your project’s schedule requires the combination of activities, resources, and activity-performance sequences that gives you the greatest chance of meeting your client’s expectations with the least amount of risk. This section helps you start making a project schedule. It also focuses on some potential pitfalls and solutions for meeting time crunches.
Taking the first steps
After you specify your project’s activities (see the discussion on creating a work breakdown structure, or WBS, in Chapter 6), take the following steps to develop an initial project schedule:
- Identify immediate predecessors for all activities. Immediate predecessors define the structure of your network diagram.
- Determine the personnel and non-personnel resources required for all activities. The type, amount, and availability of resources affect how long you need in order to perform each activity.
- Estimate durations for all activities. See the later section “Estimating Activity Duration” for details.
- Identify all intermediate and final dates that must be met. These dates define the criteria that your schedule must meet.
- Identify all activities or milestones outside your project that affect your project’s activities. After you identify these external activities and milestones, you can set up the appropriate dependencies between them and your project’s activities and milestones.
- Draw your network diagram. Use the network diagram to determine what schedules your project can achieve.
- Analyze your project’s network diagram to identify all critical paths and their lengths and to identify the slack times of noncritical paths. This information helps you choose which project activities to monitor and how often to monitor them. It also suggests strategies for getting back on track if you encounter unexpected schedule delays (see the earlier section “Interpreting a network diagram” for additional information on critical and noncritical paths).
If the completion date is acceptable to your client, you’re done with your scheduling. However, if your client wants you to finish faster than your initial schedule allows, your analyses are just beginning.
Be sure to double-check all major milestones here and throughout the project to ensure the goals of the project are being addressed.
Avoiding the pitfall of backing in to your schedule
Beware of developing a schedule by backing in — that is, starting at the end of a project and working your way back toward the beginning to identify activities and estimate durations that allow you to meet your client’s desired end date. Using this approach substantially decreases the chances that you’ll meet the schedule for the following reasons:
- You may miss activities because your focus is on meeting a time constraint, not on ensuring that you’ve identified all required work.
- You base your duration estimates on what you can allow activities to take rather than what they’ll actually require.
We were reviewing a colleague’s project plan a while back and noticed that they had allowed one week for their final report’s review and approval. When we asked them whether they thought this estimate was realistic, they replied that it certainly wasn’t realistic but that they had to use that estimate for the project plan to work out. In other words, they were using time estimates that totaled to the number they wanted to reach rather than ones they thought they could meet.
A project plan is a roadmap that, if followed, will lead to project success. To have the greatest chance of achieving that success, the following must happen:
- The plan must be complete and accurate (that is, performing all parts of the project in accordance with the plan will actually result in project success).
- The plan must be feasible (in other words, there can be no instances where performing one or more parts of the project in accordance with the plan is determined to be impossible).
- People must believe the plan is complete, accurate, and feasible (it’s not enough that the plan is complete, accurate, and feasible; people must know it and believe it, too).
- People must commit to following the plan (in other words, people must make every effort to perform their project work in accordance with the plan and follow through on their commitment).
Basing a project schedule on estimates of activity durations you know are impossible to achieve may allow you to produce a schedule that makes it appear you can finish the project by the required end date. However, as soon as people have difficulty meeting an established date, they’ll stop trying to meet it, rationalizing that they knew before they began that meeting that date would be impossible.
Meeting an established time constraint
Suppose your initial schedule has you finishing your project in three months, but your client wants the results in two months. Consider the following options for reducing the length of your critical paths:
- Recheck the original duration estimates.
- Be sure you’ve clearly described the activity’s work.
- If you used past performance as a guide for developing the durations, validate that all characteristics of your current situation are the same as those of the previous one.
- Ask other experts and the people who’ll actually be doing the work on these activities to review and validate your estimates.
- Consider using more-experienced personnel. Sometimes more-experienced personnel can get the same work done in less time. Of course, using more-experienced people may cost you more money.
- Consider different strategies for performing the activities. As an example, if you estimate a task you’re planning to do internally to take three weeks, see whether you can find an external contractor who can perform it in two weeks.
- Consider fast tracking — performing tasks that are normally done sequentially at the same time. Although fast tracking can shorten the overall time to perform the tasks, it also increases the risk of having to redo portions of your work, so be ready to do so.
As you reduce the lengths of critical paths, monitor paths that aren’t initially critical to ensure that they haven’t become critical. If one or more paths have become critical, use these same approaches to reduce their lengths.
Applying different strategies to arrive at your picnic in less time
Consider the example of preparing for a picnic (from the earlier section “Using a network diagram to analyze a simple example”) to see how you can apply these approaches for reducing a project’s time to your own project.
Figure 7-6 earlier in this chapter illustrates your initial 57-minute plan. If arriving at the lake in 57 minutes is okay, your analysis is done. But suppose you and your friend agree that you must reach the lake no later than 45 minutes after you start preparing on Saturday morning. What changes can you make to save you 12 minutes?
You may be tempted to change the estimated time for the drive from 30 minutes to 18 minutes, figuring that you’ll just drive faster. Unfortunately, doing so doesn’t work if the drive really takes 30 minutes. Remember, your plan represents an approach that you believe has a chance to work (though not necessarily one that’s guaranteed). If you have to drive at speeds in excess of 100 miles per hour over dirt roads to get to the lake in 18 minutes, reducing the duration estimate has no chance of working (though it does have an excellent chance of getting you a speeding ticket).
To develop a more realistic plan to reduce your project’s schedule, take the following steps:
- Start to reduce your project’s time by finding the critical path and reducing its time until a second path becomes critical.
- To reduce your project’s time further, shorten both critical paths by the same amount until a third path becomes critical.
- To reduce the time still further, shorten all three critical paths by the same amount of time until a fourth path becomes critical, and so on, until every path in the project is critical.
Performing activities at the same time
One way to shorten the time it takes to do a group of activities is by taking one or more activities off the critical path and doing them in parallel with the remaining activities. However, often you have to be creative to simultaneously perform activities successfully.
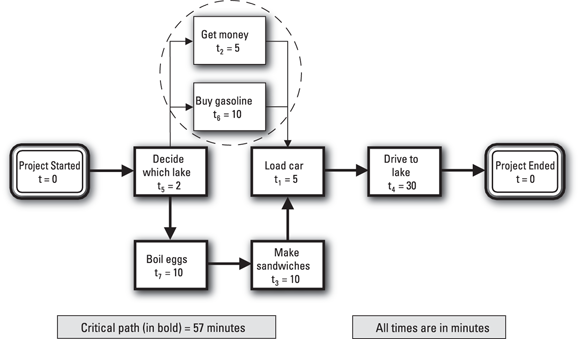
Consider the 57-minute solution to the picnic example in Figure 7-6. Assume an ATM is next to the gas station that you use. If you use a full-service gas island, you can get money from the ATM while the attendant fills your gas tank. As illustrated in Figure 7-7, this strategy allows you to perform Activities 2 and 6 at the same time — in a total of ten minutes rather than the 15 minutes you indicated in the initial network diagram.
© John Wiley & Sons, Inc.
FIGURE 7-7: Getting gas at the full-service island and cash at the nearby ATM.
At first glance, it appears you can cut the total time down to 52 minutes by making this change. But look again. These two activities aren’t on the critical path, so completing them more quickly has no impact on the overall project schedule. (Before you think you can save five minutes by helping your friend make the sandwiches, remember that you agreed you can’t swap jobs.)
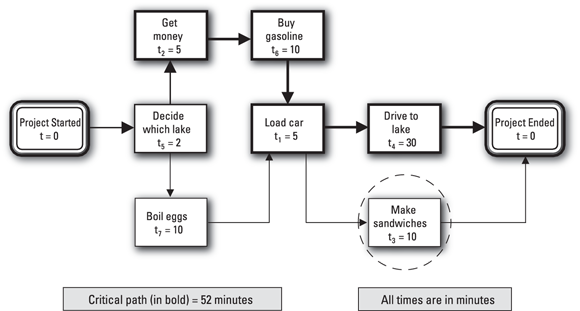
Now you have to try again. This time, keep in mind you must reduce the length of the critical path if you want to save time. Here’s another idea: On your drive to the lake, you and your friend are both in the car, but only one of you is driving. The other person is just sitting there. If you agree to drive, your friend can load the fixings for the sandwiches into the car and make the sandwiches while you drive. This adjustment appears to take ten minutes off the critical path. But does it really?
The diagram in Figure 7-6 shows that the upper path (Activities 2 and 6) takes 15 minutes and the lower path (Activities 7 and 3) takes 20 minutes. Because the lower path is the critical path (and the upper path has five minutes of slack), removing up to five minutes from the lower path can reduce the time to complete the overall project by the same amount. However, reducing the lower path by five minutes makes it the same length (15 minutes) as the upper path, which means that both paths are now critical.
Figure 7-8 reveals that taking five more minutes off the lower path (to reflect that the sandwiches take ten minutes to make) doesn’t save more time for the overall project because the upper path still takes 15 minutes. However, removing the extra five minutes from the lower path does give it five minutes of slack.
© John Wiley & Sons, Inc.
FIGURE 7-8: Making sandwiches while driving to the lake.
Now you can consider using your first idea to get money at the ATM while an attendant fills your car with gas. This time, this move can save you five minutes because the upper path is now critical. Figure 7-9 reflects this change in your network diagram.
© John Wiley & Sons, Inc.
FIGURE 7-9: Getting gas at the full-service island while getting cash at the nearby ATM and making sandwiches while driving to the lake.
Finally, you can decide which lake to visit and load the car at the same time, which saves you an additional two minutes. Figure 7-10 illustrates the final 45-minute solution. Note: For clarity, we’ve added to the original list of activities four milestones (Project Started, Project Ended, Ready to load car, and Ready to drive) and two summary activities (related to preparation and travel). We didn’t link either summary activity directly to other project activities, because the subactivities under the two summary activities are already linked to other activities or milestones.
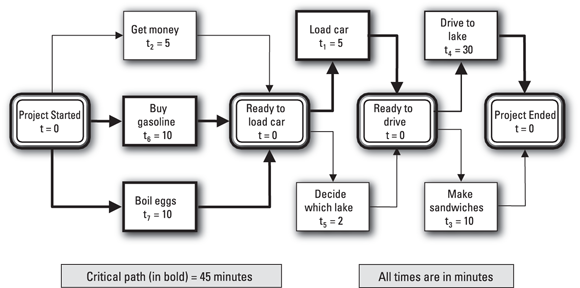
© John Wiley & Sons, Inc.
FIGURE 7-10: Getting to your picnic at the lake in 45 minutes.
Consider a situation in which you have to complete two or more activities before you can work on two or more new ones. Show this relationship in your diagram by defining a milestone that represents completion of the activities, drawing arrows from the activities to this milestone and then drawing arrows from that milestone to the new activities (refer to Figure 7-9).
In the example, you first complete the activities Get money, Buy gasoline, and Boil eggs, and then you can perform the activities Load car and Decide which lake. You represent this relationship by drawing arrows from each of the first three activities to a newly defined milestone, Ready to load car, and by drawing arrows from that milestone to the activities Load car and Decide which lake.
If you think this analysis is getting complicated, you’re right. You pay a price to perform a group of activities faster. This price includes:
- Increased planning time: You have to precisely detail all the activities and their interrelationships because you can’t afford to make mistakes.
- Increased risks: The list of assumptions grows, increasing the chances that one or more will turn out to be wrong.
In the picnic-at-the-lake example, you make the following assumptions to arrive at a possible 45-minute solution:
- You can get right into the full-service island at a little after 8 a.m.
- Attendants are available to fill up your tank as soon as you pull into the full-service island.
- The ATM is available and working when you pull into the full-service island.
- You and your friend can load the car and make a decision together without getting into an argument that takes an hour to resolve.
- Your friend can make sandwiches in the moving car without totally destroying the car’s interior in the process.
While making assumptions can increase the risk that you may not meet your project schedule, identifying the assumptions you make can improve your ability to increase the chances that they will come true — or at least convince you to develop contingency plans in case they don’t.
Consider your assumption that you can get right into a full-service island at about 8 a.m. on Saturday. You can call the gas station owner and ask whether your assumption is reasonable. If the gas station owner tells you they have no idea how long you’ll have to wait for someone to pump your gas, you may ask them whether paying $200 in cash would make a difference. When they immediately promise to cordon off the full-service island from 7:55 a.m. until 8:20 a.m. and assign two attendants to wait there, one with the nozzle and the other ready to accept your payment (so you’ll be out in ten minutes), you realize you can reduce most uncertainties for a price! Your job is to determine how much you can reduce the uncertainty and what price you have to pay to do so.
When developing schedule options, it’s not your job to preempt someone else from making a decision. Instead, you want to present all options and their associated costs and benefits to the decision-maker so that person can make the best decision. In this instance, you should have told your friend about the helicopter option so they could have considered it when they made the final decision. Of course, to help in their decision-making, you as the PM may be asked for your recommendations.
Estimating Activity Duration
A duration estimate is your best sense of how long you need to perform an activity. The estimate isn’t how long you want the activity to take or how long someone tells you it must take; the estimate is how long you think it really will take.
Overly optimistic or unrealistically short duration estimates can cause an activity to take longer than necessary for the following two reasons:
- Because unrealistic estimates appear to meet your schedule targets, you don’t seek realistic alternative strategies that increase the chances of accomplishing activities in their declared durations.
- If people believe duration estimates are totally unrealistic, they’ll stop trying to achieve them. When delays occur during an activity, team members will accept them as inevitable instead of seeking ways to overcome them.
The next section dives into what you need to accurately estimate activity duration, including an understanding of the activity’s components and processes and the resources required to support these processes.
Determining the underlying factors
The underlying makeup of an activity determines how long it will take to complete. Therefore, accurately estimating that activity’s duration requires you to describe its different aspects and determine the effect of each one on the activity’s length.
When estimating an activity’s duration, consider past experience, expert opinion, and other available sources of information to clarify the following components of the activity:
- Work performed by people: Physical and mental activities that people perform, such as writing a report, assembling a piece of equipment, and thinking of ideas for an ad campaign.
- Work performed by nonhuman resources: Activities that computers and other machines perform, such as testing software on a computer and printing copies of a report on a high-speed copier.
- Physical processes: Physical or chemical reactions, such as concrete curing, paint drying, and grass growing.
- Time delays: Time during which nothing is happening, such as needing to reserve a conference room two weeks before holding a meeting (time delays are typically due to the unavailability of resources, including people and physical resources, such as parts needed for assembly).
Considering resource characteristics
Knowing the types of resources an activity requires can help you improve your estimate of the activity’s duration. For example, not all copy machines generate copies at the same rate. Specifying the characteristics of the particular machine you’ll use to make copies can improve the activity’s duration estimate.
To support project work, you may need the following types of resources: personnel, equipment, facilities, raw materials, information, and funds. For each resource you need, you have to determine these two characteristics:
- Capacity, or productivity per unit time period
- Availability, or when a resource will be available
For example, a copy machine that produces 1,000 copies per minute can complete a job in half the time a machine that produces 500 copies per minute requires. Likewise, a large printing job can take half as long if you have access to a copy machine for four hours a day rather than two hours a day (see Chapter 9 for more information on estimating project requirements for nonhuman resources).
Improving activity duration estimates
In addition to ensuring accurate and complete data, do the following to improve the quality of your duration estimates (see Chapter 6 for more details about how to define and describe your project’s activities):
- Clearly define your activities by minimizing the use of technical jargon and describing work processes fully.
- Subdivide your activities until your lowest-level activity estimates are two weeks or less.
- Clearly define activity start and end points.
- Involve the people who’ll perform an activity when estimating its duration.
- Minimize the use of fudge factors. A fudge factor, or cushion, is an amount of time you add to your best estimate of duration “just to be safe.” Automatically estimating your final duration estimates to be 50 percent greater than your initial ones is an example. Fudge factors compromise your project planning for the following reasons:
- Work tends to expand to fill the allotted time. If you’re able to finish an activity in two weeks but use a 50-percent fudge factor to indicate a duration of three weeks, the likelihood that you’ll finish in less than three weeks is almost zero.
- People use fudge factors to avoid studying activities in sufficient depth; as a result, they can’t develop viable performance strategies.
- Team members and other project audiences lose faith in your plan’s accuracy and feasibility because they know you’re playing with numbers rather than thinking activities through in detail.
No matter how hard you try, accurately estimating duration can be next to impossible for some activities. For example, you may have an exceptionally difficult time coming up with accurate duration estimates for activities you haven’t done before, activities you’ll perform in the distant future, and activities with a history of unpredictability. In these cases:
- Make the best estimate you can by following the approaches and guidelines in this section.
- Closely monitor activities as your project unfolds to identify details that may affect your initial estimate.
- Reflect any changes in your project schedule as soon as you become aware of them.
In situations where you’ve performed an activity many times before and have historical data on how long it took each time, you may be able to estimate with confidence how long the activity will take the next time you perform it. In less-certain situations, however, you may choose to consider the activity’s duration as a random variable that can have a range of values with different probabilities.
The program evaluation and review technique (PERT) is a network analysis methodology that treats an activity’s duration as a random variable with the probability of the variable having different values being described by a Beta distribution. According to the characteristics of a Beta distribution, you determine the average value (also called the expected value) of the activity’s duration from the following three time estimates:
- Optimistic estimate (to): If you perform the activity 100 times, its duration would be greater than or equal to this number 99 times.
- Most likely estimate (tm): If you perform the activity 100 times, the duration would be this number more times than any other.
- Pessimistic estimate (tp): If you perform this activity 100 times, its duration would be less than or equal to this number 99 times.
The expected value of the duration (te) is then defined by the following formula: ![]()
If only a small number of activities in your network is uncertain, you may assign their durations to be equal to their expected values and determine the critical path, earliest and latest start and finish times, and slack times as described earlier in this chapter. However, if all activities in your network are uncertain, you may choose to develop three time estimates for each activity. In this case, you can use the properties of the Beta distribution to determine the probability that the length of the critical path falls within specified ranges on either side of its expected value.
Displaying Your Project’s Schedule
Unless all your activities are on a critical path, your network diagram doesn’t specify your exact schedule. Rather, it provides information for you to consider when you develop your schedule. After you select your actual dates, choose one of the following commonly used formats in which to present your schedule:
- Milestone list: A table that lists milestones and the dates you plan to reach them.
- Activity list: A table that lists activities and the dates you plan to start and end them.
- Combined milestone and activity report: A table that includes milestone and activity dates.
- Gantt (or bar) chart: A timeline that illustrates when each activity starts, how long it continues, and when it ends.
- Combined milestone and Gantt chart: A timeline that illustrates when activities start, how long they continue, when they end, and when selected milestones are achieved.
Figure 7-11 presents the 45-minute schedule for your picnic at the lake (from Figure 7-10 earlier in this chapter) in a combined milestone and activity report.

© John Wiley & Sons, Inc.
FIGURE 7-11: Representing your picnic-at-the-lake schedule in a combined milestone and activity report.
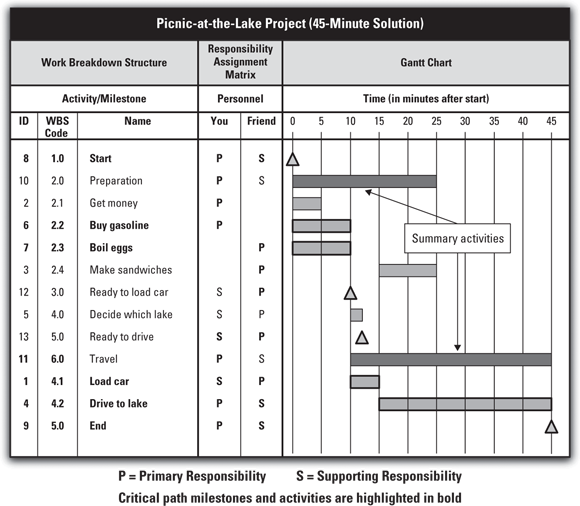
You may combine two or more formats into a single display. Figure 7-12 illustrates a combined WBS, responsibility assignment matrix (see Chapter 12), and Gantt chart (in which triangles represent milestones) for the picnic-at-the-lake example. In addition to requiring less paperwork to prepare and being easier to update and maintain than separate documents, a combined display can provide greater insight into the plan by presenting two or more aspects together for ready comparison.
You may also choose to display your project schedule with an Interface Gantt chart. In addition to including all the information you find in a simple Gantt chart, the Interface Gantt chart represents dependencies between the project’s activities and milestones with arrows drawn between the bars. The picnic-at-the-lake 45-minute schedule is presented in Figure 7-13 with an Interface Gantt chart.
© John Wiley & Sons, Inc.
FIGURE 7-12: Representing your picnic-at-the-lake schedule in a combined WBS, responsibility assignment matrix, and Gantt chart.
Each format can be effective in particular situations. Consider the following guidelines when choosing the format in which to display your schedule:
- Milestone lists and activity lists are more effective for indicating specific dates.
- The Gantt chart provides a clearer picture of the relative lengths of activities and times when they overlap.
- The Gantt chart provides a better high-level overview of a project.
- The Interface Gantt chart has all the benefits of the plain Gantt chart plus it illustrates the order in which the activities are performed.

© John Wiley & Sons, Inc.
FIGURE 7-13: Representing your picnic-at-the-lake schedule in an Interface Gantt chart.
Relating This Chapter to the PMP Exam and PMBOK 7
Table 7-4 notes topics in this chapter that may be addressed on the Project Management Professional (PMP) certification exam and that are also included in A Guide to the Project Management Body of Knowledge, 7th Edition (PMBOK 7).
TABLE 7-4 Chapter 7 Topics in Relation to the PMP Exam and PMBOK 7
Topic | Location in This Chapter | Location in PMBOK 7 | Comments |
|---|---|---|---|
Definition of network diagram | “Picture This: Illustrating a Work Plan with a Network Diagram” | 4.6.6. Visual Data and Information | The terms and discussions in both books are very similar. |
Reading and interpreting a network diagram | 3. Definitions | The terms and approaches in both books are very similar. | |
Understanding precedence | 3. Definitions | The definition and discussion of this topic are the same in both books. | |
Developing the schedule | 2.4.2.2. Estimating | The terms and approaches in both books are very similar. | |
Estimating duration | 2.4.2.2. Estimating | The terms and approaches in both books are very similar. | |
Displaying the schedule | 2.4.2.3. Schedules | The terms and approaches in both books are very similar. |