
Chapter 17
Conclusions
Technical analysis used to be greeted with as much enthusiasm as Jeffrey Skilling addressing the Better Business Bureau and was often referred to as a black art. It still is often called charting, which is not unlike referring to space flight as flying. Fortunately, those times have passed. The following quote from the Reverend Dr. Martin Luther King could easily be applied to a rules-based trend-following investment model, substituting model for man (he).
Near the beginning of this book, I stated that this was not a storybook, but a compilation of ideas, concepts, and research from almost 40 years in the markets, primarily as a technical analyst. We started out by uncovering numerous facts that are routinely used in modern finance that simply do not meet the test of rigorous mathematics or logical scrutiny. Many things in finance are truly fiction or terribly flawed. Next we moved into a section that dealt with market facts, these were basically about how markets work and after covering the fiction and flaws, appeared relatively simple but were based on sound principles of logic and reason. A large section of the book introduced research on risk, and hopefully redefined what risk is. Research that used a simple process of filtered waves and time to determine if markets trended was presented across a wide range of data sets. The final part of the book, after hopefully convincing you that markets are unpredictable and that there are risk reduction techniques such as trend following that will make you a successful investor over the long term, introduced a rules-based trend-following model affectionately called “Dance with the Trend.” Many examples of how to measure what the market was doing, with variable risk categories based on that weight of the evidence, were presented. Security ranking and selection methods were introduced along with a sample set of rules and guidelines to follow. In the end, hopefully, you realized that a rules-based model along with the discipline to follow it will help remove the human subjectivity and those horrible human emotions that we all have.
The story about Abraham Wald’s work as a member of the Statistical Research Group during World War II can shed some light into money management (widely disseminated as Abraham Wald’s Memo). Wald was tasked with damage assessments to aircraft that returned from service over Germany, and determined which areas of the aircraft structure should be better protected. He found that the fuselage and fuel systems of returned planes were more likely to be damaged than the engines. He made a totally unconventional assessment: Do not focus on the areas that sustained the most damage on these planes that returned, but focus on the essential sections that came back relatively undamaged, such as the engines. By virtue of the fact the planes returned, the heavily damaged areas did not contribute to the loss of the aircraft, but losing the engine would, and therefore would not return. Hence focus on more armor around the engines. For an airplane in battle, protect the essential parts and it will fly again. Investing is not unlike an airplane in battle: Protect the assets from destruction, such as large losses (drawdown), and the investor will live to invest again. Most of modern finance is focused on the nonessential parts.
As stated previously and often, my critique of much about modern finance is without offering any solutions. When someone complains to me about something, my usual response is that they need to offer a solution to validate their complaint. I am guilty of violating that principle in this book. Gaussian statistics are used extensively in finance because anyone who has taken mathematics, engineering, finance, or economics has learned them. Plus they are relatively simple to understand and while they have shortcomings do provide some understanding about distributions of market data, but never about the extremes. There are statistical techniques that deal with this shortcoming simply referred to as power laws. A number of papers present sufficient evidence to this concept. I have listed a few in the appendix, but an Internet search for “power laws in finance” will provide you with a host of works. You will quickly see that Benoit Mandelbrot (Chapter 3) started something.
For those who still believe that markets do not trend, here is a simple attempt to move you away from that belief. Trends exist because of the herding characteristics of humans. For example, limit orders and stop loss levels are usually set based on an incremental measure from a recent price. Robert Prechter provides an exceptional paper on this subject. (A104)
Financial Advice
It is far from the purpose of this book to get into financial advice other than to blatantly state, “If you cannot control your emotions when making investment decisions, then seek help.” Remember, experts cannot predict the market any better than anyone else, but they can offer a systematic approach to investing. They will assist in your switching/abandoning of strategies for whatever reason and truly help with your behavior when it comes to the markets. Usually, they will also help your accountability so that you continue to make periodic contributions to your portfolio. Outside objectivity is also a benefit as the advisor can slow you down on your dash to follow the herd, and cause you to stick to your plan. The sad part is that most investors will wait too late in life to realize they need help. Wanting to act rational because you know you should, and doing so, are often far apart. Here are some simple questions to ask a potential advisor: how do you manage risk and how do you make investment decisions. Look for answers that involve a process.
Remember: It is not important to be right every time, but it is important to be right over time.
A return of your money; or a return on your money.
Performance tells you nothing about the risks assumed to attain that performance, risks that tend to show up later. It is better to manage risk than to just measure it.
According to William Bernstein successful investors need:
- An interest in the process.
- An understanding of the laws of probability and a working knowledge of statistics.
- A firm grasp of financial history.
- The emotional discipline to execute their planned strategy faithfully, come hell, high water, or the apparent end of capitalism as we know it.
A Compilation of Rules and Guidelines for Investors
Over the years I have collected lists of rules, guidelines, steps, and so on written by various individuals for various reasons. Most of them were created by folks after they had spent decades in the business and were sharing some things they not only learned over that time, but also believed.
Robert Farrell’s 10 Rules for Investing
Robert Farrell was Merrill Lynch’s technical analyst for many years. Here are his 10 rules for investing:
- Markets tend to return to the mean over time. When stocks go too far in one direction, they come back. Euphoria and pessimism can cloud people’s heads. It’s easy to get caught up in the heat of the moment and lose perspective.
- Excesses in one direction will lead to an opposite excess in the other direction. Think of the market baseline as attached to a rubber string. Any action too far in one direction not only brings you back to the baseline, but leads to an overshoot in the opposite direction.
- There are no new eras—excesses are never permanent. Whatever the latest hot sector is, it eventually overheats, mean reverts, and then overshoots. Look at how far the emerging markets and BRIC nations ran over the past six years, only to get cut in half. As the fever builds, a chorus of “this time it’s different” will be heard, even if those exact words are never used. And of course, it—Human Nature—never is different.
- Exponential rapidly rising or falling markets usually go further than you think, but they do not correct by going sideways. Regardless of how hot a sector is, don’t expect a plateau to work off the excesses. Profits are locked in by selling, and that invariably will lead to a significant correction, which eventually comes.
- The public buys the most at the top and the least at the bottom. That’s why contrarian-minded investors can make good money if they follow the sentiment indicators and have good timing. Watch Investors Intelligence (measuring the mood of more than 100 investment newsletter writers) and the American Association of Individual Investors survey.
- Fear and greed are stronger than long-term resolve. Investors can be their own worst enemy, particularly when emotions take hold. Gains “make us exuberant; they enhance well-being and promote optimism,” says Santa Clara University finance professor Meir Statman. His studies of investor behavior show that “Losses bring sadness, disgust, fear, regret. Fear increases the sense of risk and some react by shunning stocks.”
- Markets are strongest when they are broad and weakest when they narrow to a handful of blue-chip names. Hence, why breadth and volume are so important. Think of it as strength in numbers. Broad momentum is hard to stop, Farrell observes. Watch for when momentum channels into a small number of stocks (“Nifty 50” stocks).
- Bear markets have three stages—sharp down, reflexive rebound, and a drawn-out fundamental downtrend. I would suggest that as of August 2008, we are on our third reflexive rebound—the January rate cuts, the Bear Stearns low in March, and now the Fannie/Freddie rescue lows of July. Even with these sporadic rallies end, we have yet to see the long drawn out fundamental portion of the Bear Market.
- When all the experts and forecasts agree—something else is going to happen. As Stovall, the S&P investment strategist, puts it: “If everybody’s optimistic, who is left to buy? If everybody’s pessimistic, who’s left to sell?” Going against the herd as Farrell repeatedly suggests can be very profitable, especially for patient buyers who raise cash from frothy markets and reinvest it when sentiment is darkest.
- Bull markets are more fun than bear markets, especially if you are long only or mandated to be fully invested. Those with more flexible charters might squeak out a smile or two here and there.
James Montier (GMO)
- Risk isn’t a number and it isn’t volatility, it’s the permanent impairment of capital.
- Volatility creates the opportunity.
- Leverage cannot turn a bad investment into a good one, but it can turn a good one bad.
- Leverage limits staying power.
- Often financial innovation is often just leverage in thinly veiled disguise.
James Montier’s Seven Immutable Laws of Investing
- Always insist on a margin of safety.
- This time is never different.
- Be patient and wait for the fat pitch.
- Be contrarian.
- Risk is the permanent loss of capital, never a number.
- Be leery of leverage.
- Never invest in something you don’t understand.
My Rules
- Turn off the TV and stop surfing the Internet for advice (stop the noise).
- Develop a simple process, one that you can explain to anyone (mine is trend following).
- Create a security selection process based on momentum.
- Devise a simple set of prudent and reasonable rules and guidelines.
- Follow your process with discipline; without it, you will fail.
- If you do not have the discipline to do this, seek professional help from someone who does.
- Do not be upset with yourself if you do not have the discipline at times; be proud of yourself for recognizing it.
- Do not confuse luck with skill.
- Listen and learn from the market—it is always right.
- Read this list often.
It is never the indicator or the model; it is the user of those tools who is probably at fault.
“If I’ve learned a little
My Grandad told me so
It ain’t so much the fiddle,
It’s the man who holds the bow.”
Cowritten by my favorite Texas musicians, John Arthur Martinez and Mike Blakely
Secular Markets and the Efficiency Ratio
I want to show you that a number of the indicators/measures discussed in this book have other uses. For example, the Efficiency Ratio mentioned in Chapter 14 used to select the most efficient buy candidates can also be used to confirm market action, such as in Secular markets. Figure 17.1 shows the weekly Dow Industrials with the secular markets identified (only secular bears identified with no identification for the secular bulls) and the four-year Efficiency Ratio. In other words how efficient did the market move over a four-year period. You can see that secular bull markets are much more efficient (higher ER) than secular bear markets. This result is not surprising, but at least is now somewhat quantified.

FIGURE 17.1 Secular Markets and the Efficiency Ratio
Source: Chart courtesy of MetaStock.
The Rules-Based Trend-Following Model in October 1987
Okay, I always get asked this, how did the Dance with the Trend model perform on Black Monday, October 1987? First of all, this model was not in existence until the early 1990s, but I have data back to the late 1970s to show how it would have performed. As you can see the S&P 500 is the top plot in Figure 17.2 and the Weight of the Evidence is in the lower plot. The Weight of the Evidence began to decline the first week in September and was below 50 percent by September 10, 1987. While stops in the zone below 50 percent are extremely tight, it is highly probable that any money management at this time would be fully defensive in cash or cash equivalents. And this is over a month prior to the crash. Notice how just prior to the crash the Weight of the Evidence popped up slightly then dropped quickly prior to the crash.
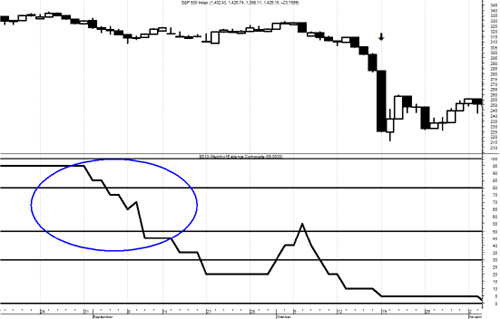
FIGURE 17.2 Weight of the Evidence in 1987
Source: Chart courtesy of MetaStock.
The Flash Crash of May 6, 2010
Big market declines rarely occur while the market is making new highs. When one is a trend follower it means they never get out at the top and never get in at the bottom. A fact of life and one that is only apparent in the remarkably beautiful world of hindsight. Often I get a question along the lines of how do you handle panic selloffs, such as 1987, and the May 2010 Flash Crash. The year 1987 was explained previously. The Flash Crash on May 6, 2010, was a really scary day. The good news is that the market had peaked on April 23, 2010, and had been in a downtrend for two weeks prior to the Flash Crash, which I believe most have forgotten. In Figure 17.3 the April 23 peak is denoted by point A and the Flash Crash of May 6 by point B, nine trading days later. The Weight of the Evidence dropped from 100 into the second zone two days prior to May 6. Recall that when a zone changes, so do the stops on all holdings. This tightening of the stops took the holdings down to only one that remained on the morning of May 6. Recall also that all selling is done only when the individual holding hits its stop. The last holding was sold the morning of May 6 because it hit its stop. Luck? Of course there was some luck involved. If the crash had occurred a few days earlier, most of the holdings would have gotten clobbered. However, the trend peaked nine days before the Flash Crash and the system worked.

FIGURE 17.3 Flash Crash and the Weight of the Evidence
Source: Chart courtesy of MetaStock.
This event prompted some research into market action prior to crash days. The results were strong that rarely do markets crash while making new highs. February 27, 2007, was about the only time it happened.
In today’s complex markets, money management must remain focused on process, which helps control their investment philosophy and the nature of their client base. Controlling the process of investing is absolutely critical for long-term success in the markets. And my final quote from James Montier: “when athletes were asked what went through their minds just before the Beijing Olympics, the consistent response was a focus on process, and not outcome.” (B43) Don’t forget that.
Final Observations
I want to avoid, even though it is tempting, repeating much of what I have elaborated on in this book, but some of the pontifications are so important in my opinion that I’m going to repeat a few. The goals of this book are numerous.
- Understand how markets work and how they have worked in the past.
- Understand the plethora of information that exists in modern finance that is just wrong.
- Understand how the tools of modern finance work and their shortcomings.
- Understand that you, as a human being, have terrible natural investment tendencies.
- Understand what risk is.
- Understand that most markets trend and those trends can be identified.
- Understand that there are ways to use technical analysis to invest successfully over the long term.
- And finally, understand that there are many techniques for investing, but until you grasp full control over your emotions and have exemplary discipline you will probably fail. Failure is how one can learn—hopefully.
Although this has been alluded to throughout this book, I’m going to put it as simply as I can. A rules-based trend follower never asks the questions: Which way is the market going to go? Are we near a top, a bottom, and so on? A trend follower doesn’t need to know and shouldn’t actually care other than inherent curiosity. We know that increasing capital by participation in up markets is favorable, there is still some joy associated with being totally defensive during down markets while most others are being clobbered. Although that may sound cruel to some, it alleviates some of the frustration of usually underperforming in volatile bull moves. It also falls nicely into a number of the behavioral traits outlined in Chapter 6.
I have injected many personal opinions in this book, most are opinions formed by learning about the markets over the past 40 years, and not all those periods were good, in fact, many were not good. I paid high tuition to learn some things. Once I learned to get my gut feelings out of the process, things got steadily better. I have challenged many things in modern finance and a few things in technical analysis. Again, just opinions as I cannot offer formal proof either way. There are two recommended reading lists in the appendix if you are just starting out, or if you are an old timer, maybe you will enjoy those recommendations also. And now:
Dance with the Trend!