Chapter 18: Integrating External Data into Excel Reporting
In This Chapter
• Importing data from Microsoft Access databases
• Importing data from SQL Server databases
• Running SQL Server stored procedures from Excel
• Creating dynamic connections with VBA
• Creating a data model with multiple external data tables
Wouldn’t it be wonderful if all the data you come across could be neatly packed into one easy-to-use Excel table? The reality is that sometimes the data you need comes from external data sources. External data is exactly what it sounds like: data that isn’t located in the Excel workbook in which you’re operating. Some examples of external data sources are text files, Access tables, SQL Server tables, and even other Excel workbooks.
This chapter explores some efficient ways to get external data into your Excel data models. Before jumping in, however, your humble authors want to throw out one disclaimer. There are numerous ways to get data into Excel. In fact, between the functionality found in the UI and the VBA/code techniques, there are too many techniques to focus on in one chapter. So for this endeavor, you focus on a handful of techniques that can be implemented in most situations and don’t come with a lot of pitfalls and gotchas.
Importing Data from Microsoft Access
Microsoft Access is used in many organizations to manage a series of tables that interact with each other, such as a Customers table, an Orders table, and an Invoices table. Managing data in Access provides the benefit of a relational database where you can ensure data integrity, prevent redundancy, and easily generate datasets via queries.
Excel 2013 offers several methods for getting your Access data into your Excel data model.
The drag-and-drop method
For simplicity, you just can’t beat the drag-and-drop method. You can simultaneously open an empty Excel workbook and an Access database from which you want to import a table or query. When both are open, resize each application’s window so that they’re both fully visible on your screen.
Hover the mouse over the Access table or query you want to copy into Excel. Now click the table and drag it to the blank worksheet in Excel (see Figure 18-1).
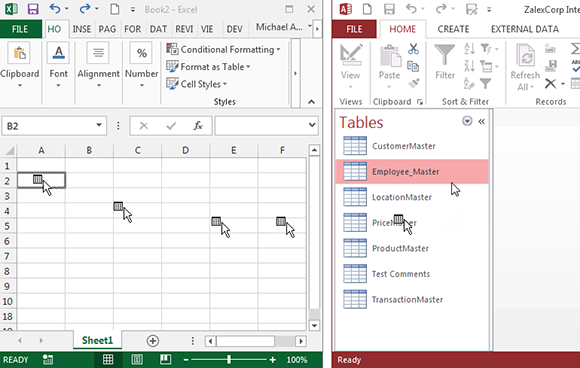
Figure 18-1: Copy an Access table using the drag-and-drop method.
The drag-and-drop method comes in handy when you’re doing a quick one-time analysis where you need a specific set of data in Excel. However, the method isn’t so useful for the following:
→ You expect this step to occur routinely, as a part of a repeated analysis or report.
→ You expect the users of your Excel presentation to get or update the data via this method.
→ It’s not possible or convenient for you to simply open up Access every time you need the information.
In the preceding scenarios, it’s much better to use another technique.
The Microsoft Access Export Wizard
Access has an Export Wizard, and it’s relatively simple to use.
1. With your Access database open, click your target table or query to select it.
2. On the External Data tab on the Ribbon, select the Excel icon under the Export group.
The wizard that you see in Figure 18-2 opens.

Figure 18-2: Export data to Excel using the Excel Export Wizard.
As you can see in Figure 18-2, you can specify certain options in the Excel Export Wizard. You can specify the file location, the file type, and some format preservation options.
3. In the Excel Export Wizard, select Export Data with Formatting and Layout; then select Open the Destination File After the Export Operation Is Complete.
4. Click OK.
Excel opens to show you the exported data.
In Access, the last page in the Export Wizard (Figure 18-3) asks if you want to save your export steps. Saving your export steps can be useful if you expect to frequently send that particular query or table to Excel.
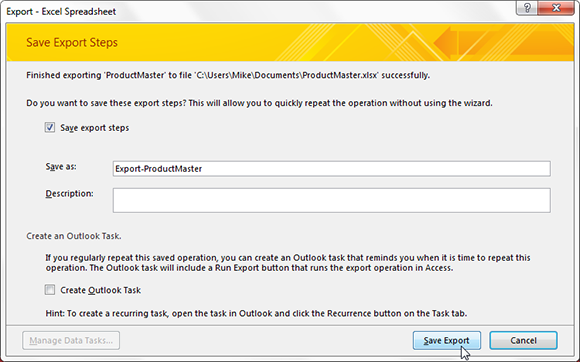
Figure 18-3: Use the Save Export Steps option if you export your data frequently.
The benefit to this method is that, unlike dragging and dropping, the ability to save export steps allows you to automate your exports by using Access macros.
 You may export your Access table or query to an existing Excel file instead of creating a new file. But note the following: the name of the exported object is the name of the table or query in Access. Be careful if you have an Excel object with that same name in your workbook because it may be overwritten. For example, exporting the PriceMaster table to an Excel worksheet that already has a worksheet named PriceMaster will cause the worksheet to be overwritten. Also, make sure the workbook to which you’re exporting is closed. If you try to export to an open workbook, you will likely receive an error in Access.
The Get External Data icon
The option to pull data from Access has been available in Excel for many versions; it was just buried several layers deep in somewhat cryptic menu titles. This made getting Access data into Excel seem like a mysterious and tenuous proposition for many Excel analysts. With the introduction of the Ribbon in Excel 2007, Microsoft put the Get External Data group of commands right on the Ribbon under the Data tab, making it easier to import data from Access and other external data sources.
Excel allows you to establish an updatable data connection between Excel and Access. To see the power of this technique, walk through these steps:
1. Open a new Excel workbook and select the Data tab on the Ribbon.
2. In the Get External Data group, select the From Access icon.
The Select Data Source dialog box opens (see Figure 18-4). If the database from which you want to import data is local, browse to the file’s location and select it. If your target Access database resides on a network drive at another location, you will need to have the proper authorization and access in order to select it.
3. Navigate to your sample database and click Open.

Figure 18-4: Choose your source database.
In some environments, a series of Data Link Properties dialog boxes open, asking for credentials (that is, username and password). Most Access databases don’t require logon credentials, but if your database does require a username and password, type them in the Data Link Properties dialog box.
4. Click OK.
The Select Table dialog box (see Figure 18-5) opens. This dialog box lists all the available tables and queries in the selected database.

Figure 18-5: Select the Access object you want to import.
 The Select Table dialog box in Figure 18-5 contains a column called Type. There are two types of Access objects you can work with: View and Table. View indicates that the dataset listed is an Access query, and Table indicates that the dataset is an Access table. In this example, Sales_By_Employee is actually an Access query. This means that you import the results of the query. This is true interaction at work; Access does all the back-end data management and aggregation, and Excel handles the analysis and presentation!
5. Select your target table or query and click OK.
The Import Data dialog box shown in Figure 18-6 opens. Here you define where and how to import the table. You have the option of importing the data into a Table, a PivotTable Report, or a PivotChart and PivotTable Report. You also have the option of creating only the connection, making the connection available for later use.
Note that if you choose PivotChart and PivotTable Report, the data is saved to a pivot cache without writing the actual data to the worksheet. Thus your pivot table can function as normal without you having to import potentially hundreds of thousands of data rows twice (once for the pivot cache and once for the spreadsheet).
6. Select Table as the output view and define cell A1 as the output location (see Figure 18-6).
7. Click OK.
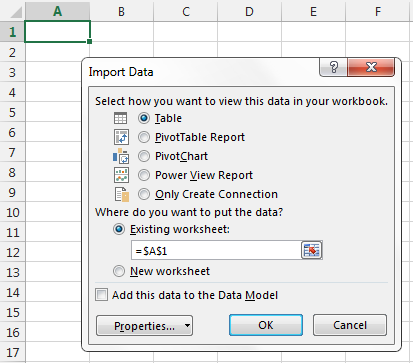
Figure 18-6: Choosing how and where to view your Access data.
Your reward for all the work will be a table similar to the one shown in Figure 18-7, which contains the imported data from your Access database.

Figure 18-7: Your imported Access data.
The incredibly powerful thing about importing data this way is that it’s refreshable. That’s right. If you import data from Access using this technique, Excel creates a table that you can update by right-clicking it and selecting Refresh from the pop-up menu, as shown in Figure 18-8. When you update your imported data, Excel reconnects to your Access database and imports the data again. As long as a connection to your database is available, you can refresh with a mere click of the mouse.

Figure 18-8: As long as a connection to your database is available, you can update your table with the latest data.
Again, a major advantage to using the Get External Data group is that you can establish a refreshable data connection between Excel and Access. In most cases, you can set up the connection one time and then just update the data connection when needed. You can even record an Excel macro to update the data on some trigger or event, which is ideal for automating the transfer of data from Access.
Importing Data from SQL Server
In the spirit of collaboration, Excel 2013 vastly improves your ability to connect to transactional databases such as SQL Server. With the connection functionality found in Excel, creating a connected table or pivot table from SQL Server data is as easy as ever.
Start on the Data tab and follow these steps:
1. Select From Other Sources to see the drop-down menu shown Figure 18-9; then select From SQL Server.
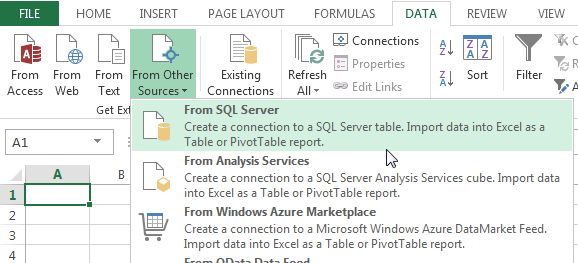
Figure 18-9: Select From SQL Server from the drop-down menu.
Selecting this option activates the Data Connection Wizard, as shown in Figure 18-10. The idea here is that you configure your connection settings so Excel can establish a link to the server.
2. Provide Excel with some authentication information.
As you can see in Figure 18-10, you enter the name of your server as well as your username and password. If you’re typically authenticated via Windows authentication, you simply select the Use Windows Authentication option.

Figure 18-10: Enter your authentication information and click Next.
3. Select the database with which you’re working from a drop-down menu containing all available databases on the specified server.
As you can see in Figure 18-11, a database called AdventureWorks2012 is selected in the drop-down box. Selecting this database causes all the tables and views in it be shown in the list of objects below the drop-down menu.
4. Choose the table or view you want to analyze and then click Next.
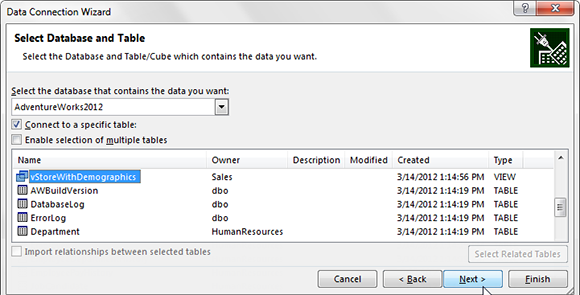
Figure 18-11: Specify your database and then choose the table or view you want to analyze.
5. In the screen that appears in the wizard, enter descriptive information about the connection you’ve just created (see Figure 18-12).
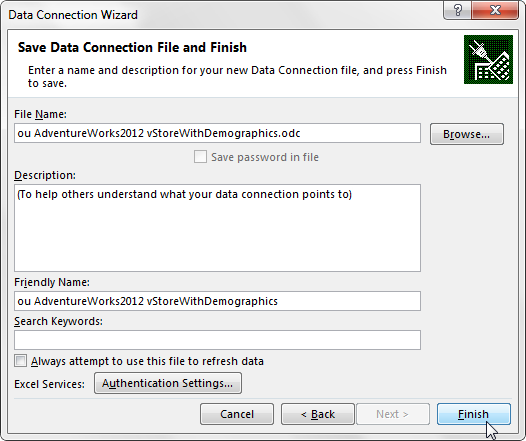
Figure 18-12: Enter descriptive information for your connection.
This information is optional. If you bypass this screen without editing anything, your connection will work fine.
The fields that you use most often are
• File Name: In the File Name input box, you can change the filename of the .odc (Office Data Connection) file generated to store the configuration information for the link you just created.
• Save Password in File: Under the File Name input box, you have the option of saving the password for your external data in the file itself (via the Save Password in File check box). Placing a check in this check box actually enters your password in the file. This password is not encrypted, so anyone interested enough could potentially get the password for your data source simply by viewing your file with a text editor.
• Description: In the Description field, you can enter a plain description of what this particular data connection does.
• Friendly Name: The Friendly Name field allows you to specify your own name for the external source. You typically enter a name that is descriptive and easy to read.
6. When you are satisfied with your descriptive edits, click Finish to finalize your connection settings.
You immediately see the Import Data dialog box where you can choose how to import your data. As you can see in Figure 18-13, this data will be shown in a pivot table.

Figure 18-13: Choosing how and where to view your SQL Server data.
When the connection is finalized, we can start building our pivot table.
Passing Your Own SQL Statements to External Databases
If you’re proficient at writing your own SQL queries, you can use the connection properties to write your own SQL statements. This gives you more control over the data you pull into your Excel model and allows you to perform advanced actions like running SQL Server stored procedures.
Manually editing SQL statements
After you’re connected to your external database, you can go to the Data tab on the Ribbon and select Connections. This activates the Workbook Connections dialog box illustrated in Figure 18-14. Choose the connection you want to edit and then click the Properties button.

Figure 18-14: Click the Properties button for the connection you want to change.
The Connection Properties dialog box opens. Here you can click the Definition tab (see Figure 18-15). Change the Command Type property to SQL and then enter your SQL statement.

Figure 18-15: On the Definition tab, select the SQL command type and enter your SQL Statement.
Running stored procedures from Excel
If you’re connecting to an SQL Server database, you can use your own SQL Statement to fire a stored procedure. The SQL Statement demonstrated in Figure 18-16 executes the SP_MarketSummary stored procedure.

Figure 18-16: Running an SQL Server stored procedure from Excel.
Some stored procedures require parameters (criteria inputs) to run successfully. If your stored procedures require parameters to run, you can simply include them in your SQL statement. Figure 18-17 illustrates this by running a stored procedure with two parameters:
→ A parameter that passes the required market name
→ A parameter that passes the required quarter

Figure 18-17: Running an SQL Server stored procedure with parameters.
Using VBA to create dynamic connections
You may have noticed that the preceding examples hard-coded the criteria in the SQL statements. For example, in Figure 18-17, Tulsa is specified directly in the SQL statement WHERE clause. This obviously would cause the data being returned to always be data for Tulsa.
But what if you want to select a market and have the SQL statement dynamically change to respond to your selection? Well, you can use a bit of VBA to change the SQL statement on the fly. Follow these steps:
1. Designate a cell in your worksheet that will catch the dynamic selection for your criteria.
For example, in Figure 18-18, cell C2 is where users can select a market. You typically give users a way to select criteria with either a combo box or a Data Validation list.

Figure 18-18: Designate a cell to trap the criteria selection.
2. Click the Connections button on the Data tab to open the Workbook Connections dialog box.
Note the name for the connection you want to dynamically change. In Figure 18-19, the connection name is Facility Services.
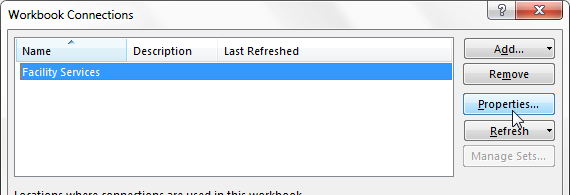
Figure 18-19: Take note of the connection name (Facility Services, in this example).
3. Close the Workbook Connections dialog box and press Alt+F11 on your keyboard.
The Visual Basic Editor opens.
4. Select Insert→Module from menu bar.
5. Enter the following code in the newly created module:
Sub RefreshQuery()
ActiveWorkbook.Connections(“Facility Services”).OLEDBConnection.CommandText = _
“SELECT * FROM [Sales_By_Employee] WHERE [Market] = ‘” & _
Range(“C2”).Value & “’”
ActiveWorkbook.Connections(“Facility Services”).Refresh
End Sub
This code creates a new macro called RefreshQuery. The RefreshQuery macro points to the correct connection (Facility Services) and specifies the Command Text for that connection.
The Command Text is essentially the SQL Statement you want the connection to run when triggered. In this example, the Command Text selects from the [Sales_By_Employee] table and sets the criteria for the [Market] field to the value in cell C2. The code then refreshes the Facility Services connection.
6. Close the Visual Basic Editor and place a new command button on your worksheet.
To do so, click on the Developer tab, select the Insert drop-down button, and add a Button Form control.
 Refer to Chapter 12 for a detailed overview on using Form controls in your dashboards and reports.
7. Assign the newly created RefreshQuery macro to the command button, as shown in Figure 18-20.
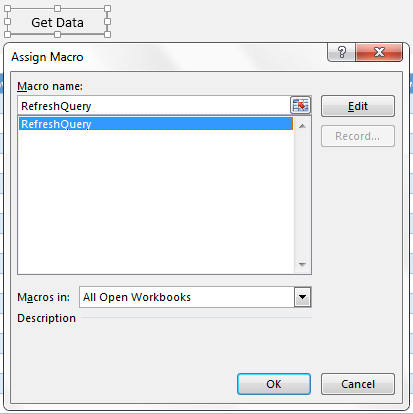
Figure 18-20: Add a command button and assign your newly created RefreshQuery macro.
If all goes smoothly, you’ll have a nifty mechanism that allows dynamic extraction of data from your external database based on the criteria you specified (see Figure 18-21).

Figure 18-21: You now have an easy-to-use mechanism to pull external data for a specified market.