
CHAPTER 5
Scheduling Project Work
PROJECTS ARE TEMPORARY ENDEAVORS—thankfully, they don’t last forever. In order for them to reach their closing, however, you’ll need to use creativity, resourcefulness, and logic in determining the project schedule. The project schedule is more than the calendar of when the work should take place; it’s also the coordination of multiple employees; procurement; timing of interactions; swift decisions; and reaction to changes, issues, and events within the work. There’s a science and a sixth sense to scheduling the work to ensure that the tasks are completed in an order that ensures that the project won’t take any longer than necessary to complete.
Scheduling the project work begins early in the project management life cycle. The customer will want and need to know how long the project is going to take. He’ll want to know when your crew can start the work, when you will be done with the work, and when he can start enjoying the deliverables that your project is creating for him. As with cost estimating, in order to answer these questions, you’ll need to understand exactly what the customer wants you to create. The higher your level of confidence in the project scope, the more precise your time estimates can be.
As your project moves into execution, your team will have the most influence on its duration. Duration estimating relies on the project team, the skilled labor, and the conditions within the project holding true to the assumptions that you’ve used to predict the project duration. When the team makes mistakes, materials don’t arrive as planned, or issues and risks plague the project, then execution slows the completion date.
In contrast to execution is monitoring and controlling, where the project manager works with the team, supervises the work, and makes adjustments to ensure that the project doesn’t stall and that the work continues. The aim of monitoring and controlling the project is to remove non-value-added activities that eat up time and slow progress. This can mean management of the team, coordination efforts with vendors, and constant communication. Corrective actions can help resolve those problems that have occurred, but the best preventive actions anticipate and avoid project delays.
The final processes of a project, the closing activities, are also time management activities because they’re centered on completion. Since one of the goals of the project is to reach closing, this is the fulfillment of the project requirements and evidence that the project has reached its goals. You’ll need to plan for operational transfer—the shifting of the created project to the management of the organization. In some projects, operational transfer doesn’t take long, whereas other projects may require some ongoing support, maintenance, and warranties.
Linking Schedule, Costs, and Scope
The old adage that time is money rings true in project management. As a general rule, the longer a project goes on, the more expensive it is going to be. In project management, time and money are directly linked because you have to pay for the labor to complete the work, pay for any rented equipment for the project, pay for permits, pay for consultants, and so on. While correlating expenses with projects is easy, there’s also the income that projects generate for your organization; the longer it takes to complete a project, the longer it’ll be before you’ll get paid for its completion.
Do you remember the iron triangle of project management? Each side of the triangle represents a constraint of project management: schedule, costs, and scope. All three sides must be in balance if the project is to be successful. The project scope—that is, the requirements for the project to be completed—must be in proportion to the project schedule and the amount of funds available to complete the project work.
In each project you launch, you’ll need to first understand the scope, the work breakdown structure (WBS), and the WBS activities to have a definitive estimate of the project duration. The nature of the work determines how long it will take you to complete the project. Effort-driven activities are assignments whose duration can be affected by the amount of labor you assign to the work package. For example, pulling network cables through a new office building might take 10 days with two workers, so you could reason that the job would be finished faster if you had more electricians to assign to the project.
In contrast, activities that are of fixed duration aren’t affected by the number of workers you assign to the task. For instance, a printing press can create 2,500 brochures an hour. If you add another pressman to the job, the press won’t double its capacity per hour to 5,000 brochures. Fixed-duration activities are often constrained by materials, equipment, and skilled labor. These activities should be highlighted in your project schedule because their completion time is linked to when they begin.
Project resources are the people, equipment, facilities, materials, and technologies that you’ll use to move your project from start to finish. Projects are completed by people, however, and this means that you’ll be reliant on the competency, dedication, and effort of your team. You’ll need to communicate with team members on a regular basis to communicate what’s expected of them, confirm their understanding of the work, and follow up with them to ensure that they’ve completed the task.
As part of project planning, you need to estimate the quantity, type, and amount of resources you’ll need for project completion. Equipment and human resources are the two types of resources that specifically affect when the project will be able to be completed. Equipment and people can work only so fast in your project—this is their capacity. Alternative identification, in resource estimating, is the process of comparing similar resources to determine which is the best solution for the project activities.
For example, you might compare a smaller, but less expensive backhoe with a larger, but more expensive backhoe. The smaller backhoe can achieve the same job and costs considerably less, but it will take longer to complete the activities. The larger backhoe can operate faster, but it costs more to utilize. This example holds true with human resources: a senior engineer versus a junior engineer, for example. The project manager needs to consider the trade-offs between time and costs as part of activity resource estimating.
In some projects, costs may be more sensitive than time, so the alternative identification decision is based on the cost of the equipment. In other projects, where deadlines are crucial, costs may be less of a priority, so it’s economically sound to spend more, use the more efficient resource, and finish the project sooner. Some projects are bonus-driven assignments, where your organization may receive a bonus based on how quickly (and accurately) you complete the project work. In these projects, there needs to be a financial study to compare the cost of using the more expensive, faster resources with the bonus the customer is offering. You may spend more initially in the project for faster resources, but realize a significant profit margin because of the bonus earned.
When you’re predicting the resources that your project will need, you’ll need to examine your WBS and the activity list. These two items will help you and the project team determine what types of resources are needed in order to create the project’s deliverables. By examining the activities, you’ll know where you have a skill gap, where you have adequate resources, and where you have resources that could be overutilized. Overutilization happens when you have a specific resource that must complete many of the project activities—if this person or piece of equipment isn’t available, then your project is halted.
Creating the Project Schedule
In order to build your schedule, you’ll need your project’s WBS and activity list. The activity list details the work that you’ll have to do in order to complete the elements of the WBS. By looking at the activity list, you can deduce the resources that you’ll need in order to complete the work. Each activity in the list should have the labor assigned, the materials and supplies documented, and an estimate of how long the activity should take to complete.
Activity duration estimating, like cost estimating, may never be exact. The more information you have about the activities (whether it is historical information, directions, or advice from subject-matter experts), the more precise your duration estimating will be. You and the team will work together to review the assignments and predict how long each activity should take.
Keep in mind that at this point, you’re estimating the duration of each activity, not the duration of the entire project, because many project activities are likely to occur simultaneously as team members have different assignments within the project. You can complete this process as part of the original activity list definition or as a follow-up process after the list has been created.
Project managers and team members are often tempted to pad the time of the project activities to compensate for emergencies, delays, and other interruptions. But there’s a danger to padding the project work. If a project team member truly believes that an activity will take 45 hours to complete, but pads the duration estimate and reports to you that the activity will take 55 hours, in almost every instance, that activity will take at least 55 hours to complete, even if the additional 10 hours weren’t needed. This is Parkinson’s law: Work expands to fill the time allotted to do it.
There are three methods that you can use to combat Parkinson’s law in your project schedule:
1. Historical information. If you have historical information from past projects, you can more accurately predict how long the activities on the current project should take to complete. As part of your current and future projects, you should record actual durations for activities so that you may build an activity duration database that will help you create more accurate and reliable duration estimates.
2. Management reserve. Rather than allowing, or encouraging, your project team to pad the duration of their activities, you need to stress the need for accurate duration estimates. At the end of the project, you’ll add 10 to 15 percent of project time to allow for actual errors and delays. If you use management reserve, you need to recognize that the entire project has basically been padded and is subject to Parkinson’s law. Your leadership and strict management of activity durations are needed to avoid allowing the project to consume the management reserve unnecessarily.
3. Three-point estimates. A three-point estimate is an average predicted time for activity durations based on three estimates for the project work duration: optimistic, most likely, and pessimistic. This is the same approach to estimating that you can use with cost estimating.
Because project completion is contingent on resources, you may want to create a resource breakdown structure. A resource breakdown structure is a chart that identifies the people, skills, materials, and supplies that you’ll need for the project. On larger projects, this is a good method for highlighting the resources that you’ll need to procure, hire, or train team members in order to complete the project work.
The resource breakdown structure can help you identify the resources needed throughout the project, in the project phases, or just for specific activities. This chart helps you avoid surprises during the project execution, as you’ve identified what’s needed early in the project.
An ongoing goal for your organization is to standardize project management across all projects. One method is to use the same terminology for activities across all projects. This way, you can easily and quickly adapt previous projects to your current project rather than doing the same planning work twice. As you create more and more activity lists, you can create a database of common project activities and the known amount of time to do the project work, and then you can quickly and confidently create reliable schedules.
Sequencing Activities
Once you’ve determined the duration of each activity, the needed resources, and conferred with your project team on who will handle what assignments, you can sequence the activities in the order in which they should, and can, happen. You’ll need to examine the project work to determine what constraints, such as access to the job site and resource availability, are tied to the activities and will affect the ordering.
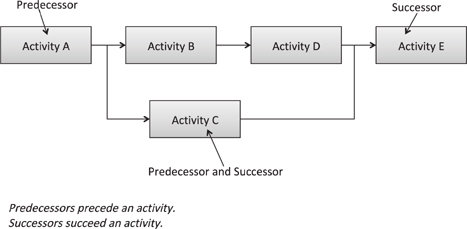
As you plot out the activity ordering, you’ll identify predecessor and successor activities. As indicated in Figure 5–1, you’ll designate predecessor activities as work that comes before a particular activity. Successor activities describe the work that comes after the current activity. Many activities can be both predecessors and successors, such as Activities B, C, and D in Figure 5–1. Some project managers describe this flow of activities as upstream and downstream activities; it’s the same concept, but predecessor and successor is the preferred terminology.
Mandatory dependencies describe activities that must be completed in a particular order. For example, you must prep the job site before you can pour the concrete. You must pour the concrete before you can begin framing the building. The nature of your work is likely to determine much of the ordering of the activities. These types of activity relationships are also called hard logic.
Some assignments, however, don’t have to be done in a particular order. You could install the light fixtures in the building first and then install the doors, or vice versa. The ordering of these events is often left up to management preferences, conditions in the project, or when materials and resources are available. One project manager might prefer to install the light fixtures first so that the doors don’t have to be opened and closed during the installation. Another project manager might want the doors installed first so that the air conditioner can be turned on. These relationship types are called soft logic.
Figure 5–1. Activity Sequencing. The ordering of the project activities creates predecessor and successor activities.
You’ll also need to determine when resources are available as you schedule the project activities. If you need an electrical engineer on Task M and Task Q and you have only one electrical engineer, you obviously can’t schedule these two tasks at the same time. Assignments that don’t use the same resources may be able to run in tandem with each other, though. You could install the light fixtures and install the office doors at the same time because you’ll be using two different types of resources in the project. Facilities, equipment, and contractors all affect when you can and cannot schedule your project work.
Activity relationships describe the linking and ordering of project activities; they identify when an activity may begin, when successor activities may begin, and even when activities are to be completed. These relationships determine the ordering of the project activities and help predict the project’s completion date. Figure 5–2 illustrates the four relationships that you can use in your project scheduling.
1. Finish-to-start (FS). The predecessor activity must finish before the successor activity can start. For example, the walls must be painted before the carpet can be installed. This is the most common relationship among project activities.
Figure 5–2. Activity Relationships. The linkage between project activities is called a relationship. Relationships determine when an activity may start and end.
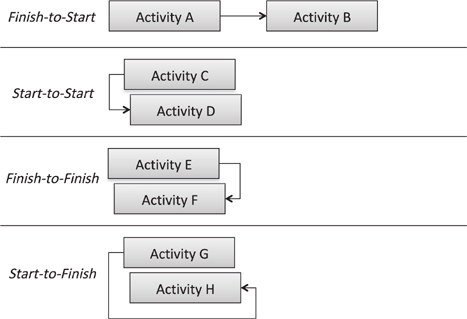
2. Start-to-start (SS). The predecessor activity must start so that the successor activity can begin. This relationship allows two related activities to run in tandem. For example, consider a large project to prime and paint all the walls in an office building. You wouldn’t need to wait for all of the offices to be primed before the painting activity could start. You could use this type of relationship to allow the priming to be slightly ahead of the painting activity so that both activities could, to some extent, happen at the same time.
3. Finish-to-finish (FF). The predecessor activity must finish so that the successor activity can finish. This type of relationship is similar to an SS relationship except that the activities will finish at nearly the same time. For example, a project to install new software on the clients’ computers requires the clients to complete training before they receive the software. While the clients are taking the class, the software is being installed on their computers. By the time the training task is finished, the software installation is also finished.
4. Start-to-finish (SF). The predecessor activity must start before the successor activity can finish. This type of relationship is rarely used and is considered the most unusual of the four types. The start date of the predecessor activity determines the finish date of the successor activity in this relationship type. Consider a project in which the last task, Activity Z, needs to finish by a particular day, but it can’t start until its successor activity, Activity Y, is approved. With this type of relationship, you can use just-in-time scheduling to schedule backward from the specific day that Activity Z is to finish by so that Activity Y starts on time. In other words, you’re scheduling backward to hit your target dates.
PROJECT COACH: The odd SF relationship is useful if you’re using just-in-time scheduling, just-in-time manufacturing, or just-in-time inventory. You might see just-in-time abbreviated as JIT. It basically means that you don’t order, create, or spend money until it’s absolutely necessary. The SF task can also be used in chemical engineering, where there are chemical reactions that are dependent on the ordering of the creation process. But again, chances are that you won’t be using this relationship type all that often because the preferred and logical SF relationship is the most common.
You’ll use these types of relationships to illustrate the ordering of your project activities. Along with the relationships, you’ll also need to use lead time and lag time, as shown in Figure 5–3, to control when the activities in your project can actually start. Lead time brings activities closer together, while lag time causes successor activities to wait longer before starting.
Lead time is often used with procurement; consider an activity that is scheduled to start in 30 days and for which sheetrock is needed to do the related work. Assuming that it will take 30 days for the sheetrock to be ordered and delivered, your lead time for the activity is 30 days from now. This example makes the assumption that your procurement process will take 30 days; the reality is that lead time reflects bringing an activity closer to the project start date.
Figure 5–3. Lag and Lead Time. Lag time is used to delay the start of an activity, while lead time allows activities to overlap and start sooner than originally scheduled.
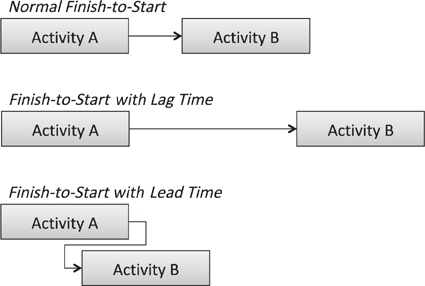
You might also use lead time to allow activities to overlap. Consider a project to create a new web site. The writer on your team is busy writing content for the web site, and the designers of the web site are waiting for the content. Activity A, the content writing, is the predecessor of Activity B, the design of the web site. You could add lead time to Activity B to allow it to overlap Activity A. The writer doesn’t need to have all the web site content done before the designers start their activity. The writer can be slightly ahead of the designers, and then the project duration doesn’t take as long as it would if the designers had to wait for the writer to be completely finished with the assignment.
The opposite of lead time is lag time. Lag time, known as waiting time or positive time, is easy to see because you’re telling project team members to wait before they start an activity. All of this has to happen before the walls can be primed for painting. You have to wait at least 48 hours for the plaster to dry before the priming activity can start. Lag time is the positive 48 hours added to the scheduled priming activity. Once the walls have been plastered, you have to wait 48 hours before the priming activity can begin.
You use lead time and lag time with activity relationships. The most common relationship between activities is FS. Examples of FS are: The writer has to finish the writing activity before the designer can design the web site. The painters have to prime the wall before they can paint the wall. Lead time added to the successor activity brings the activity’s start date closer to, and usually overlapping with, the successor’s end date. Lag time delays the start of the successor activity.
You can also use lead time and lag time with the SS and FF activities. In the example of the writer and the Web designer, you could have already scheduled these activities as SS, where the writer must start the writing before the designer can start the designing. Of course, the designer needs content before she can begin the activity, so you add a lag time of 48 hours to her design activity. With this configuration, the writer must have content to the designer within 48 hours of starting his work so that the designer can start her work. It’s essentially the same idea with the FF activities, as you’d allow the writer to finish his assignment slightly ahead of the designer’s finishing her assignment.
Developing the Schedule
Developing the project schedule is the in-depth determination of when activities can happen, the ordering of those activities, and the analysis of how best to sequence them for better resource utilization and project completion. To develop the schedule, you need to know the resources that you’ll need to utilize, the duration of the activities, and the relationship among the activities.
One of the first activities in developing the project schedule is the creation of the project network diagram, as illustrated in Figure 5–4. The project network diagram is a road map of all the activities from the start of the project to the end, and it illustrates the ordering of events. For most projects, the diagram is created with project management software, such as Microsoft Project, although you could create it by hand if you wanted to.
Notice in Figure 5–4 that there are many paths from Activity A all the way to the last activity in this project. While all of the paths have to be completed before the project can be considered complete, some activities can be delayed based on the project ordering, while others cannot be delayed at all. The path that takes the longest amount of time to complete is called the critical path, and the activities on this path cannot be delayed or else the project will be late. In Figure 5–4, that’s path ABDGH, for a total of 16 days.
Figure 5–4. Project Network Diagram. Project network diagrams illustrate the ordering of the project activities from the launch of the project to the project closing.
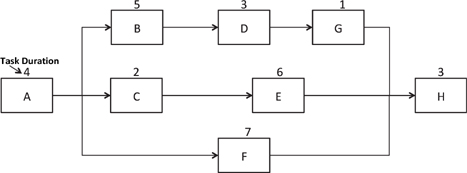

Here are all the paths to completion in Figure 5–4’s project network diagram and each path’s duration:
![]() ABDGH is 16 days.
ABDGH is 16 days.
![]() ACEH is 15 days.
ACEH is 15 days.
![]() AFH is 14 days.
AFH is 14 days.
It is possible for the activities that are not on Path ABDGH to be delayed without affecting the project end date. This delay time is called float. Float is the amount of time that an activity can be delayed without affecting the successor activity’s start time. Float allows you to manipulate resources, shift activities, and understand delays in the project work and their effect on the overall project completion. It’s not difficult to calculate float manually, although it can be tedious. Figure 5–5 follows the steps for finding float in a simple project.
If you don’t have project management software, here are the steps that you must take to determine project completion and float (note that there are several different methods for determining float; the approach I’m sharing is the most common):
![]() Determine the critical path. This is the path that will take the longest amount of time in your project based on the sum of the duration of all activities on the path. In Figure 5–5, the critical path is ABDGH, and it’s highlighted in the figure. As part of this process, you should document the duration of each path and record it for later reference.
Determine the critical path. This is the path that will take the longest amount of time in your project based on the sum of the duration of all activities on the path. In Figure 5–5, the critical path is ABDGH, and it’s highlighted in the figure. As part of this process, you should document the duration of each path and record it for later reference.
Figure 5–5. Critical Path. The process of finding the critical path and revealing float in a project network diagram has six steps.


![]() Begin the forward pass. The forward pass is the determination of the early start day and early finish day for each activity. Basically, you’re identifying the earliest time at which each activity in the project can begin and the earliest time at which each activity can finish. Activity A can start on the first day of the project, Day 1. Activity A takes four days to complete, so the earliest that Activity A can finish is Day 4. A nifty formula for the early finish is early start + duration −1. In this example, the early start is 1 and the duration is 4, so the early finish is also 4.
Begin the forward pass. The forward pass is the determination of the early start day and early finish day for each activity. Basically, you’re identifying the earliest time at which each activity in the project can begin and the earliest time at which each activity can finish. Activity A can start on the first day of the project, Day 1. Activity A takes four days to complete, so the earliest that Activity A can finish is Day 4. A nifty formula for the early finish is early start + duration −1. In this example, the early start is 1 and the duration is 4, so the early finish is also 4.
PROJECT COACH: The early finish date sometimes tricks people. If you start Activity A on Monday, Day 1, and you work for four days, you’ll finish Activity A on Thursday, not Friday. You’re working all day Monday, Tuesday, Wednesday, and Thursday, which is Day 4.
![]() Complete the forward pass. Now that you’ve started the forward pass, you need to determine when the successor activities to Activity A can begin. In this example, Activities B, C, and F can all start after Activity A finishes, so their early start is Day 5. You’ll determine the early finish for each activity all the way to the project’s last activity. The early finish for the last activity in the network diagram will be the same number of days as the critical path. In Figure 5–5, the early finish for Activity H is Day 16 and the duration of the critical path is 16 days. In other words, the earliest this project can finish is on Day 16.
Complete the forward pass. Now that you’ve started the forward pass, you need to determine when the successor activities to Activity A can begin. In this example, Activities B, C, and F can all start after Activity A finishes, so their early start is Day 5. You’ll determine the early finish for each activity all the way to the project’s last activity. The early finish for the last activity in the network diagram will be the same number of days as the critical path. In Figure 5–5, the early finish for Activity H is Day 16 and the duration of the critical path is 16 days. In other words, the earliest this project can finish is on Day 16.
![]() Begin the backward pass. The backward pass determines the latest that each activity can finish and the latest that each activity can start. The backward pass starts at the end of the project, and the late finish for the last activity is the same number as the early finish. In Figure 5–5, the late finish is Day 16, minus the duration of Activity H for a late start on Day 14.
Begin the backward pass. The backward pass determines the latest that each activity can finish and the latest that each activity can start. The backward pass starts at the end of the project, and the late finish for the last activity is the same number as the early finish. In Figure 5–5, the late finish is Day 16, minus the duration of Activity H for a late start on Day 14.
![]() Complete the backward pass. Working backward from the final activity, you’ll determine the late finish for the predecessor activities. In Figure 5–5, the latest that Activities G, E, and F can finish is on Day 13, just one day prior to the late start for Activity H. For each activity, you’ll complete the backward pass using the formula of late finish − duration + 1 to determine the late start for each activity.
Complete the backward pass. Working backward from the final activity, you’ll determine the late finish for the predecessor activities. In Figure 5–5, the latest that Activities G, E, and F can finish is on Day 13, just one day prior to the late start for Activity H. For each activity, you’ll complete the backward pass using the formula of late finish − duration + 1 to determine the late start for each activity.
![]() Expose the float. Notice that the early start and the late start for the activities on the critical path are the same day, and that the early finish and the late finish for the critical path activities are also the same day. That’s because there is no float for, or opportunity to delay, the critical path activities without affecting the project’s end date. The other activities in the project network diagram have float. The difference between the early finish and the late finish is the amount of float for each activity. The difference between the early start and the late start for each activity will also reveal the float for each activity.
Expose the float. Notice that the early start and the late start for the activities on the critical path are the same day, and that the early finish and the late finish for the critical path activities are also the same day. That’s because there is no float for, or opportunity to delay, the critical path activities without affecting the project’s end date. The other activities in the project network diagram have float. The difference between the early finish and the late finish is the amount of float for each activity. The difference between the early start and the late start for each activity will also reveal the float for each activity.
Understanding float can help you determine resource utilization throughout the project. Float can also help the project manager monitor and control the critical path activities more closely. While all activities must be completed before the project can reach its conclusion, understanding float helps you to shift resources to activities that may be slipping from the project schedule; add resources; and structure procurement, resource assignments, and communications more accurately.
There is one drawback to using the critical path method for scheduling: There’s an assumption that the resources that you need, particularly human resources, are readily available. If Bob the electrician is needed for two activities on two different paths at the same time, there’s an obvious conflict in your schedule. Again, most project management software can highlight these conflicts, but if you’re using this approach manually, you’ll need to pay attention to any resource conflicts.
Compressing the Schedule
Customers always want to know when the project’s going to be done so that they can start using the deliverables that the project will create for them. As a small-business owner, you’re also concerned with completing the project quickly so that you can get paid for the work and move your team on to other opportunities. Projects that are bonus-driven are always sensitive to project end dates. In addition, the longer a project stays in motion, the more opportunity there is for errors, defects, delays, risks, and other issues.
Compressing the schedule is the process of examining the activities, the network diagram, and the nature of the work to reveal opportunities to reduce the amount of time it will take to complete the project. One of the most effective methods for compressing the schedule is to do the work correctly and with quality on the first attempt. When the team members deliver quality work on the first attempt, they’re doing it right; with accuracy; and without defects, omissions, or scope creep.
When the team completes the work without quality, the project stalls in order to correct the problem, consequently delaying downstream activities in the project network diagram. When there are delays in the project, other errors, often resulting from rushed work to accommodate the delays, creep in, and the delays begin to propagate through the work. Stressing the need for exactness, especially through rewards and recognition, can underscore the value of the project team and lead to excitement, dedication, and quality work. If you’ve utilized the management reserve approach in your project and the reserve is not partially or fully depleted, the result will be that the project is done early.
A proactive approach to compressing the project schedule is crashing. Crashing is the process of adding resources to the work to finish the work more quickly than what was planned. Crashing works only on activities that are effort-driven, such as painting an office building or installing electrical fixtures. Effort-driven activities can be reduced by adding more labor; fixed-duration activities cannot be reduced regardless of the amount of labor that you add to the task. When you crash a project, the costs of the project are often increased because you have to pay for the added labor for the effort-driven activities.
Crashing a project does have its limitations based on the law of diminishing returns. Consider an activity to install 4,500 new computers for an organization. You’ve estimated that with 10 project team members, this task will take 5,000 hours of labor. You could reason that if you doubled the number of team members, you could reduce the duration of the task to 2,500 hours. You could also reason that by doubling your efforts again and again, you could essentially reduce the total duration of the task to just a few minutes based on the amount of labor you could add.
The fallacy of adding labor is that you cannot continuously add labor to continue to diminish the amount of time the work will take to do. You cannot exponentially add labor to exponentially reduce the duration of the activity. The law of diminishing returns also reveals that at some point, the value of the project will diminish to below the yield that the project will generate. In other words, if you keep adding labor to the project, the cost of the labor will be greater than the revenue that the project will give your company.
Another approach to schedule compression is fast-tracking the project. Fast-tracking allows activities and phases to overlap in situations where you might not allow them to overlap otherwise. For example, by using lead time, you could allow the painting activity and the carpet activity to overlap by a few hours. Ordinarily you might require that all of the painting be completed before the carpet could be installed. In this instance, however, you would elect to have the carpet installed just after the painting has started.
Although fast-tracking reduces the total duration of the project by allowing activities to start sooner than what was originally called for, it also increases risks in the project. In this carpeting and painting example, the overlap of the activities might create a risk that paint would get on the carpet or that the carpet installers would smear the painted walls—either of which would result in delays, waste, and work having to be redone.
Controlling the Schedule
Once the schedule has been created and approved, changes should be avoided throughout the project. The project manager and the project team should become aware of potential delays and issues that might affect the completion date and work proactively to prevent them. This means encouraging the team members to communicate with the project manager and with one another about potential issues and risks.
Controlling the project schedule requires the project manager to react to variances in the duration of activities. When a team member is taking longer than was anticipated to complete a task, the project’s end date may be affected. The project manager should examine the delay, determine the cause, and create corrective actions for that delay and possible future delays that the issue may create for the project.
As part of the daily or weekly project team meeting, the project manager should always discuss three things: what’s been completed, what’s left to complete, and any issues that may affect completion. This allows the members of the project team to confirm their assignments, confirm the status of their current work, and anticipate what the future of the project calls for. By communicating with the project team members frequently, the project manager confirms expectations and can resolve discrepancies in the schedule and in activity durations. This frequent dialogue can be incorporated into the project’s work authorization system so that the actual duration of assignments is recorded and communicated and so that successor activities can start quickly and without delay.
There are instances in which delays in the project are inevitable: the result of weather, vendor delays, or errors and omissions in the work. All of these issues should be documented and analyzed, and the project’s network diagram should be reviewed to determine the full impact of the change. A study of the project schedule may allow activities to be shifted to accommodate the delay without affecting the project end date or allow buffer time in the management reserve to be used. The project manager and the project team should always aim to prevent extending the project’s end date.
Another instance that can drastically affect the project’s completion date is resource leveling. Resource leveling occurs when the number of hours that the project team members are allowed to work in a given time period is limited. For example, a labor union may restrict the number of hours that the project team can work to just 40 hours per employee per week, or a customer may restrict access to the job site to just six hours a day. In these instances, the labor has been leveled, or restricted, to a smaller amount of time than what the project manager has planned for.
Resource leveling will cause the project schedule to increase. While the amount of labor needed may remain the same, the number of days required to complete the project will now be greater because there are fewer working hours in a given day. In these instances, the project manager should look to compromise with the client, look for crashing solutions, or negotiate for a later end date because of the labor utilization constraint.
Five Project Management Time Secrets
Although it’s true that every project is different, there are some tactics that can be used to save and manage time in all projects. Here are five time management practices that you can start implementing today to keep your projects on track and on schedule:
1. Agendas. If you’re like me, you hate meetings that drone on, lack structure, and waste time and energy. Meetings need agendas because the agendas define the purpose of the meeting, keep things moving along, and create boundaries for topics that aren’t on the table. When you create an agenda, you should distribute that agenda to the participants at least a day before the meeting. This allows time for the suggestion of other items, prepares for participants’ contributions, and sets expectations of what will be discussed.
2. Chairs. If you have quick, daily reviews for your team where you discuss work and assignments for the day, try this trick: Get rid of the chairs. Having the team members stand rather than sit keeps meetings short and to the point. This ad hoc meeting style prevents talkers from getting too comfortable, implies the intended briefness of the meeting, and puts the focus on just the assignments for the day rather on than war stories, doughnuts, and off-topic conversations.
3. Decomposition. If you’re having trouble estimating how long it will take to complete an activity, the associated work package probably isn’t decomposed enough. Work with the project team to break down the activity to provide enough detail so that you can create a more accurate estimate.
4. Milestones. Milestones are ideal times to review project performance, predict future performance, and involve the project customer in scope verification of what you’ve created so far in the project. Early in the project, it’s a good idea to have many milestones to build confidence, provide opportunities for confirmation, and generate momentum as the project moves forward.
5. Documentation. Chances are that the projects you manage within your company are similar. If you want to save time in the future, document your current project experiences. By documenting the actual duration of current project activities, you can create a database for future time estimating. You can also treat the current project duration as a baseline for performance to see if your project team is getting better or worse at completing the project tasks.