
13 Debugging and Problem Solving the Hyper-V Host and Guest Operating System
IN THIS CHAPTER
![]() Using the Task Manager for Logging and Debugging
Using the Task Manager for Logging and Debugging
![]() Using Event Viewer for Logging and Debugging
Using Event Viewer for Logging and Debugging
Up until this chapter, this book has focused on planning and implementing the Hyper-V host and guest sessions. This chapter pays attention to the built-in management tools for monitoring, logging, debugging, and validating reliability, which help organizations identify and isolate problems in their Hyper-V and networking environments. Unlike other Windows application servers where the analysis of problems on a server is typically isolated to a specific application, whether that is SharePoint, or Exchange, or global catalog services, for Hyper-V, because the host server acts as the basis of a full network, and guest sessions can be running a variety of applications, the debugging and problem-solving efforts take on the same task of assessing problems in a full enterprise network.
Many of the tools identified in this chapter are similar to those used in Windows Server 2003; however, as with most features of the Windows Server family of products, the features and functionality of the tools have been improved and expanded upon in Windows 2008.
This chapter covers the Task Manager for logging and debugging issues, the new Event Viewer for monitoring and troubleshooting system issues, the completely redesigned Performance and Reliability Monitoring tool, and additional debugging tools available with Windows 2008.
Using the Task Manager for Logging and Debugging
The Task Manager is a familiar monitoring tool found in Windows 2008. Ultimately, the tool is similar to the Task Manager included with earlier versions of Windows such as Windows Server 2003. It still provides an instant view of system resources, such as processor activity, process activity, memory usage, networking activity, user information, and resource consumption. However, there are some noticeable changes, including the addition of a Services tab and the ability to launch the Resource Monitor directly from the Performance tab.
The Windows 2008 Task Manager is useful for an immediate view of key system operations. It comes in handy when a user notes slow response time, system problems, or other nondescript problems with the network. With just a quick glance at the Task Manager, you can see whether a server is using all available disk, processor, memory, or networking resources.
There are three ways to launch the Task Manager:
![]() Method 1—Right-click the taskbar and select Task Manager.
Method 1—Right-click the taskbar and select Task Manager.
![]() Method 2—Press Ctrl+Shift+Esc.
Method 2—Press Ctrl+Shift+Esc.
![]() Method 3—Press Ctrl+Alt+Del, and select Start Task Manager.
Method 3—Press Ctrl+Alt+Del, and select Start Task Manager.
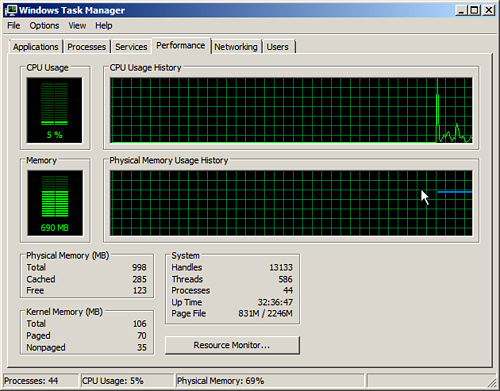
When the Task Manager loads, you will notice six tabs, as shown in Figure 13.1.
FIGURE 13.1 The Windows Task Manager.
If you are working on other applications and want to hide the Task Manager, deselect Always on Top in the Task Manager’s Options menu. In addition, select Hide When Minimized to Keep the Task Manager off the taskbar when minimized.
The following sections provide a closer look at how helpful the Task Manager components can be.
Monitoring Applications
The first tab on the Task Manager is the Applications tab. The Applications tab provides a list of tasks in the left column and the status of these applications in the right column. The status information enables you to determine whether an application is running and allows you to terminate an application that is not responding. To stop such an application, highlight the particular application and click End Task at the bottom of the Task Manager. You can also switch to another application if you have several applications running. To do so, highlight the program and click Switch To at the bottom of the Task Manager. Finally, you can create a dump file that can be used when a point-in-time snapshot of every process running is needed for advanced troubleshooting. To create a dump file, right-click an application and select Create Dump File.
Monitoring Processes
The second Task Manager tab is the Processes tab. It provides a list of running processes, or image names, on the server. It also measures the performance in simple data format. This information includes CPU percent used, memory allocated to each process, and username used in initiating a process, which includes system, local, and network services.
You can sort the processes by clicking the CPU or Memory (Private Working Set) column header. The processes are then sorted in order of usage. This way, you can tell which one is using the most of these resources and is slowing down performance of your server. You can terminate a process by selecting the process and clicking the End Process button.
Many other performance or process measures can be removed or added to the Processes tab. They include, but are not limited to, process identifier (PID), CPU time, session ID, and page faults. To add these measures, select View, Select Columns to open the Select Column property page. Here, you can add process counters to the process list or remove them from the list.
Monitoring Services
The newest edition to the family of Task Manager tabs is the Services tab. When selected, you can quickly assess and troubleshoot a specific service by viewing whether it has stopped or is still running. The Services tab also offers additional key details, including the service name, service description, and service group. In addition, it is also possible to launch the Services snap-in if there is a need to make changes to a specific service. For example, if you know a given service should be running and you don’t see it running on the Processes tab (a common one is spoolsvc.exe, which is the Windows Print Spooler service executable), you can just go to the Services tab and attempt to start the service from there. It’s very rudimentary; but in keeping with what Task Manager is typically used for, it does offer a quick overview of system status and preliminary problem resolution.
Monitoring Performance
The Performance tab enables you to view the CPU and physical memory usage in graphical form. This information proves especially useful when you need a quick view of a performance bottleneck.
The Performance tab makes it possible to graph a percentage of processor time in Kernel mode. To show this, select View, Show Kernel Times. The kernel time is represented by the red line in the graph. The kernel time is the measure of time that applications are using operating system services. The other processor time is known as User mode. User mode processor time is spent in threads that are spawned by applications on the system.
If your server has multiple CPU processors installed, you can view multiple CPU graphs at a time by selecting View, CPU History and choosing either One Graph Per CPU or One Graph, All CPUs.
Also on the Performance tab, you will find a button labeled Resource Monitor. You can invoke Resource Monitor for additional analysis of the system.
Monitoring Network Performance
The Networking tab provides a measurement of the network traffic for each adapter on the local server in graphical form, as shown in Figure 13.2.
FIGURE 13.2 The Networking tab on the Windows Task Manager.
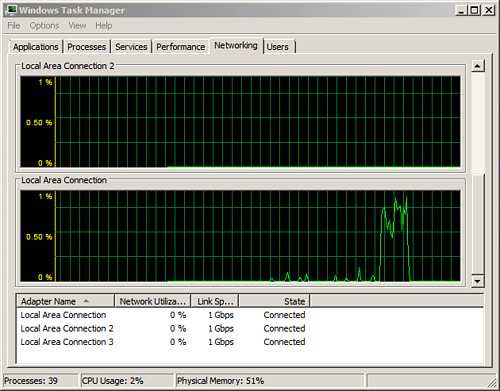
For multiple network adapters—whether they are dial-up, a local area network (LAN) connection, a wide area network (WAN) connection, a virtual private network (VPN) connection, or the like—the Networking tab displays a graphical comparison of the traffic for each connection. It provides a quick overview of the adapter, network utilization, link speed, and state of your connection.
To show a visible line on the graph for network traffic on any interface, the view automatically scales to magnify the view of traffic versus available bandwidth. The graph scales from 0% to 100% if the Auto Scale option is not enabled. The greater the percentage shown on the graph, the less is the magnified view of the current traffic. To autoscale and capture network traffic, select Options, Auto Scale.
It is possible to break down traffic on the graph into Bytes Sent, Received, and Total Bytes by selecting View, Network Adapter History and checking the selections you want graphed. This can be useful if you determine the overall throughput is high and you need to quickly determine whether inbound or outbound traffic is an issue. In this situation, the default setting is displayed in Total Bytes.
You can also add more column headings by selecting View, Select Columns. Various network measures can be added or removed; they include Bytes Throughput, Bytes Sent/Interval, Unicast Sent and Received, and so on.
If you suspect a possible network server problem, launch the Task Manager and quickly glance at the CPU utilization, memory available, process utilization, and network utilization information. When the utilization of any or all of these items exceeds 60% to 70%, there might be a bottleneck or overutilization of the resource. However, if all the utilization information shows demand being less than 5%, the problem is probably not related to server operations.
Monitoring User Activity
The final tab on the Task Manager is the Users tab, which displays a list of the users who are connected to or logged on to the server, session status, and names. The Hyper-V host typically doesn’t have users logged in to the host system, but guest sessions and the applications running on the guest sessions may have users logged on to access Web services, email messages, file and print content, and the like. So this function may be more applicable to Hyper-V guests than to the Hyper-V host itself. The following five columns are available on the Users tab:
![]() User—Shows the users logged on the server. As long as the user is not connected via a console session, it is possible to remote control the session or send a message. Remote control can be initiated by right-clicking the user and selecting Remote Control. The level of control is dictated by the security settings configured in Remote Desktop.
User—Shows the users logged on the server. As long as the user is not connected via a console session, it is possible to remote control the session or send a message. Remote control can be initiated by right-clicking the user and selecting Remote Control. The level of control is dictated by the security settings configured in Remote Desktop.
![]() ID—Displays the numeric ID that identifies the session on the server.
ID—Displays the numeric ID that identifies the session on the server.
![]() Client Name—Specifies the name of the client computer using the session, if applicable.
Client Name—Specifies the name of the client computer using the session, if applicable.
![]() Status—Displays the current status of a session. Sessions can be either Active or Disconnected.
Status—Displays the current status of a session. Sessions can be either Active or Disconnected.
![]() Session—Displays which session the user is logged on with.
Session—Displays which session the user is logged on with.
Using Event Viewer for Logging and Debugging
Event Viewer is the next tool to use when debugging, problem solving, or troubleshooting to resolve a problem with a Windows 2008 system. Event Viewer, as shown in Figure 13.3, is a built-in Windows 2008 tool completely rewritten based on an Extensible Markup Language (XML) infrastructure, which is used for gathering troubleshooting information and conduction diagnostics. Event Viewer has been completely rewritten in Windows 2008, and many new features and functionality have been introduced, including a new user interface and a home page, which includes an overview and summary of the system.
FIGURE 13.3 Event Viewer, including the Overview and Summary pane.

The upcoming sections focus on the basic elements of an event, including detailed sections covering the new features and functionality.
Microsoft defines an event as any significant occurrence in the operating system or an application that requires tracking of the information. An event is not always negative. A successful logon to the network, a successful transfer of messages, or replication of data can also generate an event in Windows. It is important to sift through the events to determine which are informational events and which are critical events that require attention.
When server or application failures occur, Event Viewer is one of the first places to check for information. Event Viewer can be used to monitor, track, view, and audit security of your server and network. It is used to track information of both hardware and software contained in your server. The information provided in Event Viewer can be a good starting point to identify and track down the root cause of any system errors or problems.
Event Viewer can be accessed through the Administrative Tools menu, or by right-clicking the My Computer icon on the desktop and selecting Manage, or by expanding the Diagnostics section of the new Server Manager MMC snap-in. You can also launch Event Viewer by running the Microsoft Management Console (Start, Run, mmc.exe, and adding the snap-in) or through a command line by running eventvwr.msc.
Each log has common properties associated with its events. The following bullets define these properties:
![]() Level—This property defines the severity of the event. An icon appears next to each type of event. It helps to quickly identify whether the event is informational, a warning, or an error.
Level—This property defines the severity of the event. An icon appears next to each type of event. It helps to quickly identify whether the event is informational, a warning, or an error.
![]() Date and Time—This property indicates the date and time that the event occurred. You can sort events by date and time by clicking this column. This information proves particularly helpful in tracing back an incident that occurred in the past, such as a hardware upgrade before your server started experiencing problems.
Date and Time—This property indicates the date and time that the event occurred. You can sort events by date and time by clicking this column. This information proves particularly helpful in tracing back an incident that occurred in the past, such as a hardware upgrade before your server started experiencing problems.
![]() Source—This property identifies the source of the event, which can be an application, remote access, a service, and so on. The source is useful in determining what caused the event.
Source—This property identifies the source of the event, which can be an application, remote access, a service, and so on. The source is useful in determining what caused the event.
![]() Event ID—Each event has an associated event ID, which is a numeral generated by the source and is unique to each type of event. You can use the event ID on the Microsoft Support website (www.microsoft.com/technet/) to find topics and solutions related to an event on your server.
Event ID—Each event has an associated event ID, which is a numeral generated by the source and is unique to each type of event. You can use the event ID on the Microsoft Support website (www.microsoft.com/technet/) to find topics and solutions related to an event on your server.
![]() Task Category—This property determines the category of an event. Task Category examples from the Security log include Logon/Logoff, System, Object Access, and others.
Task Category—This property determines the category of an event. Task Category examples from the Security log include Logon/Logoff, System, Object Access, and others.
Examining the New Event Viewer User Interface
The interface for Event Viewer in Windows 2008 has changed significantly from earlier versions. Although the information produced by logged events remains much the same, it’s important to be familiar with the new interface to take advantage of the new features and functionality.
Administrators accustomed to using the latest Microsoft Management Console (MMC) 3.0 will notice similarities in the new look and feel of the Event Viewer user interface. The navigation tree on the leftmost pane of the Event Viewer window lists the events and logs available to view and also introduces new folders for creating custom event views and subscriptions from remote systems. The central Details pane, located in the center of the console, displays relevant event information based on the folder selected in the navigation tree. The central Details pane also includes a new layout to bolster the administrator’s experience by summarizing administrative events by date and criticality, providing log summaries, and displaying recently viewed nodes. Finally, the Tasks pane, located on the extreme right side of the window, contains context-sensitive actions depending on the focus in the Event Viewer snap-in.
The folders residing in the leftmost pane of the Event Viewer are organized by the following elements:
![]() Custom Views
Custom Views
![]() Windows Logs
Windows Logs
![]() Applications and Services Logs
Applications and Services Logs
![]() Subscriptions
Subscriptions
The Custom Views Folder
Custom views are filters either created automatically by Windows 2008 when new server roles or applications such as Active Directory Certificate Services, DHCP Server, and Office 2007 are added to the system or manually by administrators. It is important for administrators to have the ability to create filters that target only the events they are interested in viewing to quickly diagnose and remediate issues on the Windows 2008 system and infrastructure. By expanding the Custom Views folder in the Event Viewer navigation tree and right-clicking Administrative Events, selecting Properties, and clicking the Edit Filter button, you can see how information from the event log is parsed into a set of filtered events. The Custom View Properties Filter tab is displayed in Figure 13.4. In the built-in Administrative Events custom views, all critical, error, and warning events are captured for all event logs. Instead of looking at the large number of informational logs captured by Windows 2008 and cycling through each Windows log, this filter gives the administrator a single place to go and quickly check for any potential problems contained on the system.
Also listed in the Custom View section of Event Viewer are predefined filters created by Windows 2008 when new roles are added to the system. These queries cannot be edited; however, they provide events related to all Windows 2008 roles and can be used to quickly drill down into issues affecting the performance of the system as it relates to specific server roles. Again, this is a way of helping an administrator find the information needed to identify and ultimately resolve server problems quickly and efficiently.
Creating a New Custom View
To create a new custom view, in Event Viewer right-click the Custom View folder and select Create Custom View. Alternatively, select Custom View from the Action menu. This results in the Custom View Properties box, as illustrated in Figure 13.4.
First, decide whether you want to filter events based on date; if so, specify the date range by using the Logged drop-down list. Options include Any Time, Custom Range, and specific time intervals. The next step is to specify the Event Level criteria to include in the custom view. Options include Critical, Error, Warning, Information, and Verbose. After the
FIGURE 13.4 The Filter tab located in the Custom View Properties page.

Event Level settings are specified, the next area to focus on is the By Log and By Source sections. By leveraging the drop-down lists, specify the event log and event log sources to be included in this custom filter. To further refine the custom filter, enter specific event IDs, task categories, keywords, users, computers, and then click OK and save the filter by providing it a name, description, and the location of where to save the view.
Performance and memory consumption will be negatively affected if you have included too many events in the custom view.
After the custom view is defined, it can be exported as an XML file, which can then be imported into other systems. Filters can also be written or modified directly in XML, but keep in mind that after a filter has been modified using the XML tab, it can no longer be edited using the GUI described previously.
The Windows Logs Folder
The Windows Logs folder contains the traditional application, security, and system logs. Windows 2008 also introduces two new out-of-the-box logs, which can also be found under the Windows Logs folder—the Setup and Forwarded Events logs. The following is a brief description of the different types of Windows logs that are available:
![]() Application log—This log contains events based on applications or programs residing on the system.
Application log—This log contains events based on applications or programs residing on the system.
![]() Security log—Depending on the auditing settings configured, the Security log captures events specific to authentication and object access.
Security log—Depending on the auditing settings configured, the Security log captures events specific to authentication and object access.
![]() Setup log—This new log captures information tailored toward installation of applications, server roles, and features.
Setup log—This new log captures information tailored toward installation of applications, server roles, and features.
![]() System log—Failures associated with Windows system components are logged to the System log. This might include driver errors or other components failing to load.
System log—Failures associated with Windows system components are logged to the System log. This might include driver errors or other components failing to load.
![]() Forwarded Events log—Because computers can experience the same issues, this new feature consolidates and stores events captured from remote computers into a single log to facilitate problem isolation, identification, and remediation.
Forwarded Events log—Because computers can experience the same issues, this new feature consolidates and stores events captured from remote computers into a single log to facilitate problem isolation, identification, and remediation.
The Applications and Services Logs Folder
The Applications and Services Logs folder introduces a new way to logically organize, present, and store events based on a specific Windows application, component, or service instead of capturing events that affect the whole system. An administrator can easily drill into a specific item such as DFS Replication or DNS Server and easily review those events without being bombarded or overwhelmed by all the other systemwide events.
These logs include fours subtypes: Admin, Operational, Analytic, and Debug logs. The events found in Admin logs are geared toward end users, administrators, and support personnel. This log is very useful because it not only describes a problem, but also identifies ways to deal with the issues. Operational logs are also a benefit to systems administrators, but they typically require more interpretation.
Analytic and Debug logs are more complex. Analytic logs trace an issue and often a high number of events are captured. Debug logs are primarily used by developers to debug applications. Both Analytic and Debug logs are hidden and disabled by default. To view them, right-click Applications and Services Logs, and then select View, Show Analytic and Debug Logs.
The Subscriptions Folder
The final folder in the Event Viewer console tree is called Subscriptions. Subscriptions is another new feature included with the Windows 2008 Event Viewer. It allows remote computers to forward events; therefore, they can be viewed locally from a central system. For example, if you are experiencing issues between two Windows 2008 systems, diagnosing the problem becomes challenging because both systems typically log data to their respective event logs. In this case, it is possible to create a subscription on one of the servers to forward the event log data from the other server. Therefore, both system event logs can be reviewed from a central system.
Configuring Event Subscriptions Use the following steps to configure event subscriptions between two systems.
First, each source computer must be prepared to send events to remote computers:
1. Log on to the source computer. Best practice is to log on with a domain account that has administrative permissions on the source computer.
2. From an elevated command prompt, run winrm quickconfig. Exit the command prompt.
3. Add the collector computer to the Local Administrators group of the source computer.
4. Log on to the collector computer following the steps outlined previously for the source system.
5. From an elevated command prompt, run wecutil qc.
6. If you intend to manage event delivery optimization options such as Minimize Bandwidth or Minimize Latency, also run winrm quickconfig on the collector computer.
After the collector and source computers are prepared, a subscription must be made identifying the events that will be pulled from the source computers. To create a new subscription, complete the following steps:
1. On the collector computer, run Event Viewer with an account with administrative permissions.
2. Click the Subscriptions folder in the console tree and select Create Subscription or right-click and select the same command from the context menu.
3. In the Subscription Name box, type a name for the subscription.
4. In the Description box, enter an optional description.
5. In the Destination Log box, select the log file where collected events will be stored. By default, these events are stored in the forwarded events log in the Windows Logs folder of the console tree.
6. Click Select Computers to select the source computers that will be forwarding events. Add the appropriate domain computers, and click OK.
7. Click Select Events and configure the event logs and types to collect. Click OK.
8. Click OK to create the subscription.
Conducting Additional Event Viewer Management Tasks
Now that we understand the functionality of each of the new folders associated with the newly improved Event Viewer included with Windows 2008, it is beneficial to review the upcoming sections for additional management tasks associated with Event Viewer. These tasks include the following:
![]() Saving event logs
Saving event logs
![]() Organizing data
Organizing data
![]() Viewing logs on remote servers
Viewing logs on remote servers
![]() Archiving events
Archiving events
![]() Customizing the event log
Customizing the event log
![]() Understanding the Security log
Understanding the Security log
Saving Event Logs
Event logs can be saved and viewed at a later time. You can save an event log by either right-clicking a specific log and choosing Save Events As or by picking individual events from within a log, right-clicking the selected events, and choosing Save Selected Items. Entire logs and selected events can also be saved by selecting the same command from the Actions pane. After being saved, these logs can be opened by right-clicking the appropriate log and selecting Open Saved Log or by clicking the same command in the Actions pane. After a log has been opened, it displays in a new top-level folder called Saved Logs from within Event Viewer.
Organizing Data
Vast numbers of logs can be collected by Windows and displayed in the central pane of Event Viewer. New tools or enhancement to old ones make finding useful information much easier than in any other iteration of Event Viewer:
![]() Sorting—Events can be sorted by right-clicking the folder or Custom View icon and then selecting View, Sort By. Select the column name on which to sort on in the leftmost pane or clicking the column to be sorted or the heading. Right-click the View item in the Actions pane and select Sort By. Finally, select the column in which sorting is desired. This is a quick way to find items at a very high level (for example, by time, source, or event ID). The new features for finding and sorting data are more robust and well worth learning.
Sorting—Events can be sorted by right-clicking the folder or Custom View icon and then selecting View, Sort By. Select the column name on which to sort on in the leftmost pane or clicking the column to be sorted or the heading. Right-click the View item in the Actions pane and select Sort By. Finally, select the column in which sorting is desired. This is a quick way to find items at a very high level (for example, by time, source, or event ID). The new features for finding and sorting data are more robust and well worth learning.
![]() Selection and sorting of column headings—Various columns can be added to or removed from any of the event logs. The order in which columns display from left to right can be altered, too, by selecting the column in the Select Column dialog box and clicking the up- or down-arrow button.
Selection and sorting of column headings—Various columns can be added to or removed from any of the event logs. The order in which columns display from left to right can be altered, too, by selecting the column in the Select Column dialog box and clicking the up- or down-arrow button.
![]() Grouping—A new way to view event log information is through the grouping function. By right-clicking column headings, an administrator can opt to group the event log being viewed by any of the columns in view. By isolating events, desired and specific criteria trends can be spotted that can help in isolating issues and ultimately resolving problems.
Grouping—A new way to view event log information is through the grouping function. By right-clicking column headings, an administrator can opt to group the event log being viewed by any of the columns in view. By isolating events, desired and specific criteria trends can be spotted that can help in isolating issues and ultimately resolving problems.
![]() Filtering—As mentioned earlier, filtering, like grouping, provides a means to isolate and display only the data you want to see in Event Viewer. Filtering, however, gives the administrator many more options for determining which data should be displayed than grouping or sorting. Filters can be defined based on any or all of the event levels, log or source, event IDs, task category, keywords, or user or computers. After being created, filters can be exported for use on other systems.
Filtering—As mentioned earlier, filtering, like grouping, provides a means to isolate and display only the data you want to see in Event Viewer. Filtering, however, gives the administrator many more options for determining which data should be displayed than grouping or sorting. Filters can be defined based on any or all of the event levels, log or source, event IDs, task category, keywords, or user or computers. After being created, filters can be exported for use on other systems.
![]() Tasks—By attaching tasks to events, logs, or custom views, administrators can bring some automation and notification into play when certain events occur. To create a task, just right-click the custom view, built-in log, or specific event of your choice, and then right-click Attach a Task to This Custom View, Log, or Event. The Create a Basic Task Wizard then launches. On the first tab, just select a name and description for the task. Click Next to view the criteria that will trigger the task action. (This section cannot be edited and is populated based on the custom view, log, or task selected when the wizard is initiated.) Click Next and select Start a Program, Send an E-mail, or Display a Message as desired.
Tasks—By attaching tasks to events, logs, or custom views, administrators can bring some automation and notification into play when certain events occur. To create a task, just right-click the custom view, built-in log, or specific event of your choice, and then right-click Attach a Task to This Custom View, Log, or Event. The Create a Basic Task Wizard then launches. On the first tab, just select a name and description for the task. Click Next to view the criteria that will trigger the task action. (This section cannot be edited and is populated based on the custom view, log, or task selected when the wizard is initiated.) Click Next and select Start a Program, Send an E-mail, or Display a Message as desired.
Viewing Logs on Remote Servers
You can use Event Viewer to view event logs on other computers on your network. To connect to another computer from the console tree, right-click Event Viewer (Local) and click Connect to Another Computer. Select Another Computer and then enter the name of the computer or browse to it and click OK. You must be logged on as an administrator or be a member of the Administrators group to view event logs on a remote computer. If you are not logged on with adequate permissions, you can select the Connect as Another User check box and set the credentials of an account that has proper permissions to view the logs on the remote computer.
Archiving Events
Occasionally, you might need to archive an event log. Archiving a log copies the contents of the log to a file. Archiving is useful in creating benchmark records for the baseline of a server or for storing a copy of the log so that it can be viewed or accessed elsewhere. When an event log is archived, it is saved in one of four forms:
![]() Comma-delimited text file (.csv)—This format allows the information to be used in a program such as Microsoft Excel.
Comma-delimited text file (.csv)—This format allows the information to be used in a program such as Microsoft Excel.
![]() Text-file format (.txt)—Information in this format can be used in a program such as a word processing program.
Text-file format (.txt)—Information in this format can be used in a program such as a word processing program.
![]() Log file (.evtx)—This format allows the archived log to be viewed again in the Windows 2008 or Windows Vista Event Viewer. Note that the new event log format is XML, which earlier versions of Windows cannot read.
Log file (.evtx)—This format allows the archived log to be viewed again in the Windows 2008 or Windows Vista Event Viewer. Note that the new event log format is XML, which earlier versions of Windows cannot read.
![]() XML (.xml)—This format saves the event log in raw XML. XML is used throughout Event Viewer for filters, tasks, and logging.
XML (.xml)—This format saves the event log in raw XML. XML is used throughout Event Viewer for filters, tasks, and logging.
The event description is saved in all archived logs. To archive, right-click the log to be archived and click Save Log File As. In the File Name field of the resulting property page, type in a name for the archived log file, choose a file type from the file format options of .csv, .txt, .evtx, or .xml, and then click Save.
You must be a member of the Backup Operators group at the minimum to archive an event log.
Logs archived in the new log-file format (.evtx) can be reopened using the Windows 2008 Event Viewer utility. Logs saved in log-file format retain the XML data for each event recorded. Event logs, by default, are stored on the server where the Event Viewer utility is being run. Data can, however, be archived to a remote server by just providing a UNC path (such as \servernameshare) when entering a filename.
Logs archived in comma-delimited (.csv) or text (.txt) format can be reopened in other programs such as Microsoft Word or Excel. These two formats do not retain the XML data or formatting.
Customizing the Event Log
The properties of an event log can be configured. In Event Viewer, the properties of a log are defined by general characteristics: log path, current size, date created, when last modified or accessed, maximum size, and what should be done when the maximum log size is reached.
To customize the event log, access the properties of the particular log by highlighting the log and selecting Action and then Properties. Alternatively, you can right-click the log and select Properties to display the General tab of the log’s property page, as shown in Figure 13.5.
FIGURE 13.5 Selecting properties for the event log.
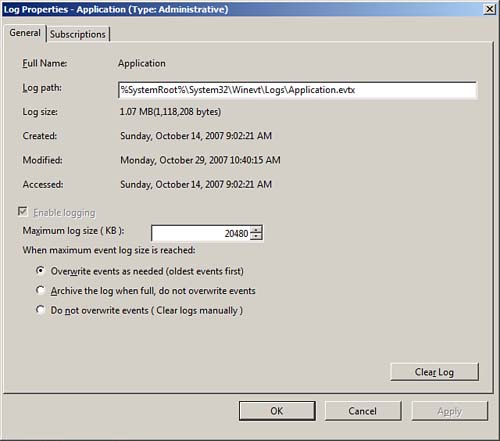
The Log Size section specifies the maximum size of the log and the subsequent actions to take when the maximum log size limit is reached. The three options are as follows:
![]() Overwrite Events as Needed (Oldest Events First)
Overwrite Events as Needed (Oldest Events First)
![]() Archive the Log When Full, Do Not Overwrite Events
Archive the Log When Full, Do Not Overwrite Events
![]() Do Not Overwrite Events (Clear Logs Manually)
Do Not Overwrite Events (Clear Logs Manually)
If you select the Do Not Overwrite Events option, Windows 2008 stops logging events when the log is full. Although Windows 2008 notifies you when the log is full, you need to monitor the log and manually clear the log periodically so that new events can be tracked and stored in the log file.
In addition, log file sizes must be specified in multiples of 64KB. If a value is not in multiples of 64KB, Event Viewer automatically sets the log file size to a multiple of 64KB.
When you need to clear the event log, click the Clear Log button in the lower right of the property page.
Understanding the Security Log
Effectively logging an accurate and wide range of security events in Event Viewer requires an understanding of auditing in Windows 2008. It is important to know events are not audited by default. You can enable auditing in the local security policy for a local server, the domain controller security policy for a domain controller machine, and the Active Directory (AD) Group Policy Object (GPO) for a domain. Through auditing, you can track Windows 2008 security events. It is possible to request that an audit entry be written to the security event log whenever certain actions are carried out or an object such as a file or printer in AD is accessed. The audit entry shows the action carried out, the user responsible for the action, and the date and time of the action.
Performance and Reliability Monitoring
Performance is a basis for measuring how fast application and system tasks are completed on a computer, and reliability is a basis for measuring system operation. How reliable a system is will be based on whether it regularly operates at the level at which it was designed to perform. Based on their descriptions, it should be easy to recognize that performance and reliability monitoring are crucial aspects in the overall availability and health of a Windows 2008 infrastructure. To ensure maximum uptime, a well thought-through process needs to be put in place to monitor, identify, diagnose, and analyze system performance. This process should invariably provide a way to quickly compare system performances at varying instances in time, thus allowing you to detect and potentially prevent a catastrophic incident before it causes system downtime.
The Reliability and Performance Monitor, which is an MMC snap-in, provides myriad new tools for administrators so that they can conduct real-time system monitoring, examine system resources, collect performance data, and create performance reports from a single console. This tool is literally a combination of three legacy Windows Server monitoring tools: System Monitor, Performance Monitor, and Server Performance Advisor. However, new features and functionalities have been introduced to shake things up, including Data Collector Sets, resource view, Reliability Monitor, scheduling, diagnosis reporting, and wizards and templates for creating logs. To launch the Reliability and Performance Monitor MMC snap-in tool, select Start, All Programs, Administrative Tools, Reliability and Performance Monitor or enter perfmon.msc at a command prompt.
The Reliability and Performance Monitor MMC snap-in is composed of the following elements:
![]() Resource Monitor
Resource Monitor
![]() Performance Monitor
Performance Monitor
![]() Reliability Monitor
Reliability Monitor
![]() Data Collector Sets
Data Collector Sets
![]() Report Generation
Report Generation
The upcoming sections further explore these major elements found in the Reliability and Performance Monitoring tool.
Resource Monitor
The first area of interest in the Reliability and Performance Monitor snap-in is the Resource Overview screen, also known as the Resource Monitor. It is displayed as the home page in the central details pane when the Reliability and Performance Monitoring tool is invoked. Alternatively, you can review the Resource Overview screen by selecting Reliability and Performance in the navigation tree. Resource Monitor can also be launched from within the Performance tab on the Windows Task Manager.
The Resource Monitor Overview screen presents holistic, real-time graphical illustrations of a Windows 2008 system’s CPU usage, disk usage, network usage, and memory usage, as displayed in Figure 13.6.
FIGURE 13.6 Viewing the Resource Monitor Overview screen.
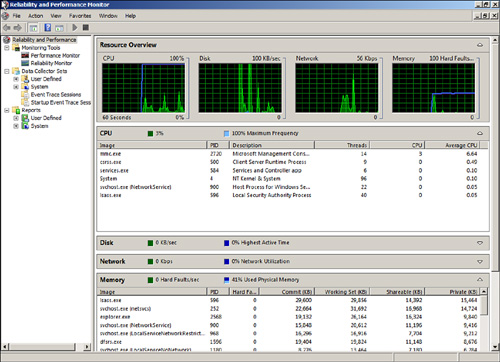
Additional process-level details can be viewed to better understand your system’s current resource usage by expanding subsections beneath the graphs. For example, when expanded, the CPU subsection includes CPU consumption by application, and the Disk subsection displays disk activity based on read and write operations. In addition, the Network subsection exhibits bytes being sent and received based on an application, and finally, the Memory subsection reveals information about the memory use of an application.
The Resource Monitor Overview screen is the first level of defense when there is a need to get a quick overview of a system’s resources. If quick diagnosis of an issue cannot be achieved, an administrator should leverage the additional tools within the Reliability and Performance Monitor. These are covered in the upcoming sections.
Performance Monitor
Windows 2008 comes with two tools for performance monitoring. The first tool is called Performance Monitor, and the second tool is known as Reliability Monitor. These tools together provide performance analysis and information that can be used for bottleneck, performance, and troubleshooting analysis.
First, defining some terms used in performance monitoring will help clarify the function of Performance Monitor and how it ties in to software and system functionality. The three components noted in the Performance Monitor, Data Collector Sets, and reports are as follows:
![]() Object—Components contained in a system are grouped into objects. Objects are grouped according to system functionality or by association within the system. Objects can represent logical entities such as memory or a physical mechanism such as a hard disk drive. The number of objects available in a system depends on the configuration. For example, if Microsoft Exchange Server is installed on a server, some objects pertaining to Exchange would be available.
Object—Components contained in a system are grouped into objects. Objects are grouped according to system functionality or by association within the system. Objects can represent logical entities such as memory or a physical mechanism such as a hard disk drive. The number of objects available in a system depends on the configuration. For example, if Microsoft Exchange Server is installed on a server, some objects pertaining to Exchange would be available.
![]() Counter—Counters are subsets of objects. Counters typically provide more detailed information for an object such as queue length or throughput for an object. The System Monitor can collect data through the counters and display it in either a graphical format or a text log format.
Counter—Counters are subsets of objects. Counters typically provide more detailed information for an object such as queue length or throughput for an object. The System Monitor can collect data through the counters and display it in either a graphical format or a text log format.
![]() Instances—If a server has more than one similar object, each one is considered an instance. For example, a server with multiple processors has individual counters for each instance of the processor. Counters with multiple instances also have an instance for the combined data collected for the instances.
Instances—If a server has more than one similar object, each one is considered an instance. For example, a server with multiple processors has individual counters for each instance of the processor. Counters with multiple instances also have an instance for the combined data collected for the instances.
The Performance Monitor provides an interface that allows for the analysis of system data, research performance, and bottlenecks. The System Monitor displays performance counter output in line graphs, histogram (bar chart), and report format.
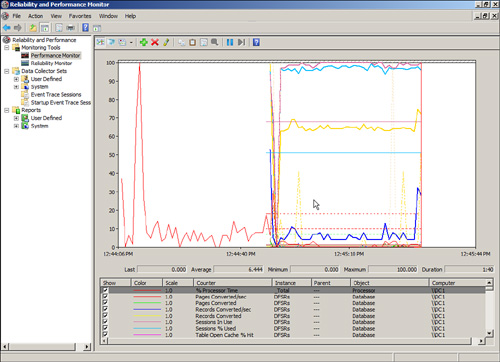
The histogram and line graphs can be used to view multiple counters at the same time, as shown in Figure 13.7. However, each data point displays only a single value that is independent of its object. The report view is better for displaying multiple values.
FIGURE 13.7 The graph view of the Performance Monitor.
Launching the Performance Monitor is accomplished by selecting Performance Monitor from the Monitoring Tools folder in the Reliability and Performance MMC snap-in. You can also open it from a command line by entering Perfmon.msc. When a new Performance Monitor session is started, it loads a blank system monitor graph into the console with % Processor Time as the only counter defined.
Adding Counters with Performance Monitor
Before counters can be displayed, they have to be added. The counters can be added simply by using the menu bar. The Counter button on the toolbar includes Add, Delete, and Highlight. You can use the Add Counter button to display new counters. On the other hand, use the Delete Counter button to remove unwanted counters from the display. The Highlight Counter button is helpful for highlighting a particular counter of interest; a counter can be highlighted with either a white or black color around the counter.
The following step-by-step procedures depict how to add counters to the Performance Monitor:
1. In the navigation tree of Event Viewer, first expand Reliability and Performance, Monitoring Tools, and then Performance Monitoring.
2. Either click the Add icon in the menu bar or right-click anywhere on the graph and select Add Counters.
Typical baseline counters consist of Memory - Pages / Sec, PhysicalDisk - Avg. Disk Queue Length, and Processor - % Processor Time.
3. The Add Counters dialog box is invoked, as shown in Figure 13.8. In the Available Counters section, select the desired counters, and then click the Add button.
FIGURE 13.8 Adding counters to Performance Monitor.
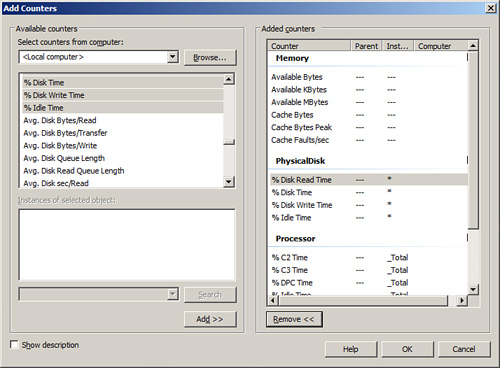
Windows 2008 includes a tremendous number of counters to choose from when conducting performance monitoring. It is challenging in this section to fully explain what each counter offers. If you want to find out more about a counter, enable the Show Description option in the Add Counters dialog box and highlight a specific counter to obtain a detailed explanation about it.
4. Review the selected counters in the Added Counters section, and then click OK.
When adding counters, it is possible to conduct remote monitoring by selecting counters from another system. To simplify things, it is also possible to search for instances of a counter and add a group of counters.
Managing Performance Monitor Settings
While back on the Performance Monitor display, update displays by clicking the Clear Display button. Clicking the Freeze Display button or pressing Ctrl+F freezes displays, which suspends data collection. Data collection can be resumed by pressing Ctrl+F or clicking the Freeze Display button again. Click the Update Data button to display an updated data analysis.
It is also possible to export and import a display by using the Cut and Paste buttons. For example, a display can be saved to the clipboard and then imported into another instance of the Performance Monitor. This is commonly used to view or analyze system information on a different system, such as information from a production server.
The Properties page of Performance Monitor has five additional tabs of configuration: General, Source, Data, Graph, and Appearance. Generally, the Properties page provides access to settings that control the graph grid, color, style of display data, and so on. Data can be saved from the monitor in different ways. The easiest way to retain the display features is to save the control as an HTML file.
The Performance Monitor enables you to also save log files in HTML or tab-separated (.tsv) format, which you can then analyze by using third-party tools such as Seagate Crystal Reports. Alternatively, a tab-separated file can be imported into a spreadsheet or database application such as Excel or Microsoft Access. Windows 2008 also enables you to collect data in SQL database format. This is useful for performance analysis at an enterprise level rather than a per-server basis. Reports displayed in Excel can help you better understand the data and provide reports to management. And by saving log files, you can save the results from Performance Monitor as an image. This is great when you need to obtain a point-in-time depiction of a performance graph.
Reliability Monitor
The Reliability Monitor is a brand-new tool first introduced with the release of Windows Vista and now reintroduced with Windows 2008. This enhanced system management tool is the second monitoring tool available with Microsoft’s Reliability and Performance Monitor MMC snap-in. Use this tool when you need help troubleshooting the root cause associated with reduced reliability of a Windows 2008 system. Reliability Monitor provides event details through system stability charts and reports that help diagnose items that might be negatively impacting the reliability of a system.
The tool uses a System Stability Index to rate the stability of a system each day over its lifetime by means of an index scorecard that identifies any reduction in reliability. An index rating of 1 represents a system in its least stable stage, whereas an index rating of 10 indicates a system in its most stable stage. Each day’s index rating is displayed in a System Stability Chart graph, as illustrated in Figure 13.9. This graph typically helps administrators to identify dates when stability issues with the Windows 2008 system occurred. Additional itemized system stability information can be found in an accompanying System Stability Report section of the Reliability Monitor screen. The additional stability information further assists by identifying the root cause of the reliability issues. This information is grouped into the following categories: Software Installs and Uninstalls, Application Failures, Hardware Failures, Windows Failures, and Miscellaneous Failures.
FIGURE 13.9 The Reliability Monitor screen.

Reliability Monitor is an essential tool for identifying and correlating problems with Windows 2008. With Reliability Monitor, an administrator can quickly identify changes in a system that caused a negative trend with system reliability. As such, this tool can also help administrators anticipate other problems, which ultimately leads to solving issues efficiently and effectively.
Data Collector Sets
The Data Collector Sets is a vital new feature available as a subfolder within the Reliability and Performance snap-in. The purpose of a Data Collector Set is to review or log system performance data. This is achievable through a single component that encompasses organized multiple data collection points. This information can then be analyzed to diagnose problems, correct system performance issues, or create baselines.
Performance counters, event trace data, and system configuration information are all data collector elements that can be captured and contained in a Data Collector Set. Data Collector Sets can be based on a predefined template, from a Data Collector Set that already exists, by creating it manually, with a wizard, or it can be user defined. Data Collector Sets can be exported and used for multiple systems, easing the administrative load involving the configuration of new systems producing more effective monitoring. Wizards facilitate the creation of Data Collector Sets and enable an administrator to quickly create collections based on server roles or the type of information that is required.
To create Data Collector Sets, you must be a member of the Administrators group or logged on with an account that is a member of the Performance Log Users group.
Creating Data Collector Sets
Data Collector Sets can be created manually from a template or from Performance Monitor. The following examples will help you to gain an understanding of the different ways to create Data Collector Sets.
To create a Data Collector Set from Performance Monitor, complete the following steps:
1. In the Reliability and Performance Monitor snap-in, navigate to Performance Monitor.
2. Add counters based on items you want to capture. For this example, the following counters were used: Memory - Pages / Sec, Physical Disk - Avg.Disk Queue Length, and Processor - % Processor Time.
3. After the counters are added, right-click anywhere on the Performance Monitor display screen or right-click Performance Monitor in the navigation tree, select New, and then select Data Collector Set. The Create New Data Collector Set Wizard is launched.
4. Enter a name for this new Data Collector Set on the Create New Data Collector Set page, and then click Next.
5. On the next page, specify where you want the data to be saved. The default path is the %systemdrive%PerfLogs. Click Finish to save the current settings and exit or click Next to enter a user account to run as.
6. Click the Change button to enter a user for this data set.
7. Select the option to Save and Close or Start This Data Collector Set Now, and then click Finish to complete the Data Collector Set creation process.
The resulting Data Collector Set can be configured to run immediately by right-clicking the new Data Collector Set and selecting Start. You can view the properties of the Data Collector Set by right-clicking and selecting Properties.
Data Collector Sets can be created, saved, or restored from templates. Many templates are built in and can be created using the Create New Data Collector Set Wizard in Windows Reliability and Performance Monitor. This wizard is invoked by right-clicking the User Defined folder, the Event Trace Sessions folder, or the Startup Event Trace Sessions folder under Data Collector Sets and selecting New, Data Collector Set.
To create a Data Collector Set from a template, complete the following steps:
1. Expand the Data Collector Sets folder and then the User Defined subfolder in the Reliability and Performance Monitor snap-in.
2. Right-click the User Defined subfolder and select New Data Collector Set to launch the Create New Data Collector Set Wizard.
3. Enter a name for this new Data Collector Set, select the Create from a Template option, and then click Next.
4. On the next page, select the desired template to use, and then click Next.
The Create New Data Collector Set Wizard offers three templates for creating Data Collector Sets: Basic, System Diagnostics, and System Performance. Use the Basic template when there is a need to create a basic Data Collector Set. The System Diagnostics template generates a report detailing the status of local hardware resources, system response times, system information, and configuration data. The Systems Performance template is leveraged when you want to not only generate a report detailing the status of local hardware resources and system response times, but also processes on the local computers.
In summary, typically the Basic template provides basic diagnostics, whereas the Systems Diagnostics template is good for maximizing performance and streamlining system operations, and the System Performance template is a good choice when you want to identify performance issues. Regardless of which template you use to create your Data Collector Set, you can edit the Data Collector Set afterward. In addition, it is possible to select the Browse button and import templates from other servers.
5. On the next page, specify where you want the data to be saved. The default path is the %systemdrive%PerfLogs. Click Finish to save the current settings and exit or click Next to enter a user account to run as.
6. Click the Change button to enter a user for this data set.
7. Select the option to Save and Close, Start This Data Collector Set Now, or Open Properties for This Data Collector Set, and then click Finish to complete the Data Collector Set creation process.
Reports
The final folder in the Reliability and Performance Monitor snap-in is Reports. The Reports folder provides diagnostic reports to support administrators in troubleshooting and diagnosing system performance problems, including reliability. Reports are viewed in the central details pane of the Reliability and Performance Monitor snap-in.
The reports are based on Data Collector Sets that were previously defined by users or preconfigured and included with Windows 2008 Reliability and Performance Monitor. The report console’s features and functionality are similar to those seen by means of the reports introduced with Server Performance Advisor in Windows Server 2003.
The Reports folder is broken into two main subfolders: User Defined reports and System reports. The default System reports typically include reports relating to LAN diagnostics, system diagnostics, and system performance. Additional system reports are automatically generated depending on the server role installed on the Windows 2008 system. For example, an Active Directory Diagnostics system report is automatically included in the console when the Active Directory Domain Services server role is installed on the Windows 2008 system.
Creating a User-Defined Report
The first step in creating a user-defined report is to create a user-defined Collector Set and define the parameters for a collection. After the user-defined Collector Set is created, data collection must be manually started or scheduled to run at a specific date. At this time, a report folder is automatically generated under the User Defined folder. After the report is created, you can review the contents by selecting it. When viewing reports, it is possible to expand specific items such as the report summary, diagnostic results, or CPU for additional information. This is depicted in the sample System Performance report in Figure 13.10.
FIGURE 13.10 Viewing the System Performance report.

Viewing Predefined System Reports
Another option for assessing system health and troubleshooting system anomalies is to leverage the predefined system reports. The following steps illustrate how to view these system reports:
1. In the Reliability and Performance Monitor navigation tree, expand the Data Collector Sets folder and then System.
2. Right-click one of the predefined Data Collector Sets such as System Diagnostics, and then click Start.
This starts the data-collection process.
3. Now expand the Reports folder, System, and then System Diagnostics.
4. Highlight the newly created report and review the contents of the report in the central Details pane.
The report generates and appears when the data-collection process is complete. The report is automatically tagged with the current date.
Setting Baseline Values
A baseline is a performance level that can be used as a starting point to compare against future network performance operations. When a server is first monitored, there is little to compare the statistics against. After a baseline is created, information can be gathered at any time in the future and compared against the baseline. The difference between the current statistics and the baseline statistics is the variance caused by system load, application processing, or system performance contention.
To be able to set a baseline value, you need to gather a normal set of statistics on each system that will eventually be monitored or managed in the future. Baselines should be created for normal and stressed times. The workload on a machine at night when there are fewer users connected to it provides a poor baseline to compare real-time data in the middle of the day. Information sampled in the middle of the day should be compared with a baseline of information collected at around the same time of day during normal load prior to the sample comparison.
Creating baselines should be an ongoing process. If an application or a new service is added to a server, a new baseline should be created so that any future comparisons can be made with a baseline with the most current status of system performance.
Reducing Performance Monitoring Overhead
Performance monitoring uses system resources that can affect the performance of a system and affect the data being collected. To ensure that performance monitoring and analyzing do not affect the machines being monitored themselves, you need to decrease the impact of performance monitoring. You can take some steps to ensure that performance-monitoring overhead is kept to a minimum on the server being monitored to create as accurate of an analysis on a system as possible:
![]() Use a remote server to monitor the target server. Servers can actually be dedicated to monitoring several remote servers. Although this might also lead to an increase in network bandwidth, at least the monitoring and tracking of information do not drastically degrade CPU or disk I/O as if the monitoring tool were actually running on the server being monitored.
Use a remote server to monitor the target server. Servers can actually be dedicated to monitoring several remote servers. Although this might also lead to an increase in network bandwidth, at least the monitoring and tracking of information do not drastically degrade CPU or disk I/O as if the monitoring tool were actually running on the server being monitored.
![]() Consider reducing the frequency of the data-collection interval, because more frequent collection can increase overhead on the server.
Consider reducing the frequency of the data-collection interval, because more frequent collection can increase overhead on the server.
![]() Avoid using too many counters. Some counters are costly in terms of taxing a server for system resources and can increase system overhead. Monitoring several activities at one time also becomes difficult.
Avoid using too many counters. Some counters are costly in terms of taxing a server for system resources and can increase system overhead. Monitoring several activities at one time also becomes difficult.
![]() Use logs instead of displaying graphs. The logs can then be imported into a database or report. Logs can be saved on hard disks not being monitored or analyzed.
Use logs instead of displaying graphs. The logs can then be imported into a database or report. Logs can be saved on hard disks not being monitored or analyzed.
Important Objects to Monitor
The numbers of system and application components, services, and threads to measure in Windows 2008 are so extensive that it is impossible to monitor thousands of processor, print queue, network, or storage usage statistics. Defining the roles a server plays in a network environment helps to narrow down what needs to be measured. Servers could be defined and categorized based on the function of the server, such as application server, file and print server, or services server such as DNS, domain controller, and so on.
Because servers perform different roles, and hence have different functions, it makes sense to monitor the essential performance objects. This helps prevent the server from being overwhelmed from the monitoring of unnecessary objects for measurement or analysis.
Overall, four major areas demand the most concern: memory, processor, disk subsystem, and network subsystem. They all tie into any role the server plays.
The following list describes objects to monitor based on the roles played by the server:
![]() Domain controller—Because the DC provides authentication, stores the Active Directory database, holds schema objects, and so on, it receives many requests. To be able to process all these requests, it uses up a lot of CPU resources, disks, memory, and network bandwidth. Consider monitoring memory, CPU, system, network segment, network interface, and protocol objects such as TCP, UDP, NBT, NetBIOS, and NetBEUI. Also worth monitoring are the Active Directory NTDS service and site server LDAP service objects. DNS and WINS also have applicable objects to be measured.
Domain controller—Because the DC provides authentication, stores the Active Directory database, holds schema objects, and so on, it receives many requests. To be able to process all these requests, it uses up a lot of CPU resources, disks, memory, and network bandwidth. Consider monitoring memory, CPU, system, network segment, network interface, and protocol objects such as TCP, UDP, NBT, NetBIOS, and NetBEUI. Also worth monitoring are the Active Directory NTDS service and site server LDAP service objects. DNS and WINS also have applicable objects to be measured.
![]() File and print server—The print servers that process intensive graphics jobs can utilize extensive resources of system CPU cycles very quickly. The file server takes up a lot of storage space. Monitor the PrintQueue object to track print spooling data. Also monitor CPU, memory, network segment, and logical and physical disks for both file and print data collection.
File and print server—The print servers that process intensive graphics jobs can utilize extensive resources of system CPU cycles very quickly. The file server takes up a lot of storage space. Monitor the PrintQueue object to track print spooling data. Also monitor CPU, memory, network segment, and logical and physical disks for both file and print data collection.
![]() Message collaboration server—A messaging server such as an Exchange Server 2007 uses a lot of CPU, disk, and memory resources. Monitor memory collection, cache, processor, system, and logical and physical disks. Exchange objects are added to the list of objects after Exchange is installed, such as message queue length or name-resolution response time.
Message collaboration server—A messaging server such as an Exchange Server 2007 uses a lot of CPU, disk, and memory resources. Monitor memory collection, cache, processor, system, and logical and physical disks. Exchange objects are added to the list of objects after Exchange is installed, such as message queue length or name-resolution response time.
![]() Web server—A web server is usually much less disk intensive and more dependent on processing performance or memory space to cache web pages and page requests. Consider monitoring the cache, network interface, processor, and memory usage.
Web server—A web server is usually much less disk intensive and more dependent on processing performance or memory space to cache web pages and page requests. Consider monitoring the cache, network interface, processor, and memory usage.
![]() Database server—Database servers such as Microsoft SQL Server 2008 can use a lot of CPU and disk resources. Database servers such as Microsoft SQL Server use an extensive amount of memory to cache tables and data, so RAM usage and query response times should be monitored. Monitoring objects such as system, processor, logical disk, and physical disk is helpful for overall system performance operations.
Database server—Database servers such as Microsoft SQL Server 2008 can use a lot of CPU and disk resources. Database servers such as Microsoft SQL Server use an extensive amount of memory to cache tables and data, so RAM usage and query response times should be monitored. Monitoring objects such as system, processor, logical disk, and physical disk is helpful for overall system performance operations.
Using the Debugging Tools Available in Windows Server 2008
Several useful tools are available in Windows 2008 for troubleshooting and diagnosing various problems ranging from TCP/IP connection issues to verification and maintenance issues. These tools also make it much easier for IT professionals and administrators, allowing IT personnel to focus on business improvement tasks and functions, not on simply running specific tools in the networking environment.
TCP/IP Tools
TCP/IP forms the backbone of communication and transportation in Windows 2008. Before you can communicate between machines, TCP/IP must be configured.
In Windows 2008, TCP/IP is installed by default during the OS installation and is impossible to add or remove through the GUI.
If a TCP/IP connection fails, you need to determine the cause or point of failure. Windows 2008 includes some dependable and useful tools to troubleshoot connections and verify connectivity. The tools described in the following eight sections are useful for debugging TCP/IP connectivity problems. Most of these tools have been updated to include switches for IPv4 and IPv6.
Ping
Ping stands for Packet Internet Groper. It is used to send an Internet Control Message Protocol (ICMP) echo request and echo reply to verify the availability of a local or remote machine. You can think of ping as a utility that sends a message to another machine asking “Are you still there?” By default in Windows 2008, ping sends out four ICMP packages and waits for responses back in one second. However, the number of packages sent or time to wait for responses can be changed through the options available for ping.
Besides verifying the availability of a remote machine, ping can help determine a name-resolution problem.
To use ping, go to a command prompt and enter Ping Targetname. Different parameters can be used with ping. To display them, enter Ping /? or Ping (without parameters).
The parameters for the Ping command are as follows:
-4—Specifies that IPv4 is used to ping. This parameter is not required to identify the
target host with an IPv4 address. It is required only to identify the target host by name.
-6—Specifies that IPv6 is used to ping. Just like -4, this parameter is not required to
identify the target host with an IPv6 address. It is required only to identify the target
host by name.
-a—Resolves the IP address to the hostname. The hostname of the target machine is
displayed if this command is successful.
-f—Requests that echo back messages are sent with the Don’t Fragment flag in
packets. This parameter is available only in IPv4.
-i ttl—Increases the timeout on slow connections. The parameter also sets the value
of the Time To Live (TTL). The maximum value is 255.
-j HostList—Routes packets using the host list, which is a series of IP addresses
separated by spaces. The host can be separated by intermediate gateways (loose
source route).
-k HostList—Similar to -j but hosts cannot be separated by intermediate gateways
(strict source route).
-l size—Specifies the length of packets in bytes. The default is 32. The maximum size
is 65,527.
-n count—Specifies the number of packets sent. The default is 4.
-r count—Specifies the route of outgoing and incoming packets. It is possible to specify
a count that is equal to or greater than the number of hops between the source and destination.
The count can be between 1 and 9 only.
-R—Specifies that the round-trip path is traced (available on IPv6 only).
-S count—Sets the time stamp for the number of hops specified by count. The count
must be between 1 and 4.
-S SrcAddr—Specifies the source address to use (available on IPv6 only).
-t—Specifies that Ping should continue sending packets to the destination until interrupted.
To stop and display statistics, press Ctrl+Break. To stop and quit ping, press
Ctrl+C.
-v TOS—Specifies the value of the type of service in the packet sent. The default is 0.
TOS is specified as a decimal value between 0 and 255.
-w timeout—Specifies the time in milliseconds for packet timeout. If a reply is not
received within the timeout, the Request Timed Out error message is displayed. The
default timeout is 4 seconds.
TargetName—Specifies the hostname or IP address of the destination to ping.
Some remote hosts can be configured to ignore ping traffic as a method of preventing acknowledgment (and thus as a security measure). Therefore, your inability to ping a server might not necessarily mean that the server is not operational, just that the server is not responding for some reason.
Tracert
Tracert is generally used to determine the route or path taken to a destination by sending ICMP packets with varying TTL values. Each router the packet meets on the way decreases the value of the TTL by at least one; invariably, the TTL is a hop count. The path is determined by checking the ICMP Time Exceeded messages returned by intermediate routers. Some routers do not return Time Exceeded messages for expired TTL values and are not captured by Tracert. In such cases, asterisks are displayed for that hop.
To display the different parameters that can be used with Tracert, open a command prompt and enter tracert (without parameters) to display help or type tracert /?. The parameters associated with Tracert are as follows:
-4—Specifies that tracert.exe can use only IPv4 for the trace.
-6—Specifies that tracert.exe can use only IPv6 for the trace.
-d—Prevents resolution of IP addresses of routers to their hostname. This is particularly
useful for speeding up results of Tracert.
-h maximumHops—Specifies the maximum number of hops to take before reaching the
destination. The default is 30 hops.
-j HostList—Specifies that packets use the loose source route option. Loose source
routing allows successive intermediate destinations to be separated by one or multiple
routers. The maximum number of addresses in the host list is nine. This parameter is
useful only when tracing IPv4 addresses.
-R—Sends packets to a destination in IPv6, using the destination as an intermediate
destination and testing reverse route.
-S—Specifies the source address to use. This parameter is useful only when tracing IPv6
addresses.
Tracert is a good utility to determine the number of hops and the latency of communications between two points. Even if an organization has an extremely high-speed connection to the Internet, if the Internet is congested or if the route a packet must follow requires forwarding the information between several routers along the way, the performance and, ultimately, the latency (or delay in response between servers) will cause noticeable communications delays.
Pathping
Pathping is a route-tracing tool that combines features of both Ping and Tracert commands, but with more information than either of those two commands provides. Pathping is most ideal for a network with routers or multiple routes between the source and destination hosts. The Pathping command sends packets to each router on its way to a destination, and then gets results from each packet returned from the router. Because Pathping computes the loss of packets from each hop, you can easily determine which router is causing a problem in the network.
To display the parameters in Pathping, open a command prompt and enter Pathping /?. The parameters for the Pathping command are as follows:
-4—Specifies that Pathping.exe can use only IPv4 for the trace.
-6—Specifies that Pathping.exe can use only IPv6 for the trace.
-g Host-list—Allows hosts to be separated by intermediate gateways.
-h maximumHops—Specifies the maximum number of hops before reaching the target.
The default is 30 hops.
-n—Specifies that it is not necessary to resolve the address to the hostname.
-p period—Specifies the number of seconds to wait between pings. The default is a
quarter of a second.
-q num_queries—Specifies the number of queries to each host along the route. The
default is three seconds.
-w timeout—Specifies the timeout for each reply in milliseconds.
Ipconfig
Ipconfig displays all TCP/IP configuration values. It is of particular use on machines running Dynamic Host Control Protocol (DHCP). It is used to refresh DHCP settings and to determine which TCP/IP configuration values have been assigned by DHCP. If Ipconfig is used without parameters, it displays IP addresses, subnet masks, and gateways for each of the adapters on a machine. The adapters can be physical network adapters or logical adapters such as dial-up connections.
Some of the parameters for Ipconfig are as follows:
/all—Displays all TCP/IP configuration values.
/displaydns—Displays the contents of the DNS client resolver cache.
/flushdns—Resets and flushes the contents of the DNS client resolver cache. This
includes entries made dynamically.
/registerdns—Sets manual dynamic registration for DNS names and IP addresses
configured on a computer. This is particularly useful in troubleshooting DNS name registration
or dynamic update problems between a DNS server and client.
/release [Adapter]—Sends a DHCP release message to the DHCP server to discard
DHCP-configured settings for adapters. This parameter is available only for DHCP-enabled
clients. If no adapter is specified, IP address configuration is released for all adapters.
/renew [Adapter]—Renews DHCP configuration for all adapters (if an adapter is not
specified) and for a specific adapter if the Adapter parameter is included. This parameter
is available only for DHCP-enabled clients.
/setclassid Adapter [classID]—Configures the DHCP class ID for a specific
adapter. You can configure the DHCP class ID for all adapters by using the wildcard (*)
character in place of Adapter.
/showclassid Adapter—Displays the DHCP class ID for a specific adapter.
/allcompartments—Displays information about all compartments.
/allocmpartments /all—Displays detailed information about all compartments.
Ipconfig determines the assigned configuration for a system such as the default gateway, DNS servers, local IP address, subnet mask, and so on. When you’re debugging network problems, you can use Ipconfig to validate that the proper TCP/IP settings have been set up for a system so that a server properly communicates on the network.
ARP
ARP stands for Address Resolution Protocol. ARP enables the display and modification of the ARP table on a local machine, which matches physical MAC addresses of machines to their corresponding IP addresses. ARP increases the speed of connection by eliminating the need to match MAC addresses with IP addresses for subsequent connections.
Some of the parameters for ARP are as follows:
-a [InetAddr] [-N IfaceAddr]—Displays the ARP table for all adapters on a
machine. Use Arp -a with the InetAddr (IP address) parameter to display the ARP
cache entry for a specific IP address.
-d InetAddr [IfaceAddr]—Deletes an entry with a specific IP address (InetAddr).
Use the IfaceAddr parameter (IP address assigned to the interface) to delete an entry in
a table for a specific interface. Use the wildcard character in place of InetAddr to delete
all entries.
-g [InetAddr] [-N IfaceAddr]—Similar to the -a parameter.
-s InetAddr EtherAddr [IfaceAddr]—Adds a static entry to the ARP cache that
resolves the IP address (InetAddr) to a physical address (EtherAddr). To add a static
ARP cache entry to the table for a specific interface, use the IP address assigned to the
interface (IfaceAddr).
Netstat
As its name implies, Netstat (or network statistics) is used to display protocol statistics for any active connections, monitor connections to a remote host, and monitor IP addresses or domain names of hosts with established connections.
The parameters for Netstat are as follows:
-a—Displays all connections and listening ports by hostname.
-an—Similar to the –a parameter, but displays connections and listening ports by IP
addresses.
-e—Displays Ethernet packets and bytes to and from the host.
-n—Displays address and port numbers without resolving the address to the hostname.
-o—Displays TCP connections and includes the corresponding process ID (PID). Used in
combination with –a, -n, and –p. Not available in earlier Windows versions.
-P protocol—Displays statistics based on the protocol specified. Protocols that can be
specified are TCP, UDP, TCPv6, or UDPv6. It can be used with –s to display TCP, UDP,
ICMP, IP, TCPv6, UDPv6, ICMPv6, or IPv6.
-s—Displays statistics on a protocol-by-protocol basis. Can be used with the –p parameter
to specify a set of protocols.
-r—Displays the route table. Information displayed includes network destination,
netmask, gateway, interface, and metric (number of hops).
[Parameter] Interval—Displays the information at every interval specified.
Interval is a numeral in seconds. Press Ctrl+C to stop the intervals.
Route
Route is particularly useful for troubleshooting incorrect static routes or for adding a route to a route table to temporarily bypass a problem gateway. Static routes can be used in place of implicit routes specified by a default gateway. Use Route to add static routes to forward packets going to a gateway specified by default to avoid loops, improve traffic time, and so on.
The parameters for Route are as follows:
-add—Adds a route to a table. Use –p to make the route persistent for subsequent
sessions.
-Delete—Deletes a route from the table.
-Print—Prints a route.
-change—Modifies an existing route.
-destination—Specifies the host address.
-gateway—Specifies the address of gateway for Route.
IF interface—Specifies the interface for the routing table to modify.
-mask Netmask—Uses the subnet mask specified by Netmask. If mask is not used, it
defaults to 255.255.255.255.
-METRIC Metric—Specifies the metric, or cost, for the route using the value Metric.
-f—Clears the routing table of all gateway entries.
-p—Used with -add to create a persistent route.
Nslookup
Nslookup is used to query DNS. You can think of Nslookup as a simple diagnostic client for DNS servers. It can operate in two modes: Interactive and Noninteractive. Use Noninteractive mode to look up a single piece of data. To look up more than one piece of data, use Interactive mode. To stop Interactive mode at any time, press Ctrl+B. To exit from the command, enter exit. If Nslookup is used without any parameters, it uses the default DNS name server for lookup.
The parameters for Nslookup are as follows:
-ComputerToFind—Looks up information for the specified ComputerToFind. By default,
it uses the current default DNS name server.
-Server—Specifies the server as the DNS name server.
-SubCommand—Specifies one or more Nslookup subcommands as a command-line
option. Enter a question mark (?) to display a list of subcommands available.
NetDiag
The Network Connectivity Tester (NetDiag) tool is a command-line diagnostic tool to test network connectivity, configuration, and security. It’s included with the Support Tools on the Windows 2008 media. The tool gathers information on and tests network configuration, network drivers, protocols, connectivity, and well-known target accessibility. This is a good tool to use right off the bat if you think there are problems with the network connectivity of a system.
One nice feature of the NetDiag.exe tool is that it does not require parameters, which makes it easy to use. Simple instructions can be given to the administrators who need to execute it, and the bulk of the time can be spent analyzing the results.
Although it doesn’t require any parameters, several are available:
/q—Displays quiet output (errors only).
/v—Displays verbose output.
/l—Logs to the NetDiag.log.
/debug—Displays even more verbose output.
/d: DomainName—Finds a domain controller in the domain.
/fix—Fixes minor problems.
/DCAccountEnum—Enumerates domain controller computer accounts.
/test: TestName—Runs the specified tests only.
/skip: TestName—Skips the specified tests.
When specifying tests to run or to skip, nonskippable tests will still be run.
DCDiag
The Domain Controller Diagnostic (DCDiag) tool analyzes the state of domain controllers and services in an Active Directory forest. It is installed when the Active Directory Domain Services (AD DS) role is added to a Windows 2008 installation. This is a great general-purpose test tool for checking the health of an Active Directory infrastructure.
Tests include domain controller connectivity, replication errors, permissions, proper roles, and connectivity, and other general Active Directory health checks. It can even run non-domain-controller-specific tests, such as whether a server can be promoted to a domain controller (the dcpromo test), or register its records properly in DNS (RegisterInDNS test).
DCDiag is run on domain controllers exclusively, with the exception of the dcpromo and RegisterInDNS tests.
When run without any parameters, the tests will be run against the current domain controller. This runs all the key tests and is usually sufficient for most purposes.
The parameters for DCDiag are as follows:
/s:DomainController—Uses the domain controller as the home server.
/n:NamingContext—Uses the specified naming context (NetBIOS, FQDN, or distinguished
name) to test.
/u:DomainUserName /p:{*¦Password¦""}—Uses the supplied credentials to run
the tool.
/a—Tests all domain controllers in the site.
/e—Tests all domain controllers in the enterprise.
/q—Displays quiet output (errors only).
/v—Displays verbose output.
/I—Ignores minor error messages.
/fix—Fixes minor problems.
/f:LogFile—Logs to the specified log file.
/ferr:ErrorLogFile—Logs errors to the specified log file.
/c—Comprehensively runs all tests.
/test:TestName—Runs the specified tests only.
/skip:TestName—Skips the specified tests.
When specifying tests to run or to skip, nonskippable tests will still be run.
DCDiag is automatically included on a Windows 2008 system when the AD DS role is added. Otherwise, on non–domain controllers, the utility can be added by adding the Remote Server Administration Tools feature in Server Manager.
System Startup and Recovery
The System Startup and Recovery utility stores system startup, system failure, and debugging information. It also controls the behavior (what to do) when a system failure occurs.
To open System Startup and Recovery, launch Control Panel, select System, Advanced System Settings, and click the Advanced tab in the Systems Settings dialog box, and then click Settings under Startup and Recovery to display a property page similar to the one shown in Figure 13.11.
FIGURE 13.11 The Startup and Recovery page.
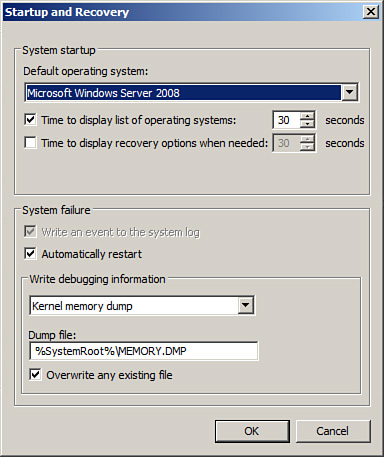
The Default Operating System field contains information that is displayed at startup. This information is typically the name of the operating system such as Windows Server 2008 Enterprise Edition. You can edit this information using bcdedit from a command prompt. If the machine is dual booted, there will be an entry for each operating system. The Time to Display List of Operating Systems option specifies the time the system takes to display the name of the operating system at startup. The default time is 30 seconds. This can be increased or reduced to a different time. The Time to Display Recovery Options When Needed is unchecked by default but can be selected and an interval in seconds entered.
You can set the action to be taken when system failure occurs in the System Failure section. There are two options. The first option is Write an Event to the System Log. This action is not editable in Windows 2008 because this action occurs by default every time a stop error occurs. The next option, Automatically Restart, reboots the system in the event of a system failure.
The Write Debugging Information section tells the system where to write debugging information when a system failure occurs. The options available include where the debugging information can be written to Small Memory Dump (128KB), Kernel Memory Dump, Complete Memory Dump, or (None). The Write Debugging Information To option requires a paging file on the boot volume, which should be the size of the physical RAM plus at least 1MB.
Memory resources can be saved if the Write Debugging Information To option is set to (None). The memory that would be saved depends on the server; the drivers that enable these features require about 60 to 70KB.
Windows Memory Diagnostics Tool
Many troubleshooting scenarios revolve around memory-related issues associated with a system. Typical memory issues can involve an errant application, a specific process consuming too much memory, or failing hardware such as bad RAM or the memory system on the motherboard. Thankfully, Windows 2008 has introduced a new tool for diagnosing problems associated with system memory.
By using Windows Memory Diagnostics tool, an administrator has another way to isolate root issues when a server is performing poorly or subject to crashes, or other when other abnormal behavior not caused by issues with the OS or installed applications occurs.
The Windows Memory Diagnostics tool can be launched as follows:
1. First save all work and close down open applications and utilities.
2. To invoke the tool, select Start, All Programs, Administrative Tools, Windows Memory Diagnostics Tool, or enter MdSched at a command prompt.
3. Select whether you want to Restart Now and Check for Problems or Check for Problems the Next Time I Start My Computer, as displayed in Figure 13.12.
FIGURE 13.12 The options associated with running the Windows Memory Diagnostics tool.
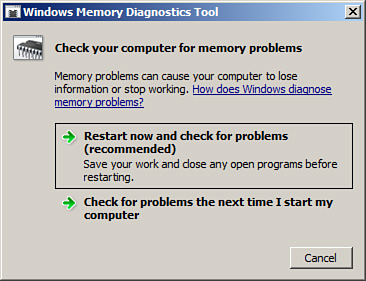
4. When the system is rebooted, the Diagnostics tool automatically launches and conducts a Basic test by using default settings. Additional Test Mix options, Cache options, and Pass Count can be selected by pressing F1. The Test Mix options consist of Basic, Standard, and Extended, whereas the Cache option includes Default, On, or Off. In addition, set the Pass Count value. The value represents the number of times the entire test mix will be repeated. Note a value of 0 represents infinitely. Press F10 to apply the settings and start the memory tests. Status is reported throughout the test indicating results.
The Windows Memory Diagnostics tool might not detect all the problems with the system RAM. Just because no errors are reported doesn’t mean the RAM or even the motherboard is working properly. Typically, the manufacturer of the hardware device will have additional diagnostics utilities that allow an administrator to conduct a deeper analysis of the root problems at the hardware level.
Resources and Support Tools
Software errors can be reported in Windows 2008. The error-reporting mechanism makes this happen. In addition, the Customer Experience Improvement Program (CEIP) enables the system to report information to Microsoft about computer hardware and usage.
The errors reported in the error-reporting mechanism and information derived from the CEIP can be sent automatically or when the user is prompted to notify Microsoft to help improve its future products.
You can manage the software error-reporting mechanism by launching Control Panel, selecting Problem Reports and Solution, and selecting the Customer Experience Improvement Settings or the Change Settings links. To change software error reporting, click the Advanced Settings link and turn problem reporting on or off by selecting the appropriate option button, as shown in Figure 13.13.
FIGURE 13.13 The Error Reporting screen.
Additional items can be configured, such as allowing each user to choose problem reporting settings, selecting the reporting settings for all users, and sending more information if it is needed to further assist in solving issues. Finally, it is possible to configure block lists, which prevents information being sent by specific programs.
This tool also helps solve problems on your computer by automatically checking online for solutions for errors logged to the system. For example, if a driver failed during installation, a fix might be presented when you check for new solutions.
The CEIP can be launched by clicking Configure CEIP, which is located in the Resources and Support section in Server Manager. When the dialog box is invoked, select whether you want to participate in the Windows Server Customer Experience Improvement Program and indicate the number of servers, desktops, and industry that best represents your organization.
The Windows Error Reporting can be launched by selecting Turn on Windows Error Reporting from the Resources and Support section in Server Manager. After selecting this option, choose whether you want to participate by sharing descriptions of problems with Microsoft. In addition, choose the level of involvement by selecting Yes, Automatically Send Detailed Reports; Yes, Automatically Send Summary Reports; or Ask Me About Sending Reports Every Time an Error Occurs.
Finally, the combination of the three resources and support tools help administrators better log, troubleshoot, and solve issues with a Windows 2008 system. At the same time, Microsoft collects this information to improve the product.
Common Problems Found in Hyper-V
Although every administrator will find something new or different that doesn’t work right in an application, a handful of “issues” have arisen in various implementations of Windows 2008 Hyper-V. This section covers those problems and how to resolve them.
Hyper-V Installation-Related Problems
Hyper-V server installation has, for the most part, been one of those things that either works without a problem or doesn’t work because of a specific (typically hardware-related) issue. The most common installation problems relate to the version of Windows 2008 that Hyper-V is being installed on and the hardware compatibility of the host server system itself.
Support for 64-Bit Windows 2008 Only
Hyper-V is supported only on the x64-bit version of Windows Server 2008 (Standard, Enterprise, and Datacenter editions). If you load up a 32-bit version of Windows Server 2008, the Hyper-V role isn’t even an option to install on the server. On the topic of licensing version (Standard, Enterprise, and Datacenter), while this was covered in Chapter 1, “Windows 2008 Hyper-V Technology Primer,” to repeat it here in the debugging section, a 64-bit host server regardless of the version of software installed (Standard, Enterprise, or Datacenter) will run as many guest sessions as the system has resources. From a legal licensing perspective, however, the Standard Edition of Windows 2008 x64 will allow one free guest session. The Enterprise Edition will allow four free guest sessions. The Datacenter Edition will allow an unlimited number of free guest sessions with the purchase of the host license. There’s nothing wrong with an organization running the Enterprise Edition of Windows 2008 x64 with eight sessions on the server as long as the hardware has enough RAM and CPU to support the sessions. The organization just needs to buy four additional Windows server licenses beyond the four free Windows server guest session licenses received when running Hyper-V on an Enterprise Edition of the server software.
Hardware-Assisted Virtualization
The other common problem with installation of Hyper-V is that the Hyper-V server role installs properly, but when the host server is booted and a guest session is attempted to be launched, an error occurs: “The virtual machine could not be started because the hypervisor is not running.” You will not find a hypervisor service to start, nor is there a hypervisor task in Task Manager to go look at. The hypervisor is loaded on system boot (hvboot.sys). If on boot Windows doesn’t find hardware-assisted virtualization, the normal Windows driver is installed, and then guest sessions won’t start.
This error indicates that the Windows 2008 operating system is not recognizing hardware-assisted virtualization on the system, which is required for Hyper-V to work. This typically means that the system does not have hardware-assisted virtualization or that it has hardware-assisted virtualization and it is just not enabled or working.
If you are unaware whether your system has hardware-assisted virtualization, check the process on the system. It should be an Intel EM64T chipset or an AMD64 chipset. Some of the earlier 64-bit processors (before 2005) were 64 bit, but not hardware assisted. AMD released a tool called the AMD Virtualization Technology and Microsoft Hyper-V System Compatibility Check Utility that you can download from www.amd.com/us-en/Processors/TechnicalResources/0,,30_182_871_9033,00.html.
If you know your system has a hardware-assisted virtualization processor, it is likely that hardware virtualization is not enabled. By default, most servers and definitely desktops and laptops ship with hardware virtualization disabled. The usual way to enable the hardware virtualization is to press F2 or F10 or Esc on power up of the system to run the BIOS “setup” program. In the BIOS setup program, you’re typically looking for something with the word virtualization. Choosing to enable virtualization in the BIOS, then saving the settings and rebooting will usually solve the problem.
Hyper-V Networking-Related Problems
In virtualized environments, network communication problems between guest sessions, the host server, and servers on a backbone are common. Many times, a problem occurs because of how the network adapter is configured. Other times, guest sessions aren’t connected to the physical network adapter to communicate out of the environment. To isolate network-related problems, you must confirm virtual network configuration settings on the host server.
Guest Sessions Cannot Talk Outside of the Host Server
If a guest session boots but the server cannot communicate outside the host server, or users cannot access the guest session, the isolation comes down to testing general connectivity:
1. Make sure the host server can communicate through the network adapter to other servers on the network, and vice versa (that other computers can communicate to the Hyper-V host server). You do this to confirm that the host network adapter is properly confirmed for inbound and outbound communications. If the host cannot communicate out to the network through the network adapter, check to make sure the network adapter is enabled, the network cable is plugged in, and the IP address has been properly assigned.
2. Assuming the host server can communicate externally but the guest session cannot, check the Virtual Network Manager on the Hyper-V Administrative console to make sure the guest session is connected to an external virtual network that is associated with a physical network adapter. Interestingly, even if you set the virtual network setting right, many times when you change the IP address of the physical adapter (either changing from static to DHCP or vice versa) the virtual network configuration changes, too. So even if you thought you set it right, go back and confirm you have the network setup to work properly.
Guest Sessions Cannot Talk Through Host Wireless Adapter
By design, Hyper-V does not allow binding of the virtual network to a wireless network adapter in the host server. In a real-world environment, the Hyper-V host is typically connected to a wired network or even a very fast gigabit backbone as the performance between the host and the network throttles through the network adapter. Wireless is not fast enough to handle hundreds if not thousands of connections to a handful of virtual guest sessions. There are workarounds, such as bridging a wireless and wired network adapter on the host server together to get the guest sessions to bind to a wired adapter that is bridges to a wireless adapter. Alternatively, you can install a Routing and Remote Access Server (RRAS) service to route communications between multiple adapters in the host server to link the wireless to a physical wired adapter.
Hyper-V Configuration-Related Problems
For an administrator who has Hyper-V working on a server but has the problem where the guest sessions do not automatically start up when the host server is rebooted, a configuration change needs to be made. The configuration change specifies that the guest session should be started every time the host server is started. This is the common configuration for a host server, because the presumption is that if a host server has production guests on the system, the guests should boot automatically if the host is rebooted.
To configure the guest sessions, complete the following steps:
1. Right-click the guest session in the Hyper-V Administrative console and choose Settings.
2. In the Automatic Start Actions pane within the Setting pages, shown in Figure 13.14, choose Always Start This Virtual Machine Automatically.
FIGURE 13.14 Automatic start action settings.
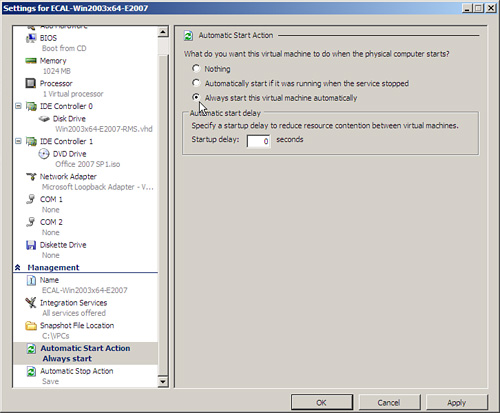
3. Click OK to save the setting.
You need to make this setting for each guest session that you want to automatically start when the host server is rebooted.
Hyper-V Miscellaneous Problems
For errors and problems that didn’t fit in any of the other categories, this miscellaneous problems section covers various problems and their answers.
Cannot Cut/Paste Between Guest Sessions
By design, you generally cannot cut information from one guest session and paste that information into another guest session. In addition, you cannot drag and drop documents from one guest session into another. Although being able to do so is common on desktop virtual server applications such as Microsoft Virtual PC 2007 or Parallels for the Macintosh, these are not supported features in Hyper-V. Microsoft’s explanation is that host servers are full running production systems intended to host business applications. Users are not sitting at the Hyper-V host level needing to cut and paste information between sessions; and from a security standpoint, it is better to not allow guest sessions to interact with one another at all. Therefore, if you want to get information from one guest session to another, you must log on from one guest to the other and transfer the files or information between the servers just like shuttling information from one physical server to another physical server.
Error Moving Hyper-V Guest Images to a New Folder
A task that comes up occasionally is to rename the folder on the Hyper-V host server that holds guest images and replace the folder with another folder that holds other guest images. In doing so, although the folder names are the same, the guest sessions will not start. Administrators have tried to swap folders by copying guest images into a folder and then renaming the folder to a different folder name, typically for failover reasons (for instance, images were in a folder c:vpc, but the images got corrupt, so the administrator renames the c:vpc to c:vpc.old, then renames c:vpcbackup to c:vpc).
The images should start if the images in the c:vpcbackup directory have the same name and configuration of the old images; however, the images do not start. The most common reason is that Hyper-V secures the folder where images are stored so that only the Hyper-V service can access the images. If the folder is replaced with a different folder, the permissions on the folder have been removed even though the folder may have the same name.
To fix the problem, complete the following steps:
1. Run Windows Explorer (Start, Run, Explorer.exe, OK).
2. Navigate to the folder where the guest images are being stored and right-click the folder and choose Properties.
3. Click the Security tab.
4. Click Edit, and then click Add.
5. In the Enter the Object Names to Select field, type Virtual Machines, and then click OK.
6. In the Permissions for Virtual Machines section, choose Allow for all permissions, as shown in Figure 13.15.
7. Click OK and then click OK again to save the setting.
Start the guest images. This time, they should begin.
Cannot Copy Guest Images
Another common challenge for administrators is to copy guest images on a Hyper-V host server. When trying to copy a guest image, the error “File is in use” appears. An administrator may attempt to copy guest images for the purpose of backing up the images or copying the images to another server for test purposes or the like. Even when the guest images are shutdown and off, the Hyper-V server still holds the files in use so that the images are ready to be booted at any time.
FIGURE 13.15 Giving virtual machines full control over the guest images container.
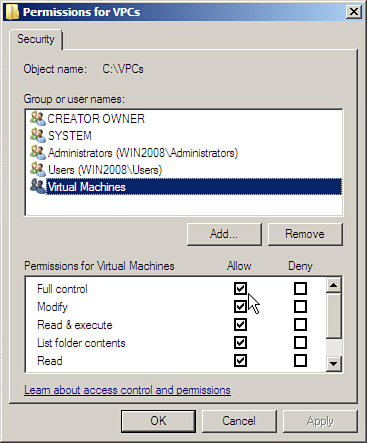
The only way to release the images from the Hyper-V server is to stop the Hyper-V service. To do so, following these steps:
1. From the Hyper-V Administrative console, click Stop Service in the Actions pane on the right side of the console. You will be prompted to confirm you want to stop the Hyper-V service. Click Yes.
2. Now that the Hyper-V service has been stopped, you can copy the Hyper-V guest images using Xcopy or Explorer or whatever you normally use to copy files.
3. After you have successfully copied the guest images you want off the server, click Start Service to restart the Hyper-V service (so that you can now restart guest images).
Summary
Logging and debugging tools help administrators monitor, manage, and problem solve errors on a Windows 2008 Hyper-V host and guest image systems and infrastructure. Many of the tools used to identify system problems in a Windows 2008 environment have been improved from previous versions of the applications in earlier releases of the Windows operating system. In addition, new tools have been introduced to enhance the administration logging and debugging experience. Key to problem solving is enabling logging and monitoring the logs to identify errors, research the errors, and perform system recovery based on problem resolution.
In addition to the tools and utilities that come with the Windows 2008 environment are resources such as the Microsoft TechNet database (www.microsoft.com/technet/). Between utility and tool improvements and online technical research databases, problem solving can be simplified in a Windows 2008 infrastructure.
Best Practices
The following are best practices from this chapter:
![]() Use the Task Manager to provide an instant view of system resources, such as processor activity, process activity, memory usage, and resource consumption.
Use the Task Manager to provide an instant view of system resources, such as processor activity, process activity, memory usage, and resource consumption.
![]() Use Event Viewer to check whether Windows 2008 is experiencing problems.
Use Event Viewer to check whether Windows 2008 is experiencing problems.
![]() Use filters, grouping, and sorting to help isolate and identify key events.
Use filters, grouping, and sorting to help isolate and identify key events.
![]() Create custom filters to expedite problem identification and improve monitoring processes.
Create custom filters to expedite problem identification and improve monitoring processes.
![]() Create alerts using triggers and actions to identify issues quickly.
Create alerts using triggers and actions to identify issues quickly.
![]() Archive security logs to a central location on your network, and then review them periodically against local security logs.
Archive security logs to a central location on your network, and then review them periodically against local security logs.
![]() Use subscriptions to consolidate logs from multiple systems to ensure problems are identified quickly.
Use subscriptions to consolidate logs from multiple systems to ensure problems are identified quickly.
![]() Set an auditing policy to shut down the server immediately when the security log is full. Doing so prevents generated logs from being overwritten or old logs from being erased.
Set an auditing policy to shut down the server immediately when the security log is full. Doing so prevents generated logs from being overwritten or old logs from being erased.
![]() Establish a process for monitoring and analyzing system performance to promote maximum uptime and to meet service-level agreements.
Establish a process for monitoring and analyzing system performance to promote maximum uptime and to meet service-level agreements.
![]() Run System Monitor from a remote computer to monitor servers.
Run System Monitor from a remote computer to monitor servers.
![]() Use logging when monitoring a larger number of servers.
Use logging when monitoring a larger number of servers.
![]() Establish performance baselines.
Establish performance baselines.
![]() Create logging jobs based on established baselines to ensure performance data is captured during times when the system is having resource issues and to facilitate altering for proactive system management.
Create logging jobs based on established baselines to ensure performance data is captured during times when the system is having resource issues and to facilitate altering for proactive system management.
![]() Create new baselines as applications or new services are added to a server.
Create new baselines as applications or new services are added to a server.
![]() Consider reducing the frequency of data collection to reduce the amount of data that must be collected and analyzed.
Consider reducing the frequency of data collection to reduce the amount of data that must be collected and analyzed.
![]() Use logs to capture performance data.
Use logs to capture performance data.
![]() Use the Reliability Monitor to identify a timeline of system degradation to facilitate expeditious investigation of root issue causes.
Use the Reliability Monitor to identify a timeline of system degradation to facilitate expeditious investigation of root issue causes.
![]() Use the Memory Diagnostics tool to facilitate hardware troubleshooting.
Use the Memory Diagnostics tool to facilitate hardware troubleshooting.