
In this chapter, you will learn how to | |
|---|---|
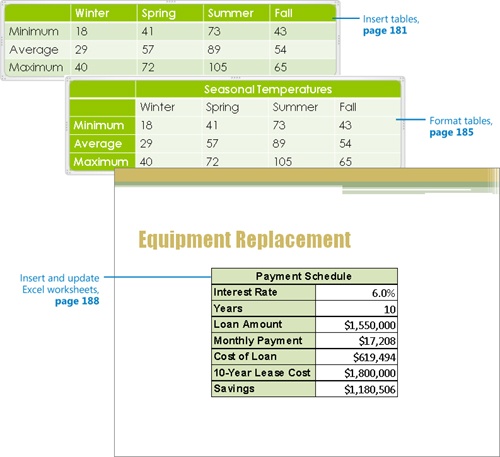
✓ | Insert tables. |
✓ | Format tables. |
✓ | Insert and update Excel worksheets. |
Often you will want to bolster the argument you are making in a Microsoft PowerPoint 2010 presentation with facts and figures that are best presented in a table. Tables condense information into highly structured row and column grid formats so that identifying categories or individual items and making comparisons is easier. You can place a table on any PowerPoint slide, whether or not it includes a content placeholder.
If the tabular information already exists—for example, as a Microsoft Excel worksheet—you can copy and paste it into a PowerPoint table. If you want to preserve formulas, it’s best to embed the worksheet as an object in the PowerPoint slide.
In this chapter, you’ll insert and format a table on one PowerPoint slide and then insert and manipulate an Excel worksheet.
Practice Files
Before you can complete the exercises in this chapter, you need to copy the book’s practice files to your computer. The practice files you’ll use to complete the exercises in this chapter are in the Chapter07 practice file folder. A complete list of practice files is provided in Using the Practice Files at the beginning of this book.
When you want to present a lot of data in an organized and easy-to-read format, a table is often your best choice. On a slide that includes a content placeholder, you can click the placeholder’s Insert Table button to start the process of creating a table. On any slide, you can click the Table button in the Tables group on the Insert tab to add a table outside a placeholder.
After you specify the number of columns and rows you want in the table, PowerPoint creates the table structure, which consists of a two-dimensional organization of rows and columns. The box at the intersection of each row and column is called a cell. Often the first row is used for column headings, and the leftmost column is used for row headings.
You work with PowerPoint tables in much the same way as you work with tables in Microsoft Word. (If the table you want to use already exists in a Word document, you can copy and paste that table into a PowerPoint slide, rather than re-creating it.)
To enter information in the table, you click a cell and then type the data. You move the cursor from cell to cell by pressing the Tab key. Pressing Tab in the last cell of the last row inserts a new row at the bottom of the table. If you need a new row elsewhere, you can insert a row above or below the row containing the cursor or insert a column to the left or right by clicking the corresponding buttons in the Rows & Columns group of the Layout contextual tab. If you no longer need a column or row, you can remove it by clicking the Delete button in the Rows & Columns group and then clicking Delete Columns or Delete Rows.
You can click the Merge Cells button in the Merge group of the Layout tab to combine (merge) selected cells into one cell that spans two or more columns or rows. Another way to merge cells is by clicking the Eraser button in the Draw Borders group on the Design contextual tab, and then dragging the eraser that appears across the border between two cells.
If you want to split a single cell into two or more cells, you can either select the cell and then click the Split Cells button in the Merge group on the Layout tab, or you can click the Draw Table button in the Draw Borders group on the Design tab, and then draw a cell border with the pencil that appears.
Tip
If you don’t already have a table on a slide, you can click the Table arrow and then click Draw Table to activate the pencil. You can then drag cells the size and shape you need to create the table.
In this exercise, you’ll create a table, enter text in its cells, insert a row, and merge cells.
Set Up
You need the Temperature_start document located in your Chapter07 practice file folder to complete this exercise. Open the Temperature_start document, and save it as Temperature. Then follow the steps.
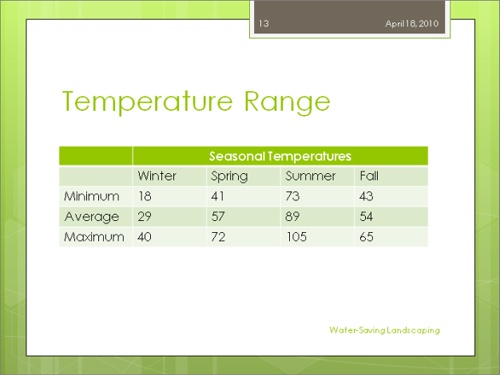
Display slide 13, which has the Title And Content layout.
In the content placeholder, click the Insert Table button.
The Insert Table dialog box opens.
Leave the Number of columns box set at 5, but change the setting in the Number of rows box to 3.
Click OK.
A blank table with five columns and three rows is inserted into the slide.
In the first cell of the second column, type Winter, press Tab, type Spring, press Tab, type Summer, press Tab, type Fall, and then press Tab again.
The cursor moves to the first cell of the second row.
Type the following, pressing Tab after each entry:
Minimum
18
41
73
43
Average
29
57
89
54
When you press Tab after the last entry, PowerPoint adds a new row to the table.
Type the following, pressing Tab after each entry except the last:
Maximum
40
72
105
65
Here are the results.
Click anywhere in the heading row, and then on the Layout tab, in the Rows & Columns group, click the Insert Above button.
PowerPoint adds a new row above the headings.
Click the second cell in the new row, hold down the Shift key, and then press the Right Arrow key three times.
With four cells selected, in the Merge group, click the Merge Cells button.
In the merged cell, type Seasonal temperatures.
Without moving the cursor, in the Alignment group, click the Center button.
See Also
For more information about keyboard shortcuts, see Appendix A at the end of this book.
Point to the frame of the table (don’t point to the sets of dots, which are sizing handles). Then drag the table downward so that it sits in about the center of the slide.
Click a blank area of the slide.
The table is no longer active.


You can format an entire table as well as individual cells by using the commands on the Design and Format contextual tabs, which appear only when a table is active. For example, you can use buttons on the Design contextual tab to switch to a different table style, instantly changing the look of the text and cells to make key information stand out. If you want, you can also format individual words and individual cells.
In this exercise, you’ll apply a different table style, and then format a row and individual cells.
Set Up
You need the TemperatureFormatted_start document located in your Chapter07 practice file folder to complete this exercise. Open the TemperatureFormatted_start document, and save it as TemperatureFormatted. Then follow the steps.
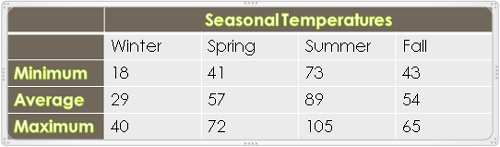
Display slide 13, and click anywhere in the table to activate it.
On the Design contextual tab, in the Table Style Options group, clear the Banded Rows check box.
The banding disappears. All rows except the header row are now the same color.
In the Table Style Options group, select the First Column check box.
The first column is now the same color as the heading, and its text is white.
In the Table Styles group, click the More button.
The Table Styles gallery appears.
Drag the bottom border of the gallery upward until you can see the table.
Point to various styles to preview their effects on the table, and then under Medium, click the fifth thumbnail in the second row (Medium Style 2 - Accent 4).
Drag across the cells containing Winter, Spring, Summer, and Fall to select them.
On the Design contextual tab, in the Table Styles group, click the Shading arrow, and then under Theme Colors in the palette, click the green box at the top of the third column (Light Green, Background 2).
Click the cell containing 105, click the Shading arrow, and then under Theme Colors in the palette, click the orange box at the top of the seventh column (Orange, Accent 3).
Click the cell containing 18, click the Shading arrow, and below the palette, click More Fill Colors. Then on the Standard page of the Colors dialog box, click a pale blue color near the center of the color wheel, and then click OK.
Select Seasonal Temperatures, and then in the WordArt Styles group, display the Quick Styles gallery. Then click the fourth thumbnail in the second row (Fill – Green, Accent 1, Inner Shadow – Accent 1).
Repeat step 10 to format Minimum, Average, and Maximum.
On the Layout tab, in the Table group, click the Select button, and then click Select Table.
In the Table Styles group, click the Borders arrow, and click Outside Borders.
After experimenting, let’s try a simpler look.
Click anywhere in the table, and display the Table Styles gallery. Then, under Medium, click the third thumbnail in the second row (Medium Style 2 – Accent 2).
The new table style clears the cell formatting but leaves the text effects.


The table capabilities of PowerPoint are perfectly adequate for the display of simple information that is unlikely to change during the useful life of the presentation. However, if your data involves calculations or is likely to require updating, you’ll probably want to maintain the information in an Excel worksheet. You can then embed the worksheet in a slide as an object, or you can link the slide to the worksheet so that you won’t have to worry about keeping the data current in more than one place.
Embedded objects and linked objects differ in the following ways:
An embedded object is an object that maintains a direct connection to its original program, known as the source program. After you insert an embedded object, you can easily edit it by double-clicking it, which opens the program in which it was originally created. Be aware that embedding an object in a presentation increases the presentation’s file size, because PowerPoint has to store not only the data itself but also information about how to display the data.
A linked object is a representation on a slide of information that is still stored in the original document, known as the source document. If you edit the source document in the source program after adding a linked object to a slide, PowerPoint updates the representation of the object. Because PowerPoint stores only the data needed to display the information, linking results in a smaller file size than embedding.
For example, suppose a sales manager stores past sales information and future sales projections in Excel worksheets. On one slide in a presentation, she might embed the past sales information, which won’t change, as an object. On another slide, she might link the future sales projections, which she is still in the process of fine-tuning. Then as she updates the projections worksheet, the linked table in the PowerPoint presentation automatically updates as well.
In this exercise, you’ll insert an Excel worksheet and then update and format the content of the embedded object.
Set Up
You need the FinancialMeeting_start presentation and the NewEquipment workbook located in your Chapter07 practice file folder to complete this exercise. Open the FinancialMeeting_start presentation, and save it as FinancialMeeting. Then follow the steps.
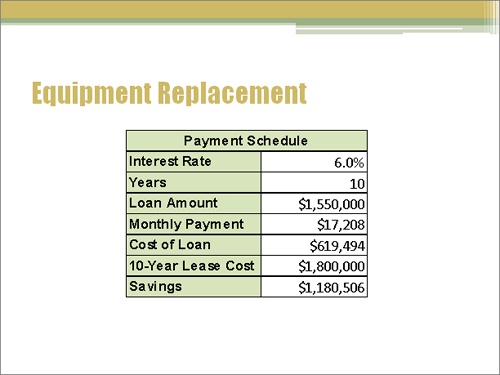
Display slide 9, and then on the Insert tab, in the Text group, click the Object button.
The Insert Object dialog box opens.
Click Create from file, and then click Browse.
The Browse dialog box opens. (It is similar to the Open dialog box.)
Navigate to your Chapter07 practice file folder, click the NewEquipment workbook, and then click OK.
The location of the workbook appears in the File box.
Click OK.
PowerPoint embeds the data from the specified workbook in the slide.
Double-click the worksheet object.
The worksheet opens in an Excel window within PowerPoint.

When you double-click an embedded worksheet, the Excel ribbon replaces that of PowerPoint across the top of the program window.
Troubleshooting
The appearance of buttons and groups on the ribbon changes depending on the width of the program window. For information about changing the appearance of the ribbon to match our screen images, see Modifying the Display of the Ribbon at the beginning of this book.
Point to the black handle in the middle of the bottom frame of the Excel window, and when the pointer becomes a double-headed arrow, drag up until the window is just big enough to contain the active part of the worksheet.
Be careful not to obscure any data.
Click outside the window to return to PowerPoint. Then point to the lower-right corner of the object, and drag down and to the right to enlarge it.
Troubleshooting
Be sure to point to the corner. Although you can’t see it, you want to drag the sizing handle. If you drag the frame instead, you’ll move the object instead of sizing it. If you drag down too much or to the right too much, you will expose empty cells. If that happens, click the Undo button, and try again.
Point to the frame (not to a handle), and drag the worksheet object to the center of the slide. Then double-click the worksheet object again.
Once again, the object is displayed in an Excel window.
You can reference each cell by its column letter followed by its row number (for example, A1). You can reference a block of cells by the cell in its upper-left corner and the cell in its lower-right corner, separated by a colon (for example, A1:C3).
Click cell B2, and notice in the Number group that the cell’s contents are formatted as a percentage.
Click each of the other cells in column B in turn, and notice the contents of the formula bar (the box to the right of fx above the slide) and the format in the Number group.
Click cell B2, type 6, and then press Enter.
Excel uses formulas in cells B5, B6, and B8 to calculate the new cost of the equipment loan. The amount in cell B5 changed to $17,208, the amount in B6 changed to $619.494, and the amount in cell B8 changed to $1,180,506. These changes affect only the object on the slide; the data in the original Excel worksheet has not changed.
Select cell A1, which is merged with cell B1, and then on the Excel Home tab, in the Font group, click the Fill Color arrow. Under Theme Colors in the palette, click the second box in the green column (Olive Green, Accent 3, Lighter 60%).
Point to cell A2, and drag down to cell A8. Then click the Fill Color button to shade the selected cells with the default color.
Click a blank area of the slide.
Excel closes, and the PowerPoint ribbon reappears.
Click the blank area again to deactivate the object.
You can now see the results of your formatting.


Use a table to organize information neatly in rows and columns.
You can customize and format individual cells as well as the entire table.
If the information you need already exists in an Excel worksheet, you can embed the worksheet in a slide. Double-clicking the worksheet object opens it in Excel so that you can edit it.
If the information in the Excel worksheet is likely to change, you can link the slide to the source worksheet so that the slide is updated if the worksheet changes.