

In this chapter, you will learn how to | |
|---|---|
✓ | Insert pictures and clip art images. |
✓ | Insert diagrams. |
✓ | Insert charts. |
✓ | Draw shapes. |
✓ | Add transitions. |
With the ready availability of professionally designed templates, presentations have become more visually sophisticated and appealing. The words you use on your slides are no longer enough to guarantee the success of a presentation. These days, presentations are likely to have fewer words and more graphic elements. In fact, many successful presenters dispense with words altogether and use their slides only to graphically reinforce what they say when they deliver their presentations.
The general term graphics applies to several kinds of visual enhancements, including pictures, clip art images, diagrams, charts, and shapes. All of these types of graphics are inserted as objects on a slide and can then be sized, moved, and copied. For purposes of this chapter, we also consider transitions from one slide to another as a type of visual enhancement.
See Also
For information about formatting and otherwise modifying graphics, see Chapter 8.
In this chapter, you’ll insert pictures and clip art images. You’ll create a diagram and a chart, and you’ll draw a simple illustration by using built-in shapes. Finally, you’ll change the way slides move on and off the screen during a slide show.
Practice Files
Before you can complete the exercises in this chapter, you need to copy the book’s practice files to your computer. The practice files you’ll use to complete the exercises in this chapter are in the Chapter05 practice file folder. A complete list of practice files is provided in Using the Practice Files at the beginning of this book.
You can add images created and saved in other programs as well as digital photographs to your Microsoft PowerPoint 2010 presentations. Collectively, these types of graphics are known as pictures. You might want to use pictures to make your slides more attractive and visually interesting, but you are more likely to use pictures to convey information in a way that words cannot. For example, you might display photographs of your company’s new products in a presentation to salespeople.
If a slide has a content placeholder, you can insert a picture by clicking the Insert Picture From File button in the content placeholder. If the slide has no content placeholder, you can click the Picture button in the Images group on the Insert tab. Either way, the Insert Picture dialog box opens so that you can locate and insert the picture you want.
Tip
Pictures you acquire from locations such as Web sites are often copyrighted, meaning that you cannot use them without the permission of the person who created them. Sometimes owners will grant permission if you give them credit. Professional photographers usually charge a fee to use their work. Always assume that pictures are copyrighted unless the source clearly indicates that they are license-free.
In addition to pictures you have acquired from various sources, you can insert clip art images into your slides. PowerPoint provides access to hundreds of license-free clip art items that often take the form of professionally designed cartoons, sketches, or symbolic images, but can also include photographs, animated drawings, and movies. In a PowerPoint presentation, you can use clip art to illustrate a point you are making, as interesting bullet characters, or to mark pauses in a presentation. For example, you might display a question mark image on a slide to signal a time in which you answer questions from the audience.
To add clip art to a slide, you can click the Clip Art button in a content placeholder, or you can click the Clip Art button in the Images group on the Insert tab. Either way, the Clip Art task pane opens. From this task pane, you can locate and insert the clip art image you want. You can search for clip art by keyword, search a specific Microsoft Clip Organizer collection, or search for specific files or media types, such as movies.
If your computer has an Internet connection, by default your search is expanded to include the thousands of free clip art images available on the Office.com Web site.
After you have inserted a picture, you can make it larger or smaller and position it anywhere you want on the slide.
Tip
You can save PowerPoint slides as pictures that you can insert in other types of documents. Display the Save & Send page of the Backstage view, and click Change File Type in the center pane. Then click one of the formats listed under Image File Types in the right pane, and click Save As. In the Save As dialog box, specify a name and location, and then click Save. In the message box that appears, click Every Slide to save all the slides as images, or click Current Slide Only to save an image of the current slide.
In this exercise, you’ll add pictures and clip art images to slides. After inserting them, you’ll move and size them to fit their slides.
Set Up
You need the WaterSavingA_start presentation and the Penstemon and Agastache pictures located in your Chapter05 practice file folder to complete this exercise. Open the WaterSavingA_start presentation, and save it as WaterSavingA. Be sure you have an Internet connection so that you can connect to Office.com. Then follow the steps.
Press Ctrl+End to move to slide 11, and delete <show pictures>.
Because you have deleted the text from the content placeholder, PowerPoint redisplays the content buttons.
In the content placeholder, click the Insert Picture from File button.
The Insert Picture dialog box opens.
Navigate to your Chapter05 practice file folder, click the Penstemon file, and then click Insert.
Tip
If a picture might change, you can ensure that the slide is always up to date by clicking the Insert arrow and then clicking Link To File to insert a link to the picture, or by clicking Insert And Link to both insert the picture and link it to its graphic file.
PowerPoint inserts the picture in the middle of the content pane.
On the View tab, in the Show group, select the Ruler check box.
Horizontal and vertical rulers are displayed across the top and down the left side of the Slide pane. The 0 mark on each ruler indicates the center of the slide. For clarity, we will refer to marks to the left of or above 0 as negative marks.
Point to the picture, and when you see a four-headed arrow attached to the pointer, drag to the left and down until its upper-left corner is almost level with the –4 inch mark on the horizontal ruler and the 0.5 inch mark on the vertical ruler.
Point to the handle in the upper-right corner of the photo, and drag up and to the right until that corner sits about level with the –1.5 inch mark on the horizontal ruler and the 1 inch mark on the vertical ruler.
The photo increases in size. To make the picture smaller, you would drag in the opposite direction.
On the Insert tab, in the Images group, click the Picture button, and then in the Insert Picture dialog box, double-click the Agastache file.
You can add pictures or other images to a slide without an available content placeholder, and regardless of the slide layout.
Point to the handle in the lower-right corner of the photo, and drag down and to the right until the Agastache photo is about the same size as the Penstemon photo. Then click away from the photo to release the selection.
On the Insert tab, in the Text group, click the Text Box button, and then click below the lower-left corner of the Penstemon photo.
In the text box, type Photos courtesy of Rugged Country Plants. Then select the text, make it 14 points and purple, and click a blank area of the slide.
These photographs came from ruggedcountryplants.com and are used with permission of the owners.
Move to slide 4, and on the Insert tab, in the Images group, click the Clip Art button.
The Clip Art task pane opens.
In the Search for box at the top of the task pane, type protect. Then with the Include Office.com content check box selected, click Go.
Thumbnails of any clip art, movies, and sounds stored on your computer or on the Office.com Web site that have the associated keyword protect or protection appear in the task pane.
Scroll down to see all the images that are available, and when you are ready, point to the green and blue drawing of hands protecting a plant.
A ScreenTip describes the image and gives its dimensions, file size, and format.
Click the thumbnail once.
PowerPoint inserts the image in the center of the slide.
At the right end of the title bar of the Clip Art task pane, click the Close button.
Drag the image to the lower-right corner of the slide, and then drag the upper-left corner handle until the image occupies about half of the slide. Click a blank area to release the selection.
The image balances the text on the slide.


Sometimes the concepts you want to convey to an audience are best presented in diagrams, which depict processes, hierarchies, cycles, or relationships. You can easily create a dynamic, visually appealing diagram for a slide by using SmartArt Graphics, a powerful tool that comes with the Microsoft Office 2010 programs. SmartArt provides predefined sets of formatting for effortlessly putting together any of the following types of diagrams:
Process. These visually describe the ordered set of steps required to complete a task—for example, the approval process for the launch of a new book series.
Hierarchy. These illustrate the structure of an organization or entity—for example, a company’s top-level management structure.
Cycle. These represent a circular sequence of steps, tasks, or events; or the relationship of a set of steps, tasks, or events to a central, core element—for example, the looping process for continually improving a product based on customer feedback.
Relationship. These show convergent, divergent, overlapping, merging, or containing elements—for example, how organizing your e-mail, calendar, and contacts can converge to improve your productivity.
On a slide that includes a content placeholder, you can click the placeholder’s Insert SmartArt Graphic button to start the process of creating a diagram. You can also click the SmartArt button in the Illustrations Group on the Insert tab to add a diagram to any slide. In either case, you then select the type of diagram you want to create and click a specific layout to see a picture and description. When you find the diagram that best conveys your information, you click OK to insert the diagram with placeholder text that you can replace in an adjacent Text pane.
After you create a diagram, you can move and size it to fit the slide, and with a few clicks, you can change the colors and look of its shapes to achieve professional looking results.
In this exercise, you’ll add a cycle diagram, enter text, and then move and size it. You’ll also format its shapes in simple ways.
Set Up
You need the WaterSavingB_start presentation located in your Chapter05 practice file folder to complete this exercise. Open the WaterSavingB_start presentation, and save it as WaterSavingB. Display the rulers, and then follow the steps.
Display slide 6, and then click the Insert SmartArt Graphic button in the content placeholder.
The Choose A SmartArt Graphic dialog box opens.
In the left pane, click each layout type in turn to see all the available layouts of that type in the center pane, and then click Cycle.
In the center pane, click each layout in turn to view a picture and description in the right pane.
When you finish exploring, click the second layout (Text Cycle), and then click OK.
PowerPoint inserts a blank cycle diagram into the slide. The Design and Format contextual tabs appear on the ribbon.
On the Design tab, in the Create Graphic group, click the Text Pane button.
The Text pane opens.

You can use the same techniques to create bullet points and subpoints in the Text pane as you would on the Outline tab of the Overview pane.
Troubleshooting
The appearance of buttons and groups on the ribbon changes depending on the width of the program window. For information about changing the appearance of the ribbon to match our screen images, see Modifying the Display of the Ribbon at the beginning of this book.
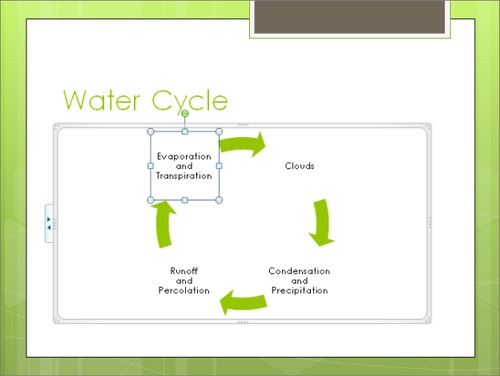
With the first bullet in the Text pane selected, type Clouds, and then press the Down Arrow key to move to the next bullet.
Pressing Shift+Enter after each word, type Condensation, and, and Precipitation. Then press the Down Arrow key.
Repeat step 7 to add Runoff, and, and Percolation. Then repeat it again to add Evaporation, and, and Transpiration.
You don’t need the last bullet point, so on the Design tab, in the Create Graphic group, click the Text Pane button to close the Text pane.
In the diagram, click the Text placeholder, and click the border of the empty shape to select it for manipulation. Then press the Delete key.
The diagram now has four sets of text and arrows.
In the Layouts group, click the More button to view the available Cycle diagram layouts, and then click the first thumbnail in the first row (Basic Cycle).
The diagram changes to the new layout.
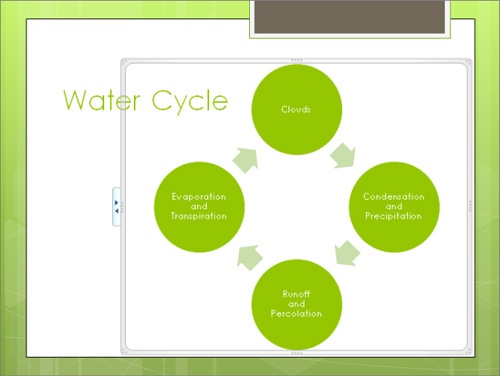
Point to the handle (the four dots) in the middle of the right side of the diagram’s frame, and when the pointer changes to a two-headed arrow, drag to the left until the frame is only as wide as the diagram. (Repeat the process as necessary.)
Point to a part of the frame where there is no handle, and when a four-headed arrow is attached to the pointer, drag the diagram until it sits in the lower-right corner of the white area of the slide.
Point to the handle in the upper-left corner of the frame and drag up and to the left until the frame sits at about the –2.5 inch mark on both the horizontal and vertical rulers.
Troubleshooting
Remember that the 0 mark on both rulers is centered on the slide. You want the 2.5-inch marks to the left of and above the 0 marks.
The diagram expands with its frame.
In the SmartArt Styles group, click the Change Colors button, and then in the gallery, under Colorful, click the second thumbnail (Colorful Range - Accent Colors 2 and 3).
The shapes in the diagram assume the colors of the selected scheme.
In the SmartArt Styles group, click the More button.
The SmartArt Styles gallery appears.
Under 3-D in the gallery, click the first thumbnail in the first row (Polished).
Click outside the frame.
You can now see the final result.


For those occasions when you want to display numeric data visually, you can add a chart to a slide. Charts make it easy to see trends that might not be obvious from looking at the numbers themselves.
On a slide that includes a content placeholder, you can click the placeholder’s Insert Chart button to start the process of creating a chart. You can also click the Chart button in the Illustrations Group on the Insert tab to add a chart to any slide. In either case, you then select the type of chart you want. If your PowerPoint window is maximized, when you click OK, a sample chart of the type you selected is inserted in the current slide, and the PowerPoint window shrinks so that it occupies half the screen. An associated Microsoft Excel worksheet containing the data plotted in the sample chart is displayed in the other half. You use this worksheet to enter the information you want to plot, following the pattern illustrated by the sample data.
The Excel worksheet is composed of rows and columns of cells that contain values, which in charting terminology are called data points. Collectively a set of data points is called a data series. Each worksheet cell is identified by an address consisting of its column letter and row number—for example, A2. A range of cells is identified by the address of the cell in the upper-left corner and the address of the cell in the lower-right corner, separated by a colon—for example, A2:D5.
When you replace the sample data in the worksheet, you immediately see the results in the chart in the adjacent PowerPoint window. Each data point in a data series is represented graphically in the chart by a data marker. The data is plotted against an x-axis—also called the category axis—and a y-axis—also called the value axis. (Three-dimensional charts also have a z-axis—also called the series axis.) Tick-mark labels along each axis identify the categories, values, or series in the chart. A legend provides a key for identifying the data series.
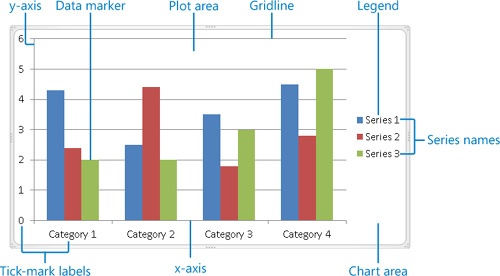
To enter data in a cell of the Excel worksheet, you first click the cell to select it. You can select an entire column by clicking the column header—the shaded box containing a letter at the top of each column—and an entire row by clicking the row header—the shaded box containing a number to the left of each row. You can select the entire worksheet by clicking the Select All button—the box at the junction of the column and row headers.
Having selected a cell, you can enter your data by typing it directly. However, if your data already exists in an Excel worksheet or a Microsoft Access or Microsoft Word table, you don’t have to retype it. You can copy the data from its source program and paste it into the Excel worksheet that is linked to the slide.
After you’ve plotted your data in the chart, you can move and size the chart to suit the space available on the slide. You can edit the data—both the values and the column and row headings—at any time, and PowerPoint will replot the chart to reflect your changes.
In this exercise, you’ll create a chart by pasting existing data into the associated Excel worksheet. You’ll then size the chart, and edit its data.
Set Up
You need the WaterConsumption workbook and the WaterSavingC_start presentation located in your Chapter05 practice file folder to complete this exercise. From Windows Explorer, open the WaterConsumption workbook in Excel by double-clicking the workbook’s file name. Then open the WaterSavingC_start presentation, and save it as WaterSavingC. Ensure that the PowerPoint program window is maximized, and then follow the steps.
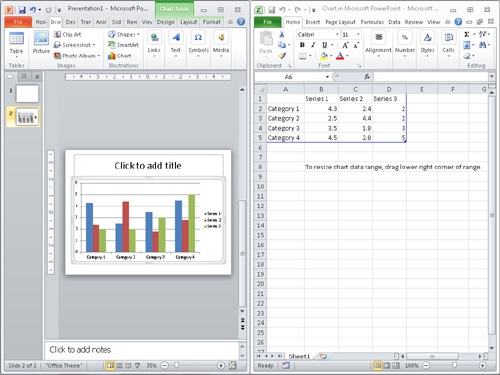
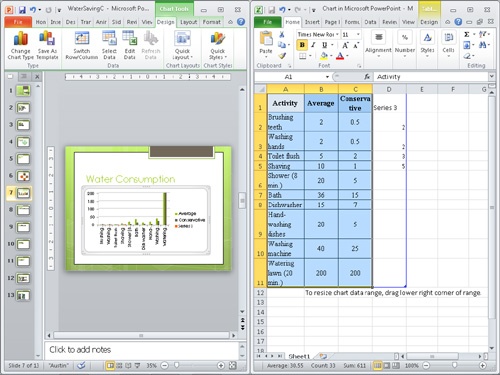
Display slide 7, and then in the content placeholder, click the Insert Chart button.
The Insert Chart dialog box opens.
With Column selected in the left pane, click the first thumbnail in the second row (Clustered Cylinder), and then click OK.
PowerPoint inserts the chart into the slide and resizes its program window to occupy the left half of your screen. Excel starts and displays the data used to plot the chart in the right half of the screen.
From the Windows Taskbar, display the WaterConsumption worksheet. Then in the worksheet, point to cell A3, and drag down and to the right to cell C13.
Excel selects all the cells in the range A3:C13.
On the Excel Home tab, in the Clipboard group, click the Copy button.
From the Windows Taskbar, display the Chart in Microsoft PowerPoint worksheet. Then in the worksheet, click cell A1.
On the Excel Home tab, in the Clipboard group, click the Paste button. Then click OK to acknowledge the message that Excel has inserted rows in the worksheet to accommodate the copied data.
Excel pastes in the data, and PowerPoint immediately replots the chart.
To exclude the data in column D from the chart, in the worksheet, drag the handle in the lower-right corner of the blue border to the left, releasing it when cells D1:D11 are shaded.
In the PowerPoint window, the chart now reflects the fact that only the Activity, Average, and Conservative columns are plotted.
In the upper-right corner of the Excel window, click the Close button to close the associated worksheet. Then close the WaterConsumption workbook.
The PowerPoint window expands, giving you a better view of the chart.
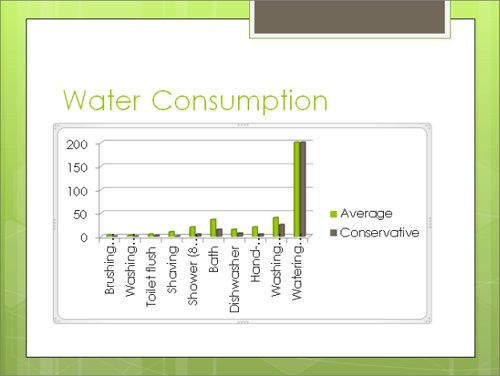
Point to the handle (the four dots) in the middle of the bottom of the frame, and drag downward until the frame sits at the bottom of the white area of the slide.
When you release the mouse button, the chart area expands, but not enough for the category labels to be displayed in their entirety.
On the Design contextual tab, in the Data group, click the Edit Data button.
The associated worksheet opens in Excel so that you can make changes to the plotted data.
Click cell A9, type Dishes by hand, and press Enter. Then in cell A10, type Clothes washer, and press Enter. Finally in cell A11, replace Watering lawn (20 min.) with Lawn (20 min.), and press Enter. Then close the Excel worksheet.
Tip
If the chart isn’t selected (surrounded by a frame) in the PowerPoint window when you make changes to the data in the Excel window, the chart won’t automatically update. If this happens, click the chart before proceeding.
PowerPoint replots the chart with the new category labels.
Point to the handle in the middle of the right side of the frame, and drag to the right until the frame sits at the edge of the white area on that slide. Then click outside the chart frame.
PowerPoint has rotated the labels so that the chart area can expand even more.
Tip
By default, the chart is plotted based on the series in the columns of the worksheet, which are identified in the legend. If you want to base the chart on the series in the rows instead, click the Switch Row/Column button in the Data group on the Design contextual tab. The worksheet must be open for the button to be active. (To open the worksheet, right-click the chart, and then click Edit Data.)


To emphasize the key points in your presentation, you might want to include shapes in addition to text. PowerPoint provides tools for creating several types of shapes, including stars, banners, boxes, lines, circles, and squares. With a little imagination, you’ll soon discover ways to create drawings by combining shapes.
To create a shape in PowerPoint, you click the Shapes button in the Illustrations group on the Insert tab, click the shape you want to insert, and then drag the crosshair pointer across the slide.
Tip
To draw a circle or a square, click the Oval or a Rectangle shape, and hold down the Shift key while you drag.
After you draw the shape, it is surrounded by a set of handles, indicating that it is selected. (You can select a shape at any time by simply clicking it.) The handles serve the following purposes:
You can drag the pale blue sizing handles to change the size of a shape.
If a shape has a yellow diamond-shaped adjustment handle next to one of the sizing handles or elsewhere on the shape, the shape is adjustable. You can use this handle to alter the appearance of the shape without changing its size.
You can drag the green rotating handle to adjust the angle of rotation of a shape.

You can copy or cut a selected shape or multiple shapes and then paste the shapes elsewhere in the same presentation, in another presentation, or in any Office program.
To move a shape from one location to another on the same slide, you simply drag it. You can create a copy of a selected shape by dragging it while holding down the Ctrl key or by clicking the Copy arrow in the Clipboard group on the Home tab and then clicking Duplicate.
After drawing a shape, you can modify it by using the buttons on the Format contextual tab that appears when a shape is selected. For example, you can:
Add text to a shape. PowerPoint centers the text as you type, and the text becomes part of the shape.
Change the size and color of the shape and its outline.
Apply special effects, such as making the shape look three-dimensional.
Having made changes to one shape, you can easily apply the same attributes to another shape by clicking the shape that has the desired attributes, clicking the Format Painter button in the Clipboard group on the Home tab, and then clicking the shape to which you want to copy the attributes. If you want to apply the attributes of a shape to all shapes in the active presentation, right-click the shape and then click Set As Default Shape. From then on, all the shapes you draw in the active presentation will have the new default attributes.
When you have multiple shapes on a slide, you can group them so that you can copy, move, and format them as a unit. You can change the attributes of an individual shape—for example, its color, size, or location—without ungrouping the shapes. If you do ungroup the graphics, you can regroup the same shapes by selecting one of them and then clicking Regroup in the Group list.
In this exercise, you’ll draw several shapes, add text to them, and change their colors. Then you’ll duplicate and copy a shape and switch one shape for another.
Set Up
You need the JournalingA_start presentation located in your Chapter05 practice file folder to complete this exercise. Open the JournalingA_start presentation, and save it as JournalingA. Display the rulers, and then follow the steps.
Display slide 5, and on the Insert tab, in the Illustrations group, click the Shapes button.
The Shapes gallery appears.
Under Stars and Banners in the gallery, click the 5-Point Star shape, and then drag the crosshair pointer in the middle of the slide to draw a star shape that spans the shadow of the hand in the background graphic.
Tip
If you click a shape button and then change your mind about drawing the shape, you can release the shape by pressing the Esc key.
Pale blue handles surround the shape to indicate that it is selected.
On the Format tab, in the Insert Shapes group, click the More button to display the Shapes gallery. Then under Block Arrows, click the Right Arrow shape, and draw a small arrow to the right of the star.
With the arrow still selected, hold down the Ctrl key, and drag a copy of the arrow to the left of the star.
With the shape still selected, in the Arrange group, click the Rotate button, and then click Flip Horizontal.
You could have drawn a Left Arrow shape, but this technique ensures that the two arrows have the same proportions.
Adjacent to the left arrow, add a scroll shape, and adjacent to the right arrow, add a heart shape.
All the shapes have the same outline and interior colors.
With the heart selected, on the Home tab, in the Clipboard group, click the Copy arrow, and then in the list, click Duplicate.
PowerPoint pastes a copy of the shape on top of the original.
Point to the handle in the upper-left corner of the new shape, and drag down and to the right to make the second heart smaller than the first.
On the Format tab, in the Insert Shapes group, click the Text Box button, click the center of the star, and then type ME.
See Also
For information about working with text boxes, see Adding Text Boxes in Chapter 3.
Don’t worry that you can barely see the text; you’ll fix that in a later step.
Repeat step 9 to add the word Education to the scroll shape and Family to the heart shape.
Click the scroll shape (don’t click the text), hold down the Shift key, click the star shape, and then click the two hearts.
With all four shapes selected, in the Shape Styles group, click the More button to display the Shape Styles gallery.
Point to several thumbnails to see live previews of their effects, and then click the last thumbnail in the fourth row (Subtle Effect – Light Blue, Accent 6).
The color of the interior and outline of the shapes changes, as does the color of the text.
Click a blank area of the slide to release the selection, and then click the scroll shape (don’t click its text).
In the Insert Shapes group, click the Edit Shape button, point to Change Shape, and under Block Arrows, click the third shape (Up Arrow).
The scroll changes to the selected shape, with all formatting and text intact.
Double-click the word Education, and type Job. Then click outside the shape to release the selection.
You can now see the results.
Select all the shapes on the slide. Then on the Format tab, in the Arrange group, click the Group button, and in the list, click Group.
The shapes are grouped together as one object.
In the Shape Styles group, click the Shape Outline arrow, and then under Standard Colors in the palette, click the last color (Purple).
The outlines around the shapes change to purple.
Point to any shape in the group, and when the pointer has a four-headed arrow attached to it, drag downward about a half inch.
The entire group moves.
Click the left arrow. In the Shape Styles group, click the Shape Fill arrow and change the shape’s color to purple.
Even though the shapes are grouped, you can still change the attributes of one of the shapes.
With the left arrow still selected, on the Home tab, in the Clipboard group, click the Format Painter button, and then click the right arrow.
Both arrows are now purple.
Click away from the selected shape, and then click any shape to select the group.
On the Format tab, in the Arrange group, click the Group button, and then click Ungroup.
The group is disbanded, and the individual shapes are now selected.


Connecting Shapes
If you want to show a relationship between two shapes, you can connect them with a line by joining special handles called connection points.
To connect shapes:
Click one of the shapes you want to connect. Then on the Format tab, in the Insert Shapes group, display the Shapes gallery, and under Lines, click one of the Connector shapes.
Point to the selected shape.
Red connection points appear, and the pointer changes to a crosshair.
Point to a connection point, and then drag over to the other shape (don’t release the mouse button).
When connection points appear on the other shape, point to a connection point, and release the mouse button.
Red handles appear at each end of the line, indicating that the shapes are connected.
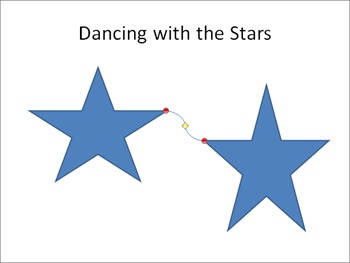
After you have drawn the connector, you can format it by changing its color and weight. You can then set the formatted line as the default for all future connectors in this drawing. If you move a connected shape, the line moves with it, maintaining the relationship between the shapes.
When you deliver a presentation, you can move from slide to slide by clicking the mouse button or you can have PowerPoint replace one slide with the next at predetermined intervals. You can avoid abrupt breaks between slides by employing transitions that control the way slides move on and off the screen.
PowerPoint comes with the following categories of built-in transition effects:
Subtle. This category includes fades, wipes, and a shutter-like effect.
Exciting. This category includes more dramatic effects such as checkerboards, ripples, turning, and zooming.
Dynamic Content. This category holds the background of the slides still and applies a dynamic effect to the title and other content, such as rotating or flying onto the slide.
Each slide can have only one transition. You set transitions from the Transitions tab in Normal view or Slide Sorter view, for one slide at a time, for a group of slides, or for an entire presentation. This tab is new in PowerPoint 2010, reflecting the importance of transitions in ensuring a smooth flow for your presentations. (Previously, transitions were included on the Animations tab because they were considered just another form of animation.)
In addition to selecting the type of transition, you can specify the following:
The sound
The speed
When the transition occurs
In this exercise, you’ll apply a transition to a single slide, and apply the same transition to all the slides in the presentation. You’ll also add sound to the transition and set the transition speed.
Set Up
You need the JournalingB_start presentation located in your Chapter05 practice file folder to complete this exercise. Open the JournalingB_start presentation, and save it as JournalingB. Then follow the steps.
Display slide 2 in Normal view. Then on the Transitions tab, in the Transition to This Slide group, click each thumbnail in the gallery to see its effects.
To the right of the gallery, click the Down button, and continue previewing the effects of each transition.
When you have finished exploring, click the More button to display the entire gallery, and then click the Cover thumbnail in the Subtle category.
PowerPoint demonstrates the Cover transition effect on slide 2 and indicates that the transition has been applied by placing an animation symbol below the slide number on the Slides tab of the Overview pane. (There is no indication on the slide itself.)
In the Transition to This Slide group, click the Effect Options button, and then click From Top-Left.
In the Timing group, click the Apply To All button.
An animation symbol appears below each slide number on the Slides tab.
On the Slides tab in the Overview pane, click the animation symbol below slide 3.
The Slide pane turns black, and then PowerPoint demonstrates the Cover transition from slide 2 to slide 3.
Display slide 1. In the Transition to This Slide group, click the More button, and then in the Transitions gallery, click the None thumbnail.
PowerPoint removes the animation symbol from below the slide 1 thumbnail.
On the View Shortcuts toolbar at the right end of the status bar, click the Reading View button.
PowerPoint switches to Reading view and displays slide 1.
At the bottom of the screen, click the Next button repeatedly to see the transitions of the first few slides, and then press Esc to return to Normal view.
On the View Shortcuts toolbar, click the Slide Sorter button.
In Slide Sorter view, click slide 2, hold down the Shift key, and then click slide 7 to select all the slides that have transitions.
In the Timing group, click the Sound arrow, and then click Wind.
In the Timing group, click the Duration up arrow until the duration shows as 02.00.
In the Preview group, click the Preview button to preview the transition effect again. Then if you want, preview it again in Reading view.
PowerPoint demonstrates the transition of each selected slide with the sound specified in step 13.


When you add pictures or photographs to a slide, keep in mind that using pictures you don’t own without permission, especially for business purposes, can breach the copyright of the owner. Limited use for non-commercial purposes is usually allowed as long as you acknowledge the source.
Thousands of free clip art images are available to help you add visual interest to your slides.
With SmartArt, you can create a variety of professional-looking diagrams with a few mouse clicks.
Charts present numeric data in an easy-to-grasp visual format. You can choose from 11 types with many variations.
Shapes can add interest to a slide and draw attention to key concepts. However, they can become tiresome and produce an amateurish effect if they are overused.
Avoid abrupt transitions by having one slide smoothly replace another. You can control the transition type, its speed, and when it takes place.