
It's the English speaking world's favorite economic game: property. No other facet of financial life has such a hold on the popular imagination. No other asset-allocation decision has inspired so many dinner-party conversations. The real estate market is unique. Every adult, no matter how economically illiterate, has a view on its future prospects.
The global credit crunch that began with a hiccup in the U.S. subprime markets in February 2007 and snowballed into greatest economic contraction since the Great Depression is still under way as this book is being written. Although it is often risky to write about events as they unfold, I have nevertheless chosen to do so—recognizing that the chapter will necessarily focus upon a discussion of the boom with a cursory mention of the bust. While the impact of this boom and bust sequence on the rest of the world is yet to be fully understood, the events that have transpired so far have tremendous value in our study of bubbles before they burst.
In his book The Ascent of Money: A Financial History of the World, Niall Fergusson explains what property ownership can mean to individuals as well as the world of finance. For very good reasons, investing in housing seems like a safe bet:
"Safe as Houses": the phrase tells you all you need to know about why people all over the world yearn to own their own homes. But that phrase means something more precise in the world of finance. It means that there is nothing safer than lending money to people with property. Why? Because if they default on the loan, you can repossess the house. Even if they run away, the house can't. As the Germans say, land and buildings are "immobile" property. So it is no coincidence that the single most important source of funds for a new business in the United States is a mortgage on the entrepreneur's house. Correspondingly, financial institutions have become even less inhibited about lending money to people who want to buy property.[263]
The ending of the Internet, media, and telecom boom of 2000 resulted in an unprecedented asset bubble implosion in the United States. In an effort to stimulate the economy, monetary policy became extraordinarily loose, with a host of unintended consequences. Krugman describes leadership at the Federal Reserve as follows: "Greenspan acted like a parent who sternly warns teenagers against overdoing it but doesn't actually stop the party, and stands ready to act as designated driver when the fun is over."[264] And so it was that the Greenspan Fed lowered rates in the aftermath of the Internet bubble's bursting, and proceeded to hold them at low levels for an extended period of time.
Writing in 2005, economist Robert Shiller, co-creator of the widely followed Case-Shiller housing price index whose March 2000 publication of Irrational Exuberance proved extraordinarily well timed in predicting the Internet bust—predicted a housing bust. He noted that "the market for real estate, particularly individual homes, would seem likely to display speculative booms from time to time, since the psychological salience of the prices of the places we see every day and the homes we live in must be very high, and because home prices are such a popular topic of conversation."[265] Just as he meticulously dismissed popular explanations for why the Internet boom was different and would not bust, so too did he address the numerous rationalizations explaining why the housing boom would not bust. He notes:
One such explanation is that population pressures have built up to the point that we have run out of land, and that home prices have shot up as a result. But we didn't just run out of land since the late 1990s: population growth has been steady and gradual. Another theory is that the things that go into houses—the labor, the lumber, the concrete, the steel—are in such heavy demand that they have become very expensive. But construction costs are not out of line with long-term trends. Another glib explanation is that the boom is due to the interest rate cuts implemented in many countries in an effort to deal with a weak global economy. But while low interest rates are certainly a contributing factor, central banks have cut interest rates many times in history, and such actions never produced such concerted booms.[266]
To understand the magnitude of the bubble that was created in the U.S. housing market, consider the charts (using data compiled by Shiller going back to 1890) that show the U.S. home price index (a proxy for the real, inflation-adjusted values of homes) compared to the long-run drivers of housing costs, namely the cost of building materials and the demand (i.e., population) for housing.
As visible in Figure 10.1, inflation in building materials and labor does not adequately explain the sudden and rapid rise of the home price index. Might demand for housing be the culprit? Figure 10.2 plots that same home price index against the U.S. population.
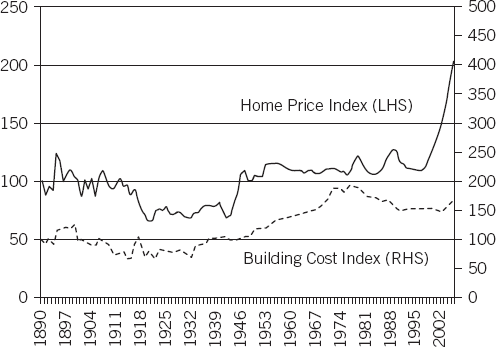
Figure 10.1. Shiller's Home Price Index vs. Building Cost Index Source: www.econ.yale.edu/~shiller/data.htm
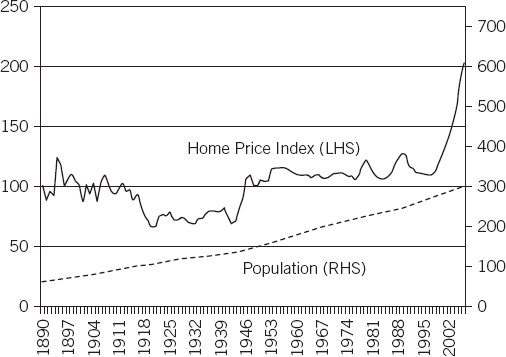
As seen in Figure 10.1 and Figure 10.2, U.S. home prices very clearly had appreciated at a rate faster than that of the fundamental housing market drivers. Between 1890 and 2005, when this chart was produced, housing prices were up 85 percent in real terms, far greater than the appreciation in building costs. Likewise, prices grew more rapidly than population, and the additional cost of money (i.e., interest rates) does not amount to much of a cost pressure on housing. In 2006, these figures clearly indicate an unsustainable boom in progress.[267]
In July 2007, the chief executive officer of Citigroup, Chuck Prince, granted an interview to the Financial Times. During the interview, he was asked about the potentially excessive housing market lending that Citigroup was conducting, particularly in light of early indications of problems in the subprime market. In a now famous response that captures the competitive risk taking that took place among virtually all participants in the housing finance markets, Prince noted, "When the music stops, in terms of liquidity, things will be complicated. But as long as the music is playing, you've got to get up and dance. We're still dancing."[268] Unfortunately for Citigroup and the rest of the housing finance complex, the music definitely stopped at some point in 2007 or 2008, and inappropriately undertaken risks were blatantly exposed—resulting in what has been to date one of the worst economic contractions and credit crunches of all time.
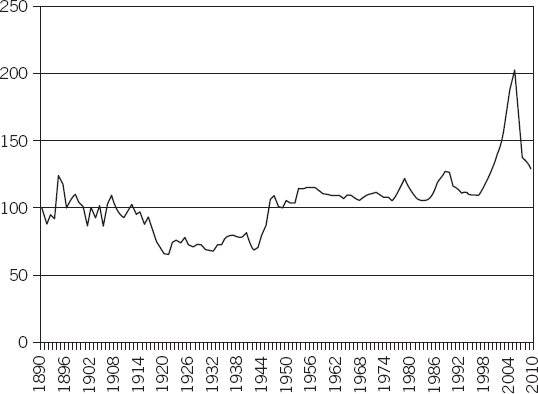
The magnitude of the pullback at the time of this writing (it's not clear if the decline is over) is best captured by the above-referenced home price index. Professor Robert Shiller maintains the data and updates it quarterly. Figure 10.3 includes the most recent data as of September 2010.
The "canaries in the coal mine" of the housing boom were the subprime lenders, many of which began keeling over in early 2007. A March 2007 article in BusinessWeek noted, "After years of easy profits, the $1.3 trillion subprime mortgage industry has taken a violent turn: at least 25 subprime lenders, which issue mortgages to borrowers with poor credit histories, have exited the business, declared bankruptcy, announced significant losses, or put themselves up for sale."[269] After significant losses due to subprime exposure were reported during the summer of 2007 by hedge funds managed by Bear Stearns, the matter snowballed into a global problem by the fall of 2007 when French bank BNP Paribas indicated that it could not accurately value assets in three of its asset-backed securities (ABS) funds because of exposure to U.S. subprime assets.
In order to fully understand how and why the housing bust accelerated and spread, it's important to understand the dynamics of the "shadow banking" system and how it differs from traditional banking operations. To do so, we need to take a step back and understand the process of securitization and how it applies to the mortgage industry.
Securitization is a process by which a pool of assets (such as mortgages or credit card loans) is divided into several pieces known as collateralized debt obligations (CDOs). For instance, if 5,000 mortgages, each of $500,000, are put into one structure, the entire pool has assets worth $2,500,000,000 (assuming all mortgages are considered good.). Let's also suppose that the pool is divided into 250 individual securities, each worth $10,000,000. Because each security has a claim against the whole pool (and not against 20 specific mortgages), the securities created in this process are seemingly less risky and more diversified. Investors such as pension funds may be able to get $10 million of exposure to mortgages without the concentration risk of having 20 direct obligations. Further, because securitization allows for the allocation of cash flows coming from the mortgages in any manner desired, each tranche (piece of the pool) need not be treated equally. Thus, senior tranches may be shielded from the first losses. This unique element allows for significant structuring flexibility and enabled the creation of seemingly very secure tranches out of arguably very insecure pools of mortgages.
The ramifications of securitization were numerous. First, it necessarily broke the symbiotic relationship between lender and borrower. Whereas banks would historically keep the mortgages on the books and service the loan directly (maintaining a relationship with the borrower), securitization enabled the separation of mortgage origination and mortgage servicing. Thus, originators no longer had a vested interest in the long-term viability of a borrower, resulting in definitively lower lending standards. At the very least, it allowed banks to issue more loans than their balance sheet might otherwise allow as they were able to securitize loans made with bank capital and thereby continue lending to more customers with recycled resources.
Secondly, securitization made dealing with problem loans particularly difficult. Because mortgages are in a pool that had their cash flows allocated according to prearranged dynamics, no one party is responsible for a particular mortgage. Whereas a delinquent borrower might previously have been able to negotiate directly with the bank holding her mortgage, securitization made such negotiations and potential loan modifications almost impossible. The result is likely to be more foreclosures and forced sales in a falling market.
The third and final element of the shadow banking system is that it is effectively part of the global capital market, and is therefore subject to the whims and vagaries typical of capital markets. For instance, a successful securitization requires there to be willing buyers of the securitized products. If capital markets become unreceptive, or downright hostile, to further securitization, as they did in 2008, then the shadow banking system is likely to shut down and generate dynamics comparable to banking failures.
At the end of the day, shadow banking is just another form of credit provisioning as it allows borrowers to obtain money from lenders. When the system broke down following the subprime market implosion, the results were felt far and wide. Banks that had previously depended on the shadow banking market to take loans off their hands were stuck with more loans than they desired, the secondary market in collateralized obligations slowed dramatically, and fearful originators stopped lending. The whole system came to a screeching halt with a dramatic contraction in the availability of credit. The resulting impact upon commerce, housing markets, and other asset classes was severe.
Because the events relating to the boom–bust sequence of the U.S. housing market are still unfolding, this section does not attempt to be comprehensive, but instead highlights issues representative of insights that may be gleaned through a multidisciplinary lens.
One of the primary factors that drove the boom in mortgage lending was that "loans are made on the basis of the value of the property, not on the ability of the borrower to repay,"[270] resulting in a powerful reflexive dynamic. Had lenders constrained their issuance of loans to those able to repay (i.e., adopting income or cash flow–based lending criteria), it's unlikely a reflexive dynamic would have been as drastic, even if it did take hold. Nevertheless, because asset-based lending was the order of the day, a virtuous cycle ensued during the boom phase and turned into a vicious cycle during the bust phase. Although related impacts from this dynamic were evident in capital flows, confidence, and economic conditions, the primary impact was found in the relationship between collateral and credit.
The relationship between the cost of money (i.e., the interest rate a buyer might pay) and the value of an asset that can be bought with that money (i.e., a house) is perhaps most obvious in those assets that are typically bought with a high percentage of borrowed money. Housing provides the clearest example of this phenomenon at work. See Chapter 2 for a referesher.
Consider the following situation. A house is sold for $400,000 to a buyer who secures a mortgage for 80 percent of the purchase price ($320,000) at an interest rate of 10 percent. For ease of calculation, let's assume that the mortgage is interest only. In this case, the monthly payments would equal $320,000 × 10% / 12 months = $2,667. Now if interest rates were to fall to 5 percent, those same payments would fall by 50 percent, with the new monthly required payments equal to $320,000 × 5% / 12 months = $1,333.
Although lower interest rates have tremendous power to lower mortgage payments, the connection with house prices—which may be less obvious—is equally powerful. Suppose now that a person had a budget of $2,667 per month. How much could he afford to pay for the same house with the lower mortgage rates? Simple algebra facilitates this calculation: $2,667 × 12 months / 5% = $640,000 of loan amount. Add to this loan amount the original down payment of $80,000 and we see that the lower interest rate might increase the amount that our buyer can afford to pay to $720,000—assuming no minimum down payment percent.
Given the dynamics between interest rates and housing prices, then, it should come as no surprise that monetary policy, which brought interest rates down to 1 percent by 2002, ignited a serious property boom. By manipulating the cost of money down to highly stimulative levels to encourage economic activity, the Federal Reserve unintentionally created tremendous upside pressure on the prices of highly leveraged assets such as houses.
Further, it might make sense to revisit Hyman Minsky's financial instability hypothesis and the role of financing structures in generating instability. In particular, there appears to be a remarkable similarity between Minsky's description of Ponzi finance and the terms on which some mortgages were underwritten. Stories of mortgages with 1-year teaser rates abound. Likewise, it now appears that many loans were taken by individuals who had neither the ability to service the debt nor pay it back with income. They were "banking" (pun intended) on the value of the home rising, thereby allowing them to either sell the property at a profit or to cash out adequate money to pay the mortgage. Such financing structures are inherently unstable, as discussed in Chapter 2.
The phrase "it takes two to tango" is highly applicable when it comes to the U.S. housing boom and bust. Ambitious homeowners-to-be were eager to "lever up" in a quest to buy the largest, most expensive home they could purchase, and eager lenders were willing to design various mortgage products to meet their needs. The seemingly symbiotic relationship was taken to extremes by both lenders willing to lend more money than a borrower could afford, and borrowers willing to borrow more than they could repay. Both parties were operating under an extraordinarily flawed assumption—namely, that house values simply do not fall.
Before we dive into the social psychology of home ownership and its virtues, we should consider some of the mortgage innovations that emerged prior to the housing boom and fueled it to lofty heights. In particular, the emergence and rapid growth of subprime loans (loans made to those with problematic credit histories), adjustable rate mortgages (mortgages that have floating interest rates that can go up over time—many of which were accompanied by very low initial teaser rates), interest-only mortgages (loans in which the borrower did not have to repay any principal), and stated-income loans (mortgages that required no documentation of income) greatly enlarged the pool of available homebuyers by increasing access to credit. Down payment assistance programs further enlarged the universe of homebuyers by providing capital for down payments.
Media reports about the housing boom and seemingly ubiquitous dinner party conversations about the rapidly rising prices of homes also contributed to the belief that house prices don't fall. The cover of Time magazine in 2005 highlighted the role of housing in wealth creation and how low interest rates were making the housing market more affordable to more people. Its headline tells the whole story: "Home $weet Home: Why We're Going Gaga Over Real Estate." As if that wasn't enough, Boston magazine's cover story (see Figure 10.4) in May 2006 (quite possibly the absolute top of the real estate market) was titled "Buy! Buy! Buy! The Smart Real Estate Moves Right Now." Unfortunately, no one appeared to be questioning whether it was even smart to be invested in real estate.
In addition to the obvious sense of overconfidence that existed among U.S. home buyers in 2005 and 2006, it seems as if even cautious home buyers suffered from cognitive biases such as anchoring and insufficient adjustment. Sure, the logic went, house prices could fall a bit, but not meaningfully enough to matter. This logic is textbook insufficient adjustment. Likewise, the fact that these adjustments were made from lofty current prices (i.e., that buyers anchored on them) made the adjustments even less useful for even cautious buyers.
Another critical factor in the U.S. housing boom and bust was political encouragement for every American to own a home. In a well-written article that shed light on the role of government in the housing boom and bust, Peter Wallison, the Arthur F. Burns Fellow in Financial Policy Studies at the American Enterprise Institute, noted that "the crisis has its roots in the U.S. government's efforts to increase homeownership, especially among minorities and other underserved or low-income groups, and to do so through hidden financial subsidies rather than direct government expenditures."[271]
How exactly did the government go about promoting homeownership? Wallison argues that the "Community Reinvestment Act, Fannie Mae and Freddie Mac, penalty-free refinancing of home loans, tax preferences granted to home equity borrowing, and reduced capital requirements for banks that hold mortgages and mortgage-backed securities" all contributed to a system that grew to be increasingly vulnerable as lending standards fell to accommodate these and other government efforts.

The Community Reinvestment Act (CRA), originally enacted in 1977, underwent a major revision in 1995, the impact of which was immediately felt in homeownership rates. CRA was adopted to prevent discrimination in access to capital and encouraged banks to focus on community needs. After the 1995 revisions were enacted, homeownership jumped from the stable 64 percent level it had been for several decades to over 69 percent by 2005.
Freddie and Fannie were two government entities designed to purchase loans from banks in an effort to encourage additional mortgage lending. In this sense, these entities were the original securitizers of mortgages and effectively created the secondary market in mortgages. As pressure mounted during the Clinton administration to increase the availability of housing finance, Freddie and Fannie responded. Wallison notes,
By 1997, Fannie was offering a 97 percent loan to value mortgage, and by 2001, it was offering mortgages with no down payment at all. By 2007, Fannie and Freddie were required to show that 55 percent of their mortgage purchases were LMI (low to moderate income) loans and, within this goal, that 28 percent of all purchases were from underserved areas (usually inner cities) and 25 percent were purchases of loans to low-income and very-low-income borrowers.[272]
Clearly, these were the least creditworthy borrowers in the system, perhaps explaining why profit-oriented banks had not previously paid attention to them as potential borrowers. It was only after the securitized market took off, and government mandates were clear, did those banks begin paying attention to this group of potential customers.
The final area of political influence on the housing market that deserves discussion is that of tax policies. Specifically, the mortgage interest deduction has effectively served as a subsidy to homeowners, with the largest subsidies going to the homeowners with the largest mortgages (presumably associated with the largest incomes). To see the subsidy in action, let's compare the difference between a person who has a $2000 per month rent payment and one who has a $2200 a month mortgage payment, of which $2000 is interest and is therefore deductible. Because the renter is not able to deduct his rent payments, his after-tax cost of housing remains $2000 per month. The homeowner with mortgage, however, is able to deduct (subject to certain limitations) the interest from his taxable income. Assuming the homeowner is in a 30 percent tax bracket, his after-tax cost of housing will be $2000 × (1 – 30%) + $200 = $1600. This basically equates to a governmental handout of $600 per month to our homeowner. Further, given that $200 of this $1600 payment is for repayment of principal, the rent equivalent is $1400 per month, $600 per month less expensive than our renter.
In an eloquent New York Times Magazine article titled "Who Needs the Mortgage Interest Deduction?" Roger Lowenstein describes the logic of the mortgage interest deduction as follows:
Some fellow in the Treasury Department had long ago decided it would be a good thing for families like ours not to suffer through our lives as tenants. In fact, he (whoever he was) decided it would be good for our neighbors and for society in general if we could be owners and not just dwellers. In early America, only those who owned property were eligible to vote, and the notion that tenants were only provisional citizens, or at least had a lesser stake in things, has somehow endured. According to studies, people who own their homes take better care of them; they fix the roof more often and plant more lilacs. They join more clubs and community groups; they vote more often; they move around less often; and their kids do better in school. The government is subsidizing my house so I will do more gardening. Or something like that.[273]
Further, because interest on home equity loans and lines of credit are also deductible, homeowners are encouraged to take out second and sometimes third mortgages against a property to fund (over)consumption. As noted by Wallison,
Interest on consumer loans of all kinds—for cars, credit cards, or other purposes—is not deductible for federal tax purposes, but interest on home equity loans is deductible no matter what the purpose of the loan or the use of the funds. As a result, homeowners are encouraged to take out home equity loans to pay off their credit card or auto loans, or to make purchases that would ordinarily be made with credit cards, auto loans, or ordinary consumer loans.[274]
By encouraging the use of home equity financing for consumption purposes, the government promotes lower equity values in homes—thereby inadvertently enhancing the likelihood of defaults and foreclosures during a real estate downturn.
The fact that the subprime market served as the last untapped universe of potential homebuyers to access the housing market indicates that their increasing participation in the housing market was an indicator of the boom's maturity. In the spectrum of mortgage quality, prime loans are considered the safest and are offered to the most creditworthy borrowers. Following prime, there is a category known as Alt-A loans, which are offered to borrowers without full documentation, with lower collateral values, and with lower credit scores. Subprime is the riskiest of the mortgages and was offered to borrowers who had historically been deemed uncreditworthy.[275] Figure 10.5 highlights the growth in subprime and Alt-A lending that took place during the final stages of the housing boom.
In addition to the absolute growth in the number of subprime and Alt-A loans issued (as evidenced in Figure 10.5), the absolute dollar amount of the risky loans (defined as subprime and Alt-A) grew exponentially, as seen in Figure 10.6. Figure 10.6 also demonstrates how these risky loans became an increasingly large share of all mortgage originations, having risen from under 10 percent in 2002 to almost 34 percent by 2006. Within this category, it is interesting to note that the riskiest of loans, subprime, grew during the same period from approximately 5 percent of the total mortgage market in 2002 to over 20 percent of the mortgage market by 2006.[276]
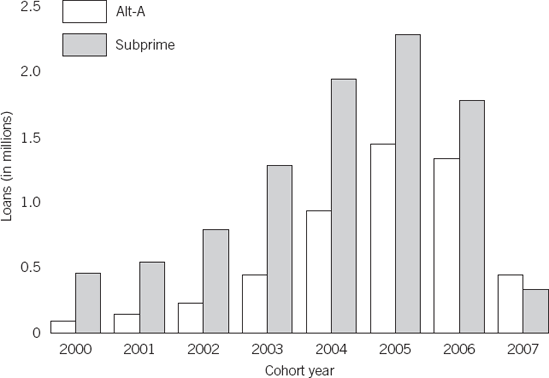
Figure 10.5. Rapid Growth in Number of Subprime and Alt-A Loans Source: General Accounting Office report accessed via www.gao.gov/new.items/d09848r.pdf
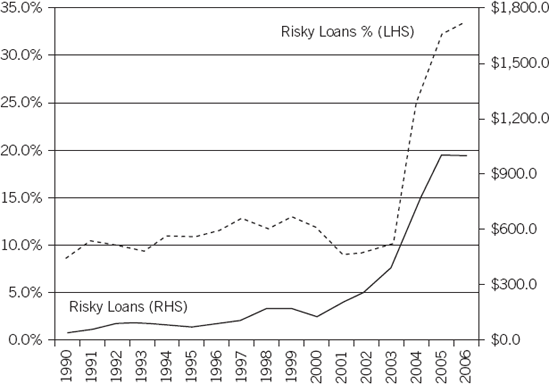
Figure 10.6. Exponential Growth in Risky Loans Source: The 2010 Mortgage Market Statistical Annual, Volume 1 (Bethesda, MD: Inside Mortgage Finance Publications, 2010).
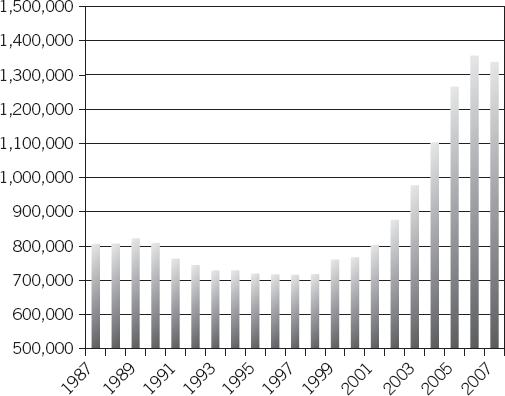
Figure 10.7. Membership in the National Association of Realtors, 1987–2007 Source: D. McCormick, Field Guide to NAR Membership Statistics, 1908–Present. Accessed electronically via www.realtor.org/library/library/fg003.

Figure 10.8. Membership in the National Association of Realtors, 1916–1936 Source: D. McCormick, Field Guide to NAR Membership Statistics, 1908–Present. Accessed electronically via www.realtor.org/library/library/fg003.
From the data, it definitely appears that most of the eligible buyers (i.e., prime, creditworthy borrowers) had already been infected, thereby leaving the "disease" only to infect the historically un-creditworthy. Obviously, the available universe of infectable potential homebuyers was rapidly shrinking. By enabling the most amateur of investors to enter the housing markets, the boom in subprime lending was a useful indicator of the housing bubble's maturity and imminent burst. The fact that TV shows like "Flip This House" were in competition with other TV shows like "Flip That House" further validates the maturity of the boom. If ordinary, television–watching non-speculators enter the housing investment business, who is left to infect?
The popularity of real estate not only grew as an investment activity, it also grew (unsustainably) as a professional activity. Figure 10.7 displays the number of members in the National Association of Realtors (NAR). Given the licensing requirements of the profession, NAR membership is a reasonable proxy for the number of real estate salespersons in the United States.
Lest we get lulled into thinking that NAR membership only rises, consider Figure 10.8, which illustrates NAR membership before, during, and after the Florida land boom. As is clear from the chart, membership clearly does fall. Given our anchoring and insufficient adjustment biases, how many observers believe that NAR membership could decline by an additional 500,000?
Table 10.1. The-Five Lens Approach to the U.S. Housing Boom and Bust
The emergence perspective on the U.S. housing bubble does not seem to offer many vivid lessons, with the possible exception of Donald Trump's revival as a cult figure among young ambitious business professionals. In addition to his bestselling books about thinking like a real-estate billionaire and his popular TV show "The Apprentice," Trump had a more subtle effect on the seemingly uninformed swarm. His personal wealth creation in real estate had been enormous and included the launch of a Vegas casino resort and some of the most prominent real estate developments in major cities. Surely if The Don was investing it was safe for Joe Six-Pack to invest.
The U.S. housing boom and bust is a classic case of a credit-fueled reflexive bubble formed by the interaction of the five Cs described above. However, an equally supportive role was played by government policies in supporting the five Cs through both the creation of a securitization market and the encouraging of homeownership and home finance. Table 10.1 summarizes the five lens view of the U.S. housing boom and bust.