
How to create and use use case diagrams
How to create and use activity diagrams
How to create and use sequence diagrams
Chapter 1 introduced you to architecture and modeling in the software space, and hinted at all the new architectural goodness available in Visual Studio 2010 Ultimate. This chapter dives deeper into three aspects of that, by looking at use case, activity, and sequence diagrams.
One of the strengths with modeling tools is that they enable you to design how the architecture of the application should be. Part of that is defining common terms around the problem domain, and then ensuring that everyone on the team understands those concepts. Using the use case, activity, and sequence diagrams, you can model your application, while ensuring that everyone on the team understands exactly what is being built.
This chapter is divided into three main sections:
Use Case Diagrams
Activity Diagrams
Sequence Diagrams
Each section begins by examining a completed diagram and explaining the different components of it. Next, the discussion looks at all the objects that are available when building a particular diagram. And, finally, you will see a step-by-step walkthrough of how to build the diagram shown at the beginning of the section.
A use case diagram provides a graphical overview of the functionality of a system. It shows who is using the system and what they can do with it.
A use case diagram does not show details of use cases themselves, but instead provides a summary view of use cases, actors, and systems. Details (such as the order in which steps must be performed to accomplish the use case) can be described in other diagrams and documents, and then linked to the related use case. Use cases (and, by extension, use case diagrams) deal only with the functional requirements of a system. The architecture and any internal details are described elsewhere.
The best way to understand any diagram is to look at an example and take it apart. Figure 2-1 shows an example of a basic use case diagram of a customer interacting with an online bookstore system.
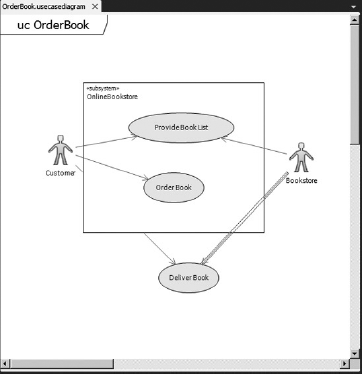
In Figure 2-1, you can see that a customer can view a list of books offered by the online bookstore. The customer can also order books from the online bookstore. The bookstore can also update the list of available books. Once a customer has ordered some books, the bookstore will deliver those books to the customer.
In this diagram, the objects labeled Customer and Bookstore are called actors. An actor represents a user, organization, or external system that can interact with your application. By default, the Actor object is represented by the person icon shown in Figure 2-1. However, this icon can be replaced with a different image by modifying the Image Path property of the object.
The oval-shaped objects labeled Provide Book List, Order Book, and Deliver Book are called use cases. A use case represents the actions that can be performed by one or more actors.
The lines drawn between the actors and the use cases are called associations. An association indicates that an actor can take part in a particular use case. For example, the Customer actor can view a list of books at the online bookstore.
The square box named OnlineBookstore is called a subsystem. A subsystem is the application, or part of the application, being worked on. In a particular use case diagram, a subsystem can represent the entire application, or possibly just a single class of the application. Any use cases that the subsystem supports are drawn inside the subsystem. In Figure 2-1, the Provide Book List and Order Book use cases are part of the OnlineBookstore application, so they are drawn inside the subsystem. The Deliver Book use case is outside the scope of the application, so it is drawn external to the subsystem.
Although Figure 2-1 is a very simple use case diagram, it is still very informative. You can also have more complex use case diagrams, with multiple subsystems, actors, and use cases. A best practice would be to start off describing the system with a few major use case diagrams. Each of those diagrams should define a major goal of the system. Once those goals have been defined, use some of the other objects from the use case diagram toolbox to define the system in more detail.
Let's break the Order Book use case down in more detail. Figure 2-2 shows a use case diagram that does this by using the Include relationship.

The Include relationship shows that a use case uses all the behavior of the included use case. To differentiate it from a regular association, the Include relationship is represented as a dotted line with an arrow on the end (per the UML 2.1.2 specification). The arrow should always point to the more detailed use case. The Include relationship is also labeled with the keyword <<include>>. Each of the included use cases is a step that the actor may have to take in order to complete the main use case. In this example, in order for the customer to order a book at the online bookstore, the customer must choose a book and then pay for the book.
A use case diagram does not specify in what order the particular use cases should happen, or when a particular use case is necessary. To make that information clear, attach an Artifact object to the general use case. Do this by dropping an Artifact object onto the use case diagram, and then dragging a Dependency relationship between the Artifact element and the general use case, as shown in Figure 2-3.
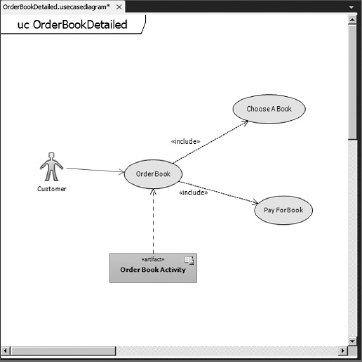
An Artifact element allows you to attach a separate document to the use case (for example, a text file that describes the steps to take). Later in this chapter, you'll learn how you can attach an activity diagram to this artifact and use case.
Figure 2-4 shows the different elements and associations available for use case diagrams.
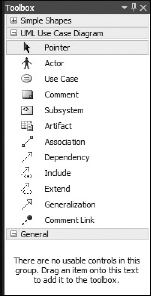
Table 2-1 describes the different elements and associations.
Table 2.1. Use Case Diagram Toolbox Objects
NAME | DESCRIPTION |
|---|---|
| Turns the mouse back into a regular mouse pointer |
| Adds a person or external system that initiates or participates in a use case |
| Adds an interaction between the system and a use case |
| Adds a comment for more details |
| Represents a part of the system |
| Adds a reference to a diagram or document |
| Links an actor with a use case |
| Defines how a use case requires another use case |
| Defines how a use case reuses another use case |
| Defines how a use case occurs only with another use case occurs |
| Defines how a use case is a specialized version of a more general use case |
| Connects a comment to a diagram element |
Let's look at the process of creating the use case diagram shown in Figure 2-1. To get started, create a new modeling project by selecting File
Select the Use Case Diagram template and name it OrderBook.usecasediagram. Click the Add button to create this diagram. A blank use case diagram named OrderBook.usecasediagram will be created in the modeling project and opened in Visual Studio.
First, from the toolbox, drag a subsystem boundary onto the use case diagram. This subsystem can be used to represent either an entire system or its major components. In the Properties window, change the Name property for the subsystem to be OnlineBookstore.
Next, add the actors to the use case diagram. Remember, the actors represent classes of users, organizations, and external systems that interact with the system being built. Drop two Actor objects onto the use case diagram, one on either side of the OnlineBookstore subsystem. In the Properties window, name the left actor Customer and the right actor Bookstore. The use case diagram should appear similar to Figure 2-5.

Note
To add multiple objects of the same type from the toolbox, double-click on the toolbox object. Then, click multiple times on the diagram to add the objects. When finished, press the Esc key to return the cursor to its regular functionality.
Once the actors are in place, drop the appropriate use cases onto the diagram. The use cases represent the activities that actors can perform. Drop two use cases inside the Online Bookstore subsystem, and rename them Provide Book List and Order Book. Add one use case outside the subsystem and name it Deliver Book.
Finally, to finish this simple use case, use the Association object to show how each actor is related to each use case. Double-click the Association object in the toolbox to select it. Click and hold on the Customer actor, and drag a line to the Provide Book List use case. An association is created between the actor and the use case. Do the same to the Order Book and Deliver Book use cases. Create associations the same way between the Bookstore actor and the Provide Book List and Deliver Book use cases.
When finished, the use case diagram should appear similar to Figure 2-1.
An activity diagram is used to show a business or software process as a work flow through a series of actions. These actions could be performed by any number of objects, including people, software, or computers. Activity diagrams can be used to model the logic captured in a particular use case, or to model detailed business logic. One easy way to think of activity diagrams would be to think of them as a flow chart.
An activity diagram always has a starting node, a series of activities, and a final node, indicating the end of the activity.
To get started, let's look at an example of an activity diagram. Figure 2-6 shows the sequence of activities for ordering a book from an online bookstore.

In Figure 2-6, a customer first chooses a book to order. After a book is chosen, the customer must make a decision whether to order more books, or confirm the order. Once the customer is finished selecting books, the customer confirms the book order, and then pays for the book.
The black dot at the upper left of the diagram is called the initial node. Every activity diagram must have this element. This indicates the starting point for the activity.
The rounded-corner rectangles on the diagram are actions. This diagram contains three actions: Choose A Book, Confirm Order, and Pay For Book. Actions represent a step in the activity, where either a user or the system performs an action.
The top diamond-shaped element is a merge node. This node is used to merge multiple branches, usually split by a decision node (described shortly). A merge node has two or more inputs and one output.
The middle diamond-shaped element is a decision node. This node is used to create branching flows in the activity. In Figure 2-6, after a book is chosen, the customer has a choice of confirming the order, or selecting more books. A decision node should have only one input, and two or more outputs.
The Connector element is used to show the flow between the different elements on the activity diagram.
Activity diagrams can also be used to describe a sequence of actions that execute at the same time. This sequence of actions is known as a concurrent flow. Figure 2-7 shows an example of a concurrent flow activity diagram related to ordering a book on line.

At the start of this activity diagram, an order is created. After an order is created, two different branch processes are started. The black bar that the Create Book Order action leads into is called a fork node, and is used to divide a single flow into concurrent flows. In this case, one flow leads to the Ship Book action. The other leads to the Send Book Invoice element.
The Send Book Invoice element is not a regular action element. It is a Send Signal Action element. This indicates an action that sends a message to another activity for something to happen. The Receive Book Payment is an Accept Event Action element. It is an action that waits for a message before the flow can continue. In the case of Figure 2-7, a book invoice will be sent, potentially to a payment system. The flow in the activity diagram waits until a response is received back, indicating that the book has been paid for. Both the Ship Book and the Receive Book Payment actions are then merged back into a single process using a join node. The activity ends with the closing of the order.
Note
The fork node and/or join node can be set to a vertical orientation if desired.
Data flowing into and out of an activity can be represented in two different ways. The first way is using an object node. This is usually the simplest method to describe the data flowing between activities. Think of an object node as a variable in a program. It stores a value (or multiple values) passed from one action to the next.
Most activity diagram control flows carry some sort of data, as shown in Figure 2-8. A customer enters shipping information, and that data is passed on so the books can be shipped.

In Figure 2-8, the round-cornered rectangles represent actions in the diagram, where actual processing or other business logic occurs. The square-cornered rectangles represent the flow of objects or data from one action to the next. In Figure 2-8, the customer name, shipping address, and phone number are passed from the action where the customer enters that information to the action where the books are shipped to the customer.
The object node has a property called Type, where the type of the object can be set. By default, there are four primitive types to choose from:
BooleanIntegerStringUnlimited Natural
You can also create your own types and objects, such as an Address class. This allows you to create the types you need, and set the object node to the appropriate type.
The second way to represent data flowing into and out of an activity is by using input and output pins, as shown in Figure 2-9.

In Figure 2-9, the top activity contains an output pin. The output pin represents data that an action produces — in this case, the order detail information. The bottom activity contains an input pin. The input pin represents the data that an activity consumes — in this case, the customer name, address, and phone number for shipping the order.
Note
When using input and output pins, be sure to give them a name that indicates the role of the objects they produce or accept (for example, a parameter name).
As with the object node, the input and output pins have a Type property that can be set to the appropriate object type.
Figure 2-10 shows the different elements and associations available for activity diagrams.

Table 2-2 describes the different elements and associations.
Table 2.2. Activity Diagram Toolbox Objects
NAME | DESCRIPTION |
|---|---|
| Turns the mouse back into a regular mouse pointer |
| Adds the start of the activity |
| Adds an end to the activity |
| Adds a single step that occurs in the activity |
| Represents an object that participates in the activity |
Adds a comment for more details | |
| Divides a single incoming flow into a choice between alternate outgoing flows |
| Combines incoming alternate flows into a single outgoing flow |
| Divides a single incoming flow into concurrent outgoing flows |
| Combines incoming concurrent flows into a single outgoing flow |
| Adds an action that sends a signal |
| Adds an action that waits for a signal or event |
| Adds an action that calls another activity |
| Adds an action that calls an operation |
| Represents data that an action requires |
| Represents data that an action produces |
| Represents data that an activity requires or produces |
| Adds a connection or flow between elements on the diagram |
Let's look at the process of creating the activity diagram shown in Figure 2-6. Using the same modeling project created earlier in the section, "Creating a Use Case Diagram," right-click on the project in Solution Explorer, and, from the context menu, select Add
Select the Activity Diagram template and name it OrderBook.activitydiagram. Click the Add button to create this diagram. A blank activity diagram named OrderBook.activitydiagram will be created in the modeling project and opened in Visual Studio.
From the toolbox, drag an Initial Node element onto the diagram. This indicates the starting point for this activity. Next, drag three Action elements onto the diagram. Using the properties of the elements, name these items Choose A Book, Confirm Order, and Pay For Book.
From the toolbox, drag a Merge Node above the Choose A Book action. Drag and drop a Decision Node between the Choose A Book and Confirm Order actions. Finally, drag an Activity Final node to the right of the Pay For Book action. The diagram should resemble Figure 2-11.

Next, you must add the connectors to show the flow of activity through this activity diagram. Double-click the Connector element to select it. On the activity diagram, drag a line between the Initial Node element and the Merge Node. Continue connecting the other elements on the diagram as follows:
Connect the
Merge Nodeto theChoose A Bookaction.Connect the
Choose A Bookaction with theDecision Node.Connect the
Decision Nodewith theConfirm Orderaction.Connect the
Decision Nodewith theMerge Node.Connect the
Confirm Orderaction with thePay For Bookaction.Connect the
Pay For Bookaction with theActivity Final Node.
Finally, modify the Guard property of the connector elements, leaving the decision node to specify the reasons for the different pathways. On the connector to the Confirm Order action, add the guard Finished Ordering. On the connector to the Merge Node, add the guard Wants To Order Multiple Books.
When finished, the diagram should appear similar to Figure 2.6.
Earlier in this chapter when examining use case diagrams, you added an artifact element to the diagram (see Figure 2-3). One available option with artifact elements is the capability to associate them with an activity diagram (and, as an extension, any physical document).
To do this, select the Artifact element on the use case diagram. In the properties window for the element, select the Hyperlink property. This will open the Open File dialog box, allowing you to select a diagram, document, or other file to associate with the Artifact element on the use case diagram.
Note
To ensure that the file path remains valid on a team member's computer, only select files contained in the Visual Studio solution. Also, be aware that referencing Visual Studio UML diagrams outside the current project will not work properly.
A sequence diagram is used to show the sequence of interactions between classes, components, subsystems, or actors. A sequence diagram is read from top to bottom, indicating the flow of time through the system. From left to right, the diagram itself shows the flow of control from one element to the next.
To get started, let's look at an example of an activity diagram. Figure 2-12 shows the sequence of flow for ordering a book from the online bookstore.

In Figure 2-12, a customer first has the desire to purchase a book. At that point, the customer adds a book to a shopping cart. The order system checks the availability of the book and performs some internal processing. The availability of the book is returned to the ordering system. The payment system is represented by a separate sequence diagram, so a reference placeholder is inserted into this diagram. Finally, a message is sent to an unknown (or unspecified) system at the end of the process.
The three vertical lines on the diagram (Customer, Order, and Book System) are called lifelines. These vertical lines represent participants in the described interaction. Time progresses down the lifeline, from top to bottom. Notice the Customer lifeline has a symbol representing a person above it. This symbol is called an actor, and indicates that this lifeline represents a participant external to the system being developed. This symbol can appear above any lifeline by setting the Actor property to True. An actor lifeline can also be created by dragging an actor from the UML Model Explorer onto the sequence diagram.
Note
The box at the top of a lifeline has rounded corners to indicate that it has been generated from program code, and is shown as a regular rectangle if it has been drawn by hand.
The initial message that starts with a black dot in the upper left of the diagram is known as a found message. It indicates an asynchronous message from an unknown or unspecified participant into this sequence diagram.
The grey vertical shaded rectangles on each lifeline are called execution occurrences. These represent a period when the participant is executing an operation. Execution usually begins when the participant receives a message. From within an execution block, other messages can be sent to other participants, or even to itself.
To get started in this process, the customer creates an order. This is done using a create message. This message creates a participant. If a participant is being created, this should be the first message it receives.
Next, the customer adds a book to the shopping cart. This is represented using an asynchronous message. An asynchronous message is shown as a solid arrow leading from one lifeline to another, with no return arrow. An asynchronous message is one that does not require a response before the sender can continue. It shows only the call from the sender. It can be used to represent communication between separate threads or the creation of a new thread.
The Order lifeline must check to see if the book is available. This is done using a synchronous message. A synchronous message looks similar to an asynchronous message, except that it includes a dotted line and arrow, indicating a return at the end of the message. With a synchronous message, the sender must wait for a response before the workflow can continue. The sequence diagram shows both the call and the return. Synchronous messages are normally used to represent ordinary function calls in a program.
While in an execution occurrence, a participant may need to send messages to itself to accomplish a task. These messages are called self messages, and are shown as an asynchronous call starting and ending from the same lifeline.
A sequence diagram can also send messages to unknown or unspecified participants. This type of message is called a lost message. In Figure 2-12, this message is represented as an asynchronous call leaving the Book System lifeline, and ending in a black dot.
Notice the box labeled Payment System. The Payment System itself is defined in another sequence diagram. However, the payment system is relevant to this particular sequence diagram as well. Instead of replicating the information in the Payment System sequence diagram, a reference is placed to it instead. This reference is called an interaction use. It is used to enclose a sequence of messages that are defined in another diagram.
Figure 2-13 shows a screenshot of the different elements available for sequence diagrams.

Table 2-3 describes the different elements and associations.
Table 2.3. Sequence Diagram Toolbox Objects
NAME | DESCRIPTION |
|---|---|
| Turns the mouse back into a regular mouse pointer |
| Adds a participant (such as a class or object) to an interaction sequence |
| Adds a message that calls an operation and expects a response |
| Adds a message that calls an operation but does not expect a response |
| Adds a message that calls an operation that creates an instance of the target |
| Adds a comment for more details |
| Connects a comment to a diagram element |
| Adds an interaction use to create a reusable sequence or to reference another sequence |
Let's look at the process of creating the activity diagram shown in Figure 2-12. Using the same modeling project you have been using throughout this chapter, right-click on the project in Solution Explorer, and, from the context menu, select Add
Select the Sequence Diagram template and name it OrderBookSequenceDiagram.sequencediagram. Click the Add button to create this diagram. A blank sequence diagram named OrderBookSequenceDiagram.sequencediagram will be created in the modeling project and opened in Visual Studio.
From the toolbox, drag a Lifeline element onto the diagram. This element will indicate the customer who is ordering the book. Using the Properties window, change the Type property to be Customer and set the Actor property equal to True. Drag two more Lifeline elements onto the diagram, and set the Type properties to Order and Book System, respectively.
This sequence diagram is started with a message from an unknown source. This is represented with an asynchronous message. Select the Asynchronous element in the toolbox, then draw a line from a blank space on the diagram to the Customer lifeline. This will create the starting point into the sequence diagram, indicated by a black dot. Change the Name property to Want A Book.
Next, a create message must be sent to create a participant. If a participant receives a create message, it should be the first message it receives. Click the Create element in the toolbox. On the Customer lifeline, click the grey execution box area, and drag a line to the Order lifeline. A dotted line will be created between the two lifelines, and a grey execution box will appear on the Order lifeline.
To start the ordering process, the customer must add an item that he or she wants to buy. This will be represented using an Asynchronous message call. An Asynchronous element represents an interaction where the sender can continue immediately without waiting for the receiver. In the toolbox, select the Asynchronous element. Click on the Customer lifeline and drag a line to the Order lifeline. A solid line will be created between the Customer and Order lifelines. Change the name of the element to Add A Book.
Once a book is added, the book availability must be determined. This is done using a Synchronous message call. A Synchronous element represents an interaction where the sender waits for the receiver to return a response. In the toolbox, select the Synchronous element. Click the Order lifeline and drag a line to the Book System lifeline. A solid arrow will be created between the Order and Book lifelines. In addition, a dotted arrow will be created from the Book System lifeline to the Order lifeline. This indicates control is to be returned to the sender — in this case, the Order lifeline. Change the name of the element to Check Book Availability.
A participant can also send a message to itself — for example, if it were triggering internal methods for doing work. Select the Asynchronous element from the toolbox. On the Book System lifeline, click the Check Book Availability execution block. Drag a line farther down in the same block and release. This creates a solid arrow from the Check Book Availability execution block back onto the same execution block.
There is a complete payment system sequence that is not represented on this particular sequence diagram, but instead is shown on a separate diagram. To represent the contents of that separate diagram, use the Interaction Use element. Click the Interaction Use element in the toolbox. Drag a box across the different lifelines that are included in this reference. Change the name of the element to Payment System.
Finally, you can represent a message to an unknown or unspecified participant. This is known as a lost message. Select the Asynchronous element from the toolbox. At the bottom of the Book System lifeline, drag a line from the lifeline to a blank area on the diagram. An arrow will be created from the lifeline to a created black dot, indicating this message goes to an unknown participant.
This chapter examined the capabilities of use case diagrams, activity diagrams, and sequence diagrams. You looked at an example use case diagram, and learned about its different components. You also learned how to create a use case diagram. Next, you learned about activity diagrams, where, in addition to examining an example of how to build a diagram, you also learned how to link an activity diagram back to a use case diagram. This chapter concluded by discussing sequence diagrams, their components, and how to create them.
Chapter 3 provides an in-depth look at two more important diagrams. Component diagrams are used to show the different parts of a design of a software system, while class diagrams are used to show the classes within an application and the relationship between those classes.