
Before getting into the specifics of the modeling tools that make up Civil 3D, it's important to look at some tools that cover all aspects of the model and design. These tools are designed to be part of the overall picture as opposed to any particular function or task. Although this isn't part of the modeling operation per se, these tools cover tasks that many users of the data consider important, such as the generation of inquiries, reports, and spreadsheets.
This chapter discusses the following concepts:
Using the Insquiry tool to understand the model
Generating and customizing data reports
Using the tool palettes and catalogs
As soon as the first piece of a model has been built, users want to know more about it. For example, they may need surface elevations, alignment station and offset information, point inverse information, or other data. Although it's possible to use labels or other model tools as discussed in Chapter 1, "Welcome to the Civil 3D Environment," more commonly, you just need a bit of information and don't want to disturb the drawing file itself. In this situation, you use the Inquiry tool.
The Inquiry tool is part of the Analyze tab's Inquiry panel. It enables you to query your data model without adding labels in order to find information about points, surfaces, alignments, profiles, profile views, sections, sections views, and corridor sections. These queries run in the drawing and return information to the Inquiry tool. This returned information can then be copied to other documents, pasted as data to the command line for input, or just noted for later use. Let's look at examples dealing with points, surfaces, and alignments as these tend to be the most commonly used.
As soon as many users get into Civil 3D, they want to know how to inverse between two points. You could draw a line and list it or label it using the Civil 3D labeling routines, but far simpler is just a basic inquiry. In this exercise, you'll get some point information from survey data in your proposed subdivision.
Open the
Inquiry Tools.dwgfile. (Remember, all data for this text can be downloaded fromwww.sybex.com/go/introducingcivil3d2010.)Zoom to the southeast portion of the site to review the point data you're interested in, as shown in Figure 2.1. These points represent the centerline of the road according to the survey field data.
From the Analyze tab's Inquiry panel, click the Inquiry Tool button to display the Inquiry Tool palette.
On the Inquiry tool, select the Inquiry Type pull-down list and expand the Point branch to select Point Inverse as shown in Figure 2.2.
Click the ellipsis button on the Point 1 Number row, and then select the text or point symbol near point number 924 to make your display appear similar to what's shown in Figure 2.3.

There are a few things that you should note about this drawing file and the results so far. When you selected using the ellipsis, the toolbar knew you were looking to pick a Civil 3D point object, so it would not have allowed you to snap to a line endpoint. When you selected that point, the Point 1 coordinate filled in based on the x and y of the point, but the easting, northing, and other coordinate system information filled in as well. These values are calculated only because this drawing has a coordinate system assigned. If the system had not been assigned, these values would be blank.
Click the ellipsis button on the Point 2 Number row, and select point 939 (it's near the entrance road to the subdivision). The palette should look similar to Figure 2.4.


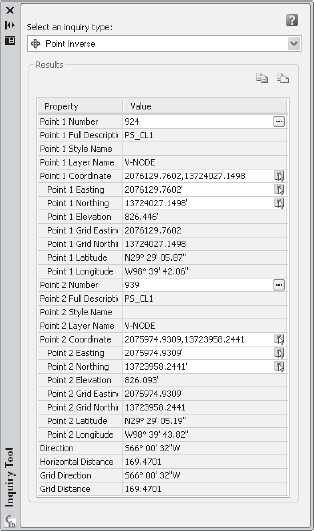
The calculated direction and horizontal distance are reported back in the last few lines of the palette, along with an adjusted version based on the grid coordinate system. Although this information can be handy, let's try one more inquiry based on linework, and push that data into a text editor for further reporting or archiving purposes.

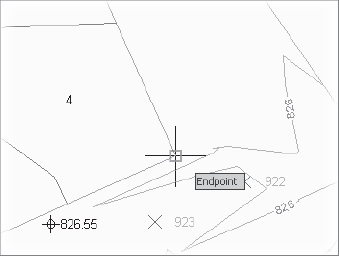
Click the Pick On-Screen button on the Point 2 Coordinate row, and select the northeast corner of lot 11 (pan to the northwest to follow the back of the lots). A tracking line is displayed to show the two points being inversed, and the Point 1 Number and Point 2 Number values are blank because you are not inversing a pair of Civil 3D points.
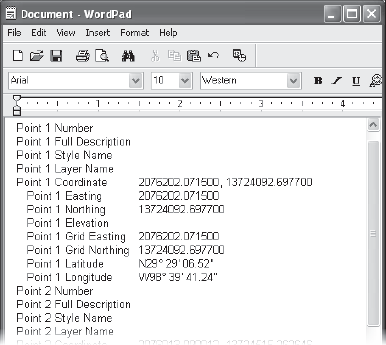
It's great to be able to get this data, but how can you use it? When legal documents are being prepared, one of the most common problems is getting data into the document without a typo, especially with long strings of numbers. Within the Inquiry tool, right-click on any row to get two options: Copy Value to Clipboard and Copy to Clipboard. Copy Value to Clipboard will put the current cell on the clipboard, while Copy to Clipboard puts the entire palette on the clipboard. You can then paste that data into another document, as shown in Figure 2.6.
You can also paste directly into a spreadsheet program, and the cells will be separated as you'd expect. Finally, a single value paste can be valuable when filling in a note or when updating a complex legal description after updating some linework.
You'll look at building surfaces in Chapter 7, "Surfaces," but if you want a feel for how they can be analyzed for simple inquiries, stay in the Inquiry toolbox. The Surface inquiry options include Surface Elevation and Grade at Point, and Surface Elevation and Grade Between Points. Here's an exercise that uses the first option:
Open or continue using the
Inquiry Tools.dwgfile.From the Analyze tab's Inquiry panel, open the Inquiry Tool palette (if it is not already open).
Zoom to the middle of the subdivision so that you can see the rough area around lots 36 and 37.
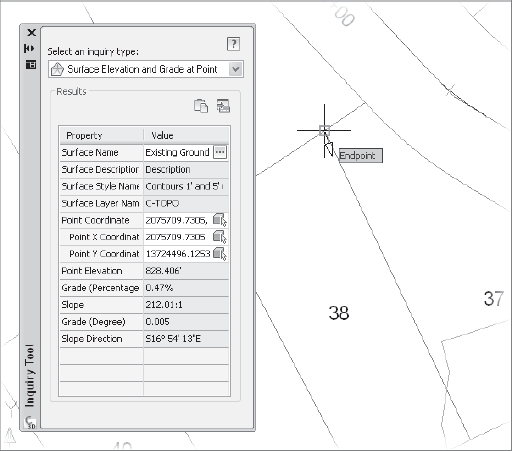
On the Inquiry Tool palette, click the Select Inquiry Type pull-down list and select Surface → Surface Elevation and Grade at Point.
Click the Select on Screen button in the Point Coordinate row and snap to the endpoint of the lot 37 lot line as shown in Figure 2.7.
It's important to realize that the single point grade will reflect a single triangle face in a larger surface, so you'll be getting one point of data. Notice that you can see an arrow, which indicates the actual slope direction as well as the slope direction shown on the Inquiry Tool palette. Many people use surface labels for handling single-point slope inquiries. Those are covered in Chapter 7.
The more common inquiry of a surface is to look at the difference in elevation and grade across a site or a single lot. These are more general inquiries to give the designer a feel for how drainage issues might be addressed. This is where the second Surface option, Elevation and Grade Between Points, comes in:
On the Inquiry Tool palette, change the Inquiry Type to Surface Elevation and Grade Between Points.
Click the ellipsis button on the Surface Name row to display another Inquiry Tool dialog. Select Existing Ground (1) and click OK to dismiss the dialog.
Zoom so that you can see the entire subdivision.
Click the Select on Screen button in the Point 1 Coordinate row and select a point near the entrance road to the site.
Click the Select on Screen button in the Point 2 Coordinate row and select a point in the middle of the northernmost cul-de-sac. Your screen will show a temporary line indicating the analysis points, and the Inquiry tool should look similar to Figure 2.8.
The data in the Inquiry tool reflects a direct line between the two points selected, meaning that the calculated data ignores any troughs or peaks between the points. This data is not an average slope between the points, merely a calculated delta expressed in a percentage slope. With the surface analyzed, let's look at a couple of alignment inquiries, and see how that data can be reviewed.

Alignments tend to be the main location instruments within transportation or subdivision design. Based on a station and offset from a given alignment, most points on a site can be located. In this case, you'll just be locating some on a property corner along the street. Additionally, you can get surface elevations at these points. This can be handy when looking at design surface information for laying out building pad elevations or drive entrances.
Open or continue using the
Inquiry Tools.dwgfile.Open the Inquiry Tool palette from the Analyze tab's Inquiry panel (if it is not already open).
Zoom to the middle of the subdivision so that you can see the rough area around lots 38 and 39.
Change the Inquiry Type to Alignment → Alignment Station, Offset, and Surface Elevation at Point. An Inquiry Tool dialog will appear asking you to select an alignment. Select Carson Circle and click OK to dismiss the dialog. You should be back in the Inquiry Tool palette now. Note that you can change either the reference surface or alignment using the ellipsis buttons on the corresponding rows.
Use the Pick on Screen button in the Point Coordinate row to select the front point on the lot line splitting lots 38 and 39. Your palette should look similar to Figure 2.9.
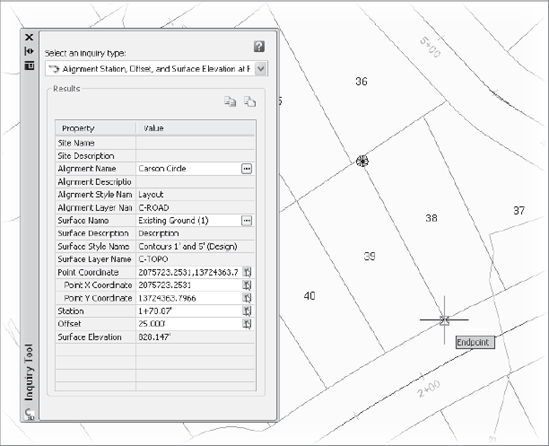
The offset of 25′ also helps verify that the street and lots have been layed out correctly based on the right-of-way requirements. By using the various inquiry tools, you can understand the existing conditions quickly, as well as perform design checks without changing the contents of the drawing in an adverse way. Now it's time to look at generating some reports from within Civil 3D.
Land development projects don't consist simply of construction documents. Many projects require the filing of reports and other documents that relate to the design information on the site, but don't make sense in the construction documentation package. However, much of this data can be extracted from the model in the form of reports that can then be printed or saved for historical purposes.
Civil 3D offers built-in reports covering alignments, corridors, parcels, points, profiles, pipes, and surfaces. These reports are accessed from the Toolspace palette set on the Toolbox palette. To open the Toolbox, select the View tab and Palettes panel on the ribbon as shown in Figure 2.10.

There are two types of reports in Civil 3D: XML-based reports that are displayed directly inside Internet Explorer where they can be saved or printed; and .NET-based text reports that are simply saved to your hard drive and then displayed in Internet Explorer (IE). You'll see an example of each in the next section, where you'll look at a parcel metes and bounds report and a station offset report for some lot corner points.
Although you can review the legal metes and bounds of any parcel by exploring that parcel's Properties dialog, it's often required to generate simple reports for each lot for archiving. You can get a basic report almost automatically from Civil 3D's Toolbox.
Open the
Generating Reports.dwgfile. This file has the lots and alignments we looked at previously, as well as some Civil 3D points placed along lot corners.Open the Toolbox palette within Toolspace, if it's not already open. (Remember, Toolbox is accessed from the View tab's Palettes panel.)
Within the Toolbox palette, expand Reports Manager → Parcel.
Right-click Metes_and_Bounds and select Execute to display the Export to XML Report dialog.
Clear all the check boxes. Click the Pick from Drawing button (shown on the bottom left of Figure 2.11) and select the lot numbers for 38, 39, and 40. Press Enter and click the OK button.
IE should launch and display the report shown in Figure 2.12.


When you're running reports, be aware that some reports require an ActiveX control to be used in IE to complete. If you're running IE7, you should see a warning bar across the top warning you about ActiveX controls. Right-click on this warning bar and select Allowed Blocked Content, and then click Yes on the Security Warnings that appear. Be sure to contact your IT staff if you run into more complex problems! You can close IE when you're done reviewing the reports.
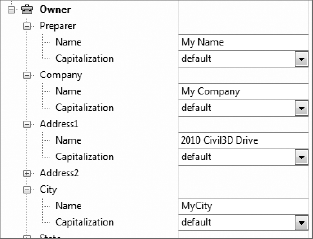
Although the report and the data created were just fine, it has a generic Your Company Name heading (as shown previously in Figure 2.12.). So, in the following exercise, you'll make the quick change required there before moving on to the other report you're going to run:

Expand the Owner branch, and fill in appropriate information as shown in Figure 2.13. You are the owner, and the Client branch is typically your client or the report recipient. Note that these settings are installation-dependent, meaning they'll be used every time you run the report, no matter which drawing file you are in.
Rerun the report, picking a new parcel if you'd like, and you should see your report updated to reflect these changes.
Although it's not really a topic that pertains to Civil 3D per se, you can customize these XSL-based reports if you have some knowledge of the XSL language, as well as some level of programming knowledge. Be sure to back up the originals if you decide to really tweak the output.
When preparing survey information for stakeout or lot pin placement, being able to use the alignment as a reference point for geometry is invaluable. In the following exercise, you set up and run one of the more complicated .NET-based reports available in Civil 3D:
Continue with the
Generating Reportsdrawing file and the Toolbox palette open.Within the Toolbox, expand the Points branch.
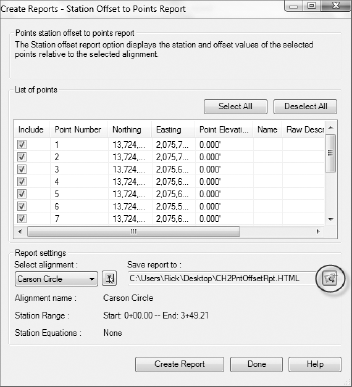
Right-click Station Offset to Points and select Execute to display the dialog shown in Figure 2.14.
Click the Select Alignment drop-down list and select Carson Circle.
Click the Browse button (circled in Figure 2.14.) on the far right of the Save Report To: path to display the Select a HTML file.
Navigate to your desktop, enter a filename of your choice, and then click Save to close the dialog.
Click the Create Report button to display the information in Figure 2.15.
When you are finished viewing the report, dismiss the Browser screen by clicking the X.
Click the Done button on the Create Reports screen to dismiss the dialog.

These reports can be printed directly from your browser for filing or archival purpose, but modifying the reports that come from .NET sources is not generally possible beyond changing the Client and Owner information as shown here.
In AutoCAD, tool palettes are general AutoCAD tools; however, in Civil 3D, there are some great blocks and special functionality that you'll want to understand. Most Civil 3D interaction focuses on using the tool palettes in conjunction with corridors, but there are a lot of great tools and blocks on the tool palettes that are valuable to civil designers. Let's start with exploring these items before we get into the Corridor and Catalog functions.
With every release of Civil 3D, more content has been added to the box to make your design and presentations a bit easier to realize. Too few users recognize these blocks exist, as they're hidden away by default in Civil 3D. Because many users miss this new content in each release, it's worth examining a few of them in the following brief exercise:
Open the
Tool Palettesdrawing file. The surfaces in this drawing have been set to not display, but they're still available to the model.From the Home tab's Palettes panel, click the Tool Palettes icon to open the Tool Palette. You can also simply press Ctrl+3. The default tool palette should look something like Figure 2.16.
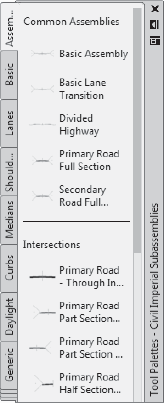
The Tool Palettes feature in Civil 3D can handle an almost unlimited number of individual palettes. These are typically organized into palette sets. The default palette set, Imperial, is focused on Corridors. There is one palette here that you should check out: the Imperial Parking tools palette. You'll put some parking lots in your drawing just to illustrate the use of these tools.
Right-click on the gray area of the tool palette, and select Civil Multiview Blocks to activate that palette set. Move your cursor over the tabs or drag the bottom of the tool palette to make the tabs larger and make searching easier. When you see the Imperial – Parking Tools palette, click its tab to activate it as in Figure 2.17.
Use the scroll bar to locate the button labeled 9ft Stall-60(s) and click it.
Snap to the front of the lot line dividing lots 8 and 9 to place the block.
Zoom in on the new block placement and select it to activate the grips shown in Figure 2.18.
Because not many Civil 3D users spend a lot of time playing with the dynamic block feature in Civil 3D, let's look at the grips numbered in Figure 2.18. and how to use them.
Grip 1 is the insertion point of the block.
Grip 2 will allow you to align the block with another.
Grip 3 will flip the block along a line drawn from the insertion point to this grip.
Grip 4 will stretch the block along the x-axis, adding more parking spaces in a dynamic fashion, based on the original definition of the block.
Grips 5 and 6 will lengthen the legs of the stall.
Grip 7 will enable an option for a parking stop to be drawn in each parking space.
The construction of dynamic blocks is beyond the scope of this text, but the idea of constrained blocks and other items that size based on their requirements is incredibly powerful. There is very good information in the Help files and in other AutoCAD focused texts.
Next, you'll use this block to lay out the parking stalls.
Click grip 2 and then the front line of lot 9 to align the parking stall.
Click grip 3 to flip the stall out into the street.
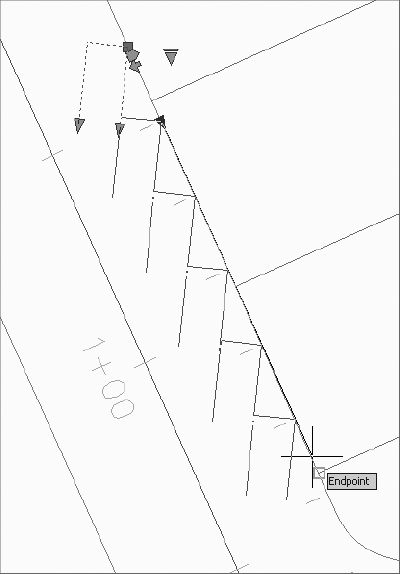
Click grip 4 and drag your mouse southwest. Notice that the length increases in increments related to the distance required to fit in another parking stall.
Snap to the front endpoint of the lot line dividing lots 6 and 7, as shown in Figure 2.19., to finish the parking stall layout.
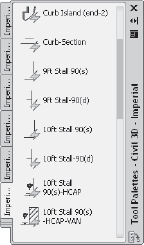

Although this is more of an illustrative example than a practical one, you can see the speed of layout available with predefined tools. There are over 20 different layout tools on this palette, including curb islands and handicapped accessible stalls, all built to industry standards.
Beyond the layout tools presented here, there are also hundreds of blocks built and designed to help make basic presentation drawings and renderings. These blocks include street signs, benches, landscape objects, houses, and trees. In this exercise, you'll place some blocks in the drawing using Civil 3D tools to place them at the right elevation and use the visual styles discussed in Chapter 1 to create a quick site illustration.
Scroll down within the palette to find the Colonial 01 block and click it.
Place the block somewhere within lot 7, and then place another Colonial 01 in lot 6. If you pick the block just placed, you can right-click and select Object Viewer. Tilted into an isometric view as in Figure 2.20, these blocks gain height and design features, hence the name multiview blocks.
Place a Colonial 02 in lots 3, 4, and 5.
After placing the blocks, rotate them using standard AutoCAD commands so that each building's outline falls inside the lots.
Change to the Landscape palette. There are scores of trees, bushes, and other landscape elements located on this palette.
Click a few varied elements and place them in the lots, in front of the house to create some conceptual landscaping design. To make it go fast, place one tree or shrub block from the palette, and then use AutoCAD commands to copy and array more blocks however you like.
Ensure that the Proposed Ground surface is visible. Click the surface to activate the Tin Surface contextual tab.
From the Tin Surface tab's Surface Tools panel, expand the Surface Tools and select Move Blocks to Surface to display the Move Blocks to Surface dialog shown in Figure 2.21.
Click the first block listed, and then Shift+click the last block listed, scrolling if necessary. All the blocks should be highlighted (as in Figure 2.21).
Click OK to dismiss the dialog.
From the View tab's Views panel on the ribbon, select NW Isometric.
Expand the Views panel and select Conceptual Style from the pull-down to see these items painted with color.
Zoom in on the building and plant blocks just inserted, and your screen should look similar to Figure 2.22. This view has been tilted a bit using the Free Orbit tool found in the Navigate panel.


Explore the other palettes in the MV Block palette set, and you'll find objects such as fencing, benches, landscape rocks, light posts, and even a golfer with a flag. You're not going for a full-rendered view, but it's amazing what a few buildings and trees can do for the layman trying to understand your site design.
While the palettes are populated with a large number of tools, there are also times when you'll want to make your own. One primary example is when you're dealing with corridor design. Corridors are a powerful toolset within Civil 3D for building roads, channels, ponds, or almost anything. Between the myriad of controls and the wide variety of parts available for building design sections, you can program almost any solution within Civil 3D. However, all these parts come with a dizzying array of options. To make things simpler, many users find that building a custom palette from the parts catalog makes their day-to-day design work faster.
Civil 3D comes with preloaded palettes broken down by category. In this exercise, you'll make a new palette and populate it from the stock parts catalogs based on use instead. Because you are modifying the Civil 3D environment instead of a drawing file, you can do this exercise in any drawing file you like, but a drawing does have to be open to modify the tool palettes.
Open Tool Palettes (if it's not already open) by pressing Ctrl+3.
Right-click the Tool Palette title bar and select the Civil Imperial Subassemblies palette set.
Right-click the topmost tab and select New Palette from the pop-up menu. A new palette will be created and the name text will be highlighted for entry.
Enter Subdivision as the name of the new palette and press Enter.
From the View tab and Palettes panel, select Content Browser to launch the Autodesk Content Browser shown in Figure 2.23. Civil 3D and some of the other AutoCAD products use these catalogs to carry specific modeling elements. In the architectural world, this can mean doors and windows; in the Civil 3D world, it's section elements such as paving and guardrails.
Click the Corridor Modeling Catalogs (Imperial, .NET) icon to open the catalog and display the catalogs list.
Click Lanes to view the Lanes subassemblies within this catalog.
Click the blue icon located over LaneOutsideSuper and hold down your mouse button. You will see the eyedropper tool fill as in Figure 2.24.
Still holding the mouse button down, drag your eyedropper to the Subdivision palette you created in the first part of this exercise and let go.
Civil 3D will create a new icon on the palette, and you'll see the name Lane-OutsideSuper next to it. Some users (including your author) have problems getting Civil 3D to display the pictures in the tool palette. (Don't worry, the tool is still there.)
Switch back to the Catalog, and click the hyperlink near the top for Civil 3D Imperial Subdivision Roads Subassembly Catalog to step up a level. You can also use the back button near the top left.
Click Curb and Gutters to open the sidewalk, curb, and gutter subassemblies.
Using the same eyedropper technique, drag the UrbanCurbGutterGeneral and UrbanSidewalk subassemblies to your palette. When complete, your palette should look something like Figure 2.25.


By organizing the subassemblies needed for a given design situation instead of organizing by type, you can reduce the amount of hunting and clicking as you're building your model.
Within Civil 3D, there are a number of tools available for your use. These include blocks and palettes for making quick conceptual renderings, inquiry tools for project managers and designers to understand the model better, and reports for producing documentation beyond the construction drawings. By using these tools in all phases of your model and plan preparation, you'll be a faster and more efficient designer.