
In civil engineering, lines and curves are indispensible. Lines and curves "connect the dots" to represent simple things such as fences, walls, and property lines, all the way through complex highway centerlines, wetlands delineations, and more. In Civil 3D, these lines and curves serve as foundation geometry for parcels, alignments, corridors, and pipe networks.
This chapter includes the following topics:
Drawing deeds with lines and curves
Creating a property line by best fit
Labeling lines and curves
Creating a segment table
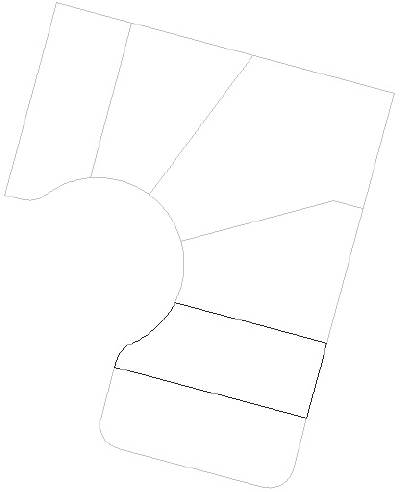
One of the most common tasks at the beginning of any land development project is re-creating deeds. These deeds could represent single family lots, roadway centerlines, easements, or any other legal description. In the following example, you add a missing lot to an existing subdivision plat (Figure 3.1).

There is no one "right" way to re-create a deed in Civil 3D. You may prefer to use the Lines and Curves tools under the Draw panel on the ribbon or a combination of commands found on the Draw panel, such as polyline, arc, circle, trim, and extend. You can also use the transparent commands, which are discussed in the next section. The following exercise shows you some of the tools available under the Draw panel that you may find useful when drawing legal linework.
Open the drawing file
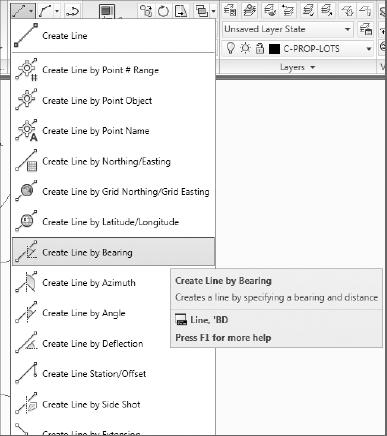
LinesCurves1.dwg, which you can download fromwww.sybex.com/go/introducingcivil3d2010. Note that there are a few lines and curves representing lot lines. There is a lot missing.From the Home tab and Draw panel on the ribbon, select the Create Line by Bearing option as shown in Figure 3.2.
At the
Specify First Point:prompt, use your endpoint osnap to choose the end of the line marked with a red circle.At the
>>Specify quadrant (1–4):prompt, type 1 and then press Enter.At the
>>Specify bearing:prompt, type 14.5755122 and then press Enter.At the
>>Specify distance:prompt, type 3.724 and then press Enter. A short line will be drawn.Press Enter or Escape to exit the command.
The Lines/Curves menu contains an assortment of commands for curve creation. While the resulting curves are simply AutoCAD arc entities, the Create Curves tools provide an interface for data entry that closely matches the way data is presented in a legal description. For example, curves can be created using any meaningful combination of a start point, delta angle, curve length, chord bearing, and several other options that all use surveying language.
The next steps lead you through creating a curve and a reverse curve.
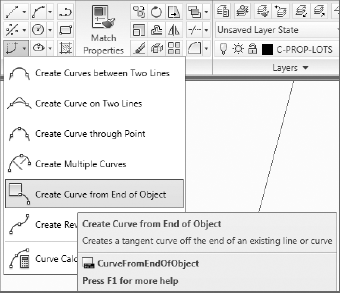
From the Home tab and Draw panel on the ribbon, select the Create Curve from End of Object as shown in Figure 3.3.
At the
Select arc of line object:prompt, choose the line you just drew in the prior exercise.At the
Select entry [Radius/Point] <Radius>:prompt, press Enter to choose Radius.At the
Specify Radius, or [degreeArc/degreeChord]:prompt, type 15 and then press Enter.At the
Select entry [Tangent/Chord/Delta/Length/External/Mid-Ordinate] <Length>:prompt, type D for delta and then press Enter.At the
Specify delta angle:prompt, type 52.011246 and then press Enter. A curve will be drawn to match these specifications, and the command will end. A short report on the curve will also appear in the command line.The next curve builds upon the first curve, but it goes to the left instead of the right. From the same panel, choose the Reverse or Compound Curve from the Curves icon on the Draw panel.
At the
Select arc object:prompt, choose the curve just completed.At the
Select entry [Compound/Reverse} <Compound>:prompt, type R for reverse and then press Enter.At the
Specify Radius, or [degreeArc/degreeChord]:prompt, type 50 and then press Enter.At the
Select entry [Tangent/Chord/Delta/Length/External/Mid-Ordinate] <Length>:prompt, type D for delta and then press Enter.At the
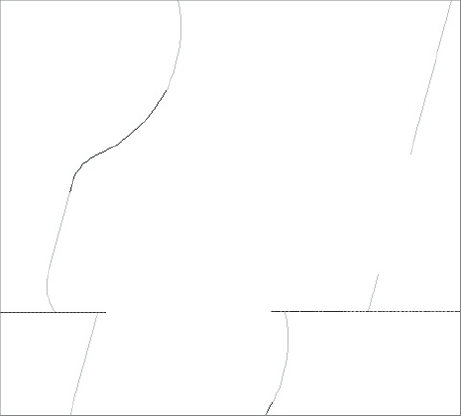
Specify delta angle:prompt, type 40.315213 and then press Enter. A curve will be drawn to match these specifications, and the command will end. A short report on the curve will also appear in the command line. Your drawing should now look like Figure 3.4. As in many real-world deeds, there will be a gap of misclosure between the newly created arc and the existing arc.
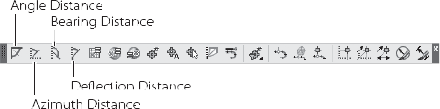
Additional tools to aid with drawing are provided on the Transparent Commands toolbar (Figure 3.5). Transparent commands can be used within any AutoCAD or Civil 3D geometry creation command much like an object snap. If the Transparent Commands toolbar is not on your screen, you can add it to your workspace or refresh the Civil 3D workspace.
For example, if you needed to place an iron pin block at a certain northing and easting, you could use the Northing/Easting transparent command within the Block command (found on the Insert tab and Block panel on the ribbon). If you needed to draw a polyline connecting a series of consecutive point numbers, you would start drawing your polyline and then select the Point Number transparent command. The next few steps lead you through using the Bearing Distance transparent command to create the remaining linework.
From the Home tab and Draw panel on the ribbon, select Create Lines.
At the
Specify first point:prompt, use your endpoint osnap to snap to the end of the 50′ radius curve you just drew.At the
Specify next point or [Undo]:prompt, press the Bearing Distance button on the Transparent Commands toolbar.At the
>>Specify quadrant (1–4):prompt, type 2 and then press Enter.At the
>>Specify bearing:prompt, type 75.0204878 and then press Enter.At the
>>Specify distance:prompt, type 91.002 and then press Enter. The line will be drawn, and the command will continue.At the
>>Specify quadrant (1–4):prompt, type 3 and then press Enter.At the
>>Specify bearing:prompt, type 14.5755122 and then press Enter.At the
>>Specify distance:prompt, type 45 and then press Enter. The line will be drawn, and the command will continue.At the
>>Specify quadrant (1–4):prompt, type 4 and then press Enter.At the
>>Specify bearing:prompt, type 75.0204878 and then press Enter.At the
>>Specify distance:prompt, type 115 and then press Enter. The line will be drawn, and the command will continue. Press Enter twice to exit the command.
The missing lot is completed, as shown in Figure 3.6. As in many real-world deeds, there will be gaps of misclosure between the newly created linework and the existing linework.
Although engineers try to make sure surveying is an exact science, there are often occasions where benchmarks cannot be located or deeds have been lost. An example of this would be a property line of agreement. Two landowners will walk the property with a surveyor and agree on a new property line. They will point out features such as trees or fence posts that they mutually agree are on one property or the other. The surveyor collects these points and uses a combination of hard data and anecdotal information to create a new property line. The Line by Best Fit tool would be useful in this circumstance. Other occasions for using Line (or Arc) by Best Fit might be creating an existing road centerline from survey points and approximating stream centerlines from aerial imagery.
The next exercise leads you through creating a Line by Best Fit for use as a property line for the subdivision.
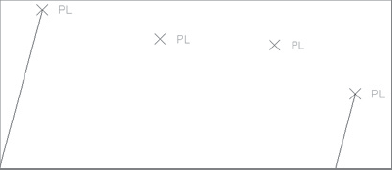
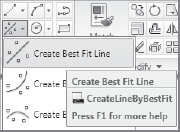
Open the drawing file
LinesCurves1.dwg(or continue working in it if it's already open). Note that there are Civil 3D points along the rear of the northern lots (see Figure 3.7).From the Home tab and Draw panel on the ribbon, select the Create Best Fit icon and Create Best Fit Line as shown in Figure 3.8. The Line by Best Fit dialog appears.
In the Line by Best Fit dialog, confirm that the radio button next to "From Civil 3D points" is selected. Note that you can also choose AutoCAD points, entities, or locations on the screen. Click OK.
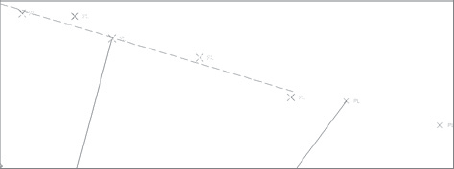
At the
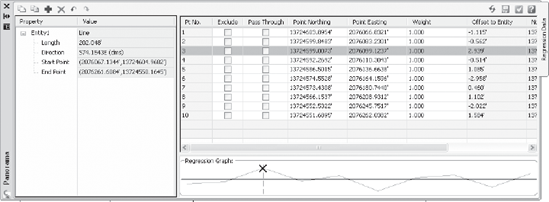
Select point objects or [Numbers/Groups]:prompt, select the 10 Civil 3D points in the drawing. As you select each point, a temporary red, dashed line will appear, marking the proposed line of best fit (see Figure 3.9). After you choose all the points (in any order), press Enter. Panorama is displayed, and the following message appears in the command line:Input data selection completed. See the Regression Data tab in Panorama to accept or modify the calculated data and create the best fit entity.In Panorama, note that you can exclude points, force pass-through points, and choose other options that would refine your line of best fit, as shown in Figure 3.10. Click the green check box in the upper-right corner of Panorama to dismiss this window. The line will be drawn and the command will end.
After deed linework has been drawn, you will often want to label it. Most commonly, you will label your lines with legal information, such as bearing, distance, curve information, and so on. The standard _AutoCAD Civil 3D (Imperial) NCS Extended.dwt template file includes many typical line and curve labels, as well as others that you might not have thought of, such as labels that read the elevations of the line and calculate grade or slope.
The next exercise shows you how to add line and curve labels.
Continue working in
LinesCurves1.dwg.From the Annotate tab and Labels & Tables panel on the ribbon, select Add Labels → Line and Curve → Add Line and Curve Labels. The Add Labels dialog appears.
In the Add Labels dialog, change the Label type to Multiple Segment. Confirm that the Line label style is set to Bearing over Distance and the Curve label style is set to Distance Only, as shown in Figure 3.11. Click Add.
At the
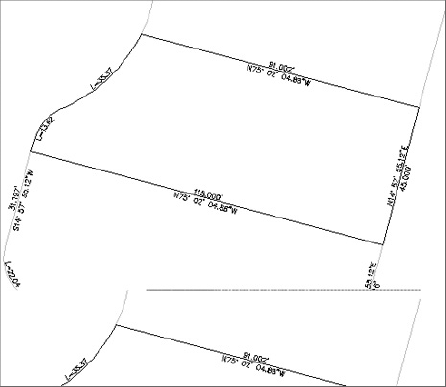
Select Entity:prompt, pick each line and arc in the drawing one at a time. A label will appear at the midpoint of each entity. After you have labeled all of the lines, click Close on the Add Labels dialog. Your result should be similar to Figure 3.12.

Most Civil 3D labels behave much like line and curve labels. They can be moved and dragged using special grips, and they can be edited, changed, and customized. The next exercise will help you build skills for manipulating not only line and curve labels, but also other labels throughout Civil 3D.
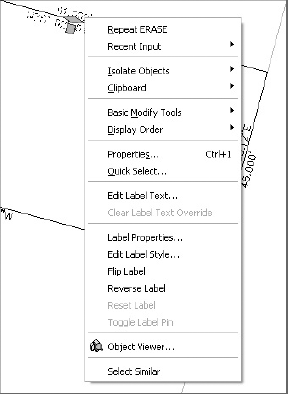
Zoom in on any line label. Select the label and right-click. A context-specific shortcut menu appears (Figure 3.13).
Select Flip Label. Note that the bearing component and distance components are on opposite sides of the line.
Select the label again, and right-click. Select Reverse Label from the shortcut menu. Note that the direction of the label is now reversed. (For example, if it was originally NE, it is now SW.)
There may be times when you accidentally place a label with the wrong style, or perhaps several labels are crowded together. The next few steps show you how to swap the Distance Only curve label for a label that shows distance, radius, and delta angle, and then how to drag the label out of the way.
Zoom in on any curve label. Select the label and right-click. A context-specific shortcut menu appears.
Select Label Properties. The AutoCAD Properties dialog appears.
Make sure you are on the Design tab of the AutoCAD Properties dialog. The lower section represents the Civil 3D properties of the label.
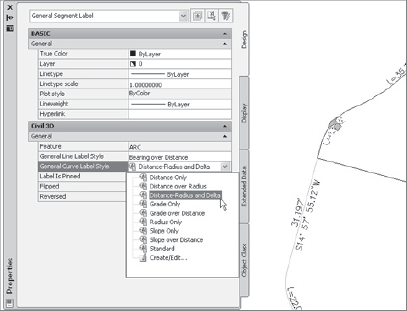
In the lower section, click in the whitespace next to the General Curve Label Style entry. A pull-down menu appears (see Figure 3.14). Choose Distance-Radius and Delta. If you have trouble working with the AutoCAD properties dialog, right-click on the spine of the dialog and disallow Autohide.
Dismiss the Properties dialog, or move it away from the drawing space so that you can see the new label.
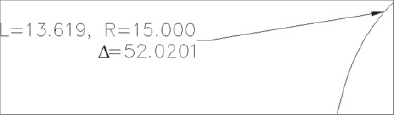
Select the label. Note that there are two grips that appear. Grab the square grip and drag the label off to the side. Note that an arrow appears and the label changes to a stacked formation (Figure 3.15).
Select the label and right-click. Choose the Reset Label option from the shortcut menu. Note that the label returns to its original location along the curve. Clicking the other grip would allow you to move the individual pieces of text within this label.
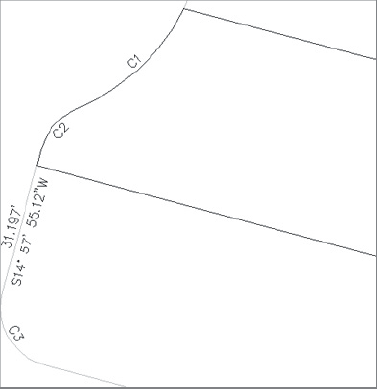
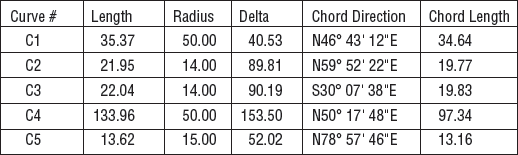
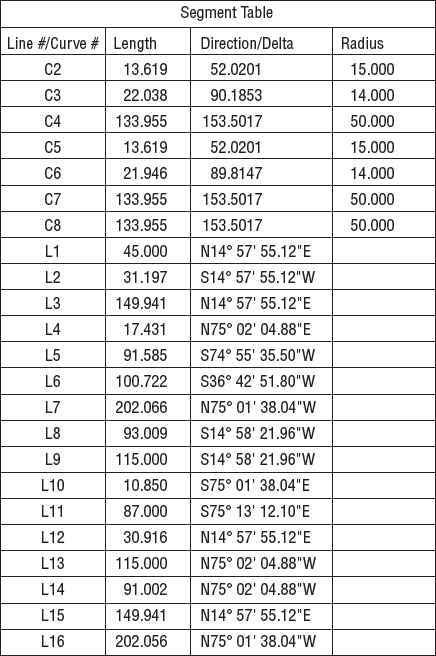
Plans can become cluttered with labels, and there may be times when you want to replace your line or curve labels with numbered tags that are referenced on a table. Figure 3.16 shows a series of curve tags that are referenced on the table shown in Figure 3.17.
In this brief exercise, you'll walk through making the curve table for your sample drawing.
From the Annotate tab and Labels & Tables panel on the ribbon, select Add Tables → Line and Curve → Add Segment Tables. The Table Creation dialog will appear.
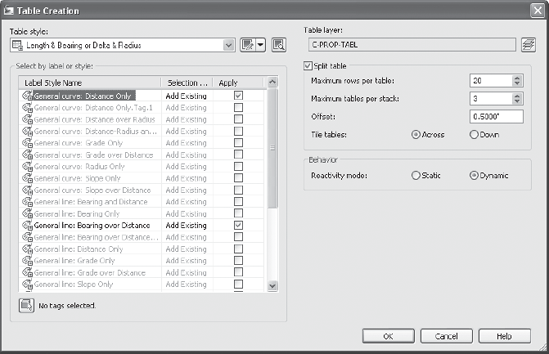
In the Select by Label or Style list, check the General Curve: Distance Only box and the General Line: Bearing Over Distance box, as shown in Figure 3.18. It may be helpful to make the window larger by using the Resize grip (located in lower-right corner of the window). Click OK to dismiss the dialog.
At the
Select upper left corner:prompt, pick a location in the drawing to place your table. The table will appear in the drawing and the command will end. Your result should be similar (but unlikely identical) to Figure 3.19. Also note that your labels have changed from their original form to tag form.
In this chapter, you became familiar with some of the tools available under the Lines/Curves menu. Although AutoCAD lines and arcs are not the most powerful objects you will create in Civil 3D, they often serve as an important foundation for more sophisticated creations, such as parcels, alignments, survey networks, and more. You also saw that lines and curves can be dynamically labeled using Civil 3D tools, and you learned a few ways to manipulate these labels and create tables from them.