
Audience Research in Financial Analysis
While the most obvious uses of audience data are in sales and programming, ratings are also helpful to financial managers and economists who analyze media markets. In effect, media analysts cannot estimate future revenues without estimating future audiences.
The value of the audience commodity should be apparent by now. Audiences are a critical component in the media’s ability to make money, and they frequently determine whether a particular media operator succeeds or fails. As the principal index of the audience commodity, ratings data are often used in day-to-day financial planning, as well as in more theoretical studies of industry economics. In these applications, audience information is used to answer questions that are somewhat different from those posed by advertisers or programmers.
Media owners and managers are most immediately concerned with the financial implications of ratings data. Advertiser-supported media are in business to make a profit, and in order to do that they try to minimize their expenses while maximizing their revenues. We have already seen how the profit motive affects programming decisions. But business expenses also include salaries, servicing the firm’s debt, and a host of mundane budget items. Reducing these expenses boosts profit, but there is a limit to how much cost cutting can be done. The only other way to improve profitability is to increase revenues.
For commercial media, increasing revenues generally implies increasing income from advertising sales. Broadcast stations generate virtually all of their revenues from time sales. In radio, the majority of this income is generated from local advertisers; in television, the split between local and national spot revenue varies. Some stations, especially those in large markets, might get roughly equal amounts of revenue from each source, while others depend more heavily on local advertising than on national spot. Networks also depend heavily on advertising revenues, although cable networks typically derive additional income through direct payments from cable systems. And program syndicators can realize substantial revenues from selling barter time to national advertisers.
The financial analysis of media markets concerns people who work for media companies as well as those not directly involved in buying and selling audiences. Media organizations generally have separate finance departments to conduct ongoing analysis for planning, monitoring, and evaluating business decisions. These analysts rely heavily on the expertise of their research departments to evaluate and predict ratings. Wall Street analysts project the financial health of media firms in order to evaluate investments. Trade organizations, such as the National Association of Broadcasters (NAB), the National Cable & Telecommunications Association (NCTA), and the Internet Advertising Bureau (IAB), conduct financial analyses to assess the economic health of their industries and to lobby on behalf of their clients. Economists from industry and academia study the characteristics of economic transactions in media markets. And policy organizations like the FCC conduct financial analyses to determine the impact of their policies on the marketplace.
We consider first the more applied questions characteristic of corporate financial managers. Our goal is not to explain financial management in detail, as that is done elsewhere (e.g., Albarran, 2012, 2010), but rather to show the critical importance of audience ratings in financial planning. Of course, specific processes and procedures vary across firms and even within departments at a given company. We are more concerned with the factors that remain more or less constant across organizations so that the reader can focus on the concepts rather than the formats of particular analyses.
Within media organizations, financial analysis cuts across all functional areas. For example, the sales department projects advertising revenue and sets prices for advertising time, while the programming department analyzes the costs and income potential of programs. Both groups have to work together because decisions made in one department affect decisions in the other. However, each contributes a very different expertise and often a different set of priorities. A finance department will typically use information from all areas of the organization to generate its own analyses and financial projections. If the organization is part of a group, as is occurring more and more with widespread consolidation in the radio and television industries, a corporate finance department affects the process. We will say more about the effects of consolidation on financial planning later in the chapter.
The quantitative reports from services such as Nielsen and Arbitron offer financial analysts the most important audience data. The reason is straightforward—ratings provide an index to revenues. While the correlation is not perfect, the ratings represent an excellent predictor of advertising income. In fact, although financial analysts may use audience data in different ways, they need the same understanding of ratings as do programmers and sales managers.
There are, of course, dozens of questions related to finance that can be asked of ratings data. We concentrate on broad questions that illustrate their use in assessing the ongoing economic activity of the firm, planning expenditures, determining the value of media firms, and specifying the relationship between audiences and revenues.
How Effectively Does the Organization Compete for Market Revenues?
Monitoring the financial performance of an organization requires ongoing analysis of both the sales effort and market conditions. In its simplest form, this analysis involves comparing revenues earned with the potential revenues available in the marketplace. Because revenues are heavily determined by audience size and composition, a station’s share of market revenue should reflect its share of audience. A statistic called the power ratio (also called the conversion ratio) expresses this relationship. The calculation is very simple:
![]()
This calculation estimates the percent of revenue your station earns for every audience share point. Audience share information, which comes from ratings services, is readily available to Nielsen and Arbitron subscribers. The revenue part of the equation is more problematic. A media firm knows its own sales figures, obviously, but would not ordinarily have access to data from competing organizations. There are organizations that routinely collect this information, such as Kantar Media or Nielsen Monitor-Plus, but such data are subject to error. Usually these services rely on self-reports of prices based on the word of buyers and salespeople. Both groups have an incentive to give false information. Sellers would want to estimate the highest prices possible so that their clients would not think that they overpaid, and buyers would want to estimate the lowest prices possible so that they would not appear to have made bad deals. Consequently, such data have serious limitations in terms of estimating total market revenues.
This problem has been addressed in some media markets by independent auditing firms that conduct confidential market share analyses. These firms collect sales data directly from media clients and report those figures in monthly, quarterly, or yearly reports. These reports are available only to the clients who take part in the analysis. Usually the organizations that subscribe to the services find out only the overall market revenue and their own share of that revenue, although in some markets they have access to competitors’ data as well. Table 9.1 shows the kind of information that typically appears in a broadcast market-share report.
TABLE 9.1
Radio Revenue Report (in US$ thousands)
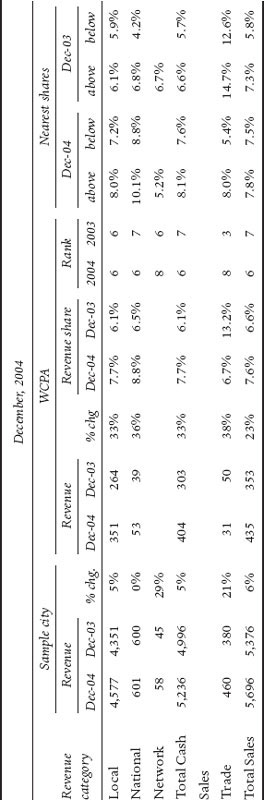
Source: Adapted from sample report provided in Hungerford, Aldrin, Nichols, and Carter, The Hungerford Radio Revenue Report: Users Guide. Reprinted by permission of Hungerford, Aldrin, Nichols, & Carter, P.C., CPAs and Consultants.
In the sample city’s local market, the total radio advertising revenue in December was $4,577,000. Of that total, $351,000 went to the hypothetical radio station WCPA—a figure representing 7.7 percent of the market’s radio advertising during the month. The next highest share of revenue was 8.0 percent, and the next lowest was 7.2 percent (note that the stations garnering those shares are not identified). WCPA can calculate its power ratio with this information. If Arbitron shows an audience share of 7 percent, for example, then WCPA’s power ratio is 1:1. This means that the station earns 1.1 percent of total advertising revenue for every 1 percent of audience share. Generally the Arbitron shares are adjusted to reflect share of audience only among those stations that report revenue figures. The value of this system is that it allows the media to evaluate their sales effort without compromising proprietary information.
The power ratio can be calculated on the basis of any demographic. If a radio station format were designed to appeal to men aged 18 to 49, then the sales department would want to know its share against that group. The statistic can also be calculated on any daypart for which information is provided by the auditing firm. However, the conversion ratio by itself conveys very little information. Analysts also look at trends in the daypart to find out whether the share of revenue is increasing or decreasing and determine whether this is a result of audience share differences or changes in overall sales revenue. Results must also be compared with historical data on the performance of particular formats in a market, because different formats can be expected to garner different shares of sales revenue.
What Is the Value of a Programming Investment?
After its investment in personnel, a broadcast station’s largest cost item is generally programming. Each program purchase is evaluated according to its potential to generate revenue for the station. Analysts must determine how much money the programs will earn for the station and how much revenue will be lost by displacing other programs from the schedule. This may involve fairly straightforward analysis of costs and revenues, or it could involve complex analysis of properties such as sports rights.
Several factors determine the balance of costs and benefits in a program purchase decision. In general, these include the license fee that the seller is asking, the amount of time available for local advertising sales, the likely price that spots in a program will command in the advertising marketplace, the opportunity cost of purchasing the program, and the revenue that the program is likely to generate over the life of the contract. Because programs are often purchased 3 or 4 years before stations can air them, analysts need to generate planning estimates for 3 to 5 years into the future. The information needed to conduct this analysis requires input from several departments in the organization.
When a program property becomes available, financial decision makers put together a pre-buy analysis. Although the format will differ from organization to organization, the information needed is essentially the same. One of the most important elements in the revenue projection is the estimated audience the program will attract. As we noted in chapter 5, predicting an audience is both art and science, involving historical data as well as experienced judgment. The historical data are in the form of ratings.
In the case of an off-network syndicated television program, for example, analysts are interested in how a program performed in its original run on the network. The national ratings indicate its popularity and the composition of its audience. However, a program might have earned poor ratings nationally but perform well in an individual market. Several factors explain this difference. The show might have a distinct cultural appeal in certain parts of the country, or it might simply have been carried on stronger stations in some markets than in others. The difference could also be attributable to different demographic profiles of potential audiences across DMAs. Whatever the reasons, analysts must take local market characteristics and preferences into account when they project program ratings.
Analysts are able to study the performance of programs in previous syndication runs because some syndicated programs are sold for two or more cycles. If a program is being considered in its second cycle, the ratings earned in its first cycle would be of major importance. Using syndication ratings sources, analysts could compare how the program did in its original network run with how it performed in syndication. They could use this information to predict how it might do a third time around.
Analysts might also look at ratings for programs that are similar in content to the one being evaluated. This strategy is especially important in cases like first-run syndication, where there are no historical track records to consult. If analysts assume the program will attract audiences similar to others of its type, they can project ratings based on those audiences. The savvy user of audience data will, of course, consider not only program content but also the scheduling patterns of those programs.
Predicted rating also depends on the place in a schedule that the program is likely to occupy. Competition varies by daypart, by season, and by day of the week. Also, as we explain in chapter 4, time periods command different levels of available audience, so ratings vary considerably across dayparts. Programmers consider all of this when they decide on a schedule; financial analysts factor the information into their revenue calculations.
Some large media organizations may have all the resources in-house to make these kinds of predictions, but most firms will rely on information supplied by services such as rep firms. Programmers at rep firms may even be involved in program purchase decisions, helping programmers and general managers evaluate and negotiate deals. More often, they serve a consulting role, providing ratings information that they collect for their clients. They can share not only the ratings data but also the experience gained in various markets. This expertise can be very valuable to financial planners.
Revenue projections also take into consideration the number of spots available for sale in a given program. This availability depends on the program length and on commitments to other uses for those spots. A barter program, for example, will have less time available for local sale than a syndicated program purchased with cash. Stations might also reserve spots for promotional announcements, making this inventory unavailable to the sales staff. These variables affect the number of units sold to advertisers, and thus the revenue generated from time sales.
Just as researchers use historical ratings information and experience to project the likely audience for a program, salespeople use historical data and their firsthand knowledge of market conditions to estimate a cost per point (CPP) that the program will earn. The way a program is scheduled will have a significant effect on the prices that the advertising sales staff can charge. Even if a program is projected to earn a very high rating, it cannot be sold at a prime-time cost per point if it is scheduled in late fringe.
Table 9.2 illustrates a sample pre-buy analysis for a fictitious program called Family Time. Due to space constraints, the table covers only the first 3 years of a 6-year analysis, but it is sufficient to illustrate many of the factors we have discussed. The first columns give information about the season and likely scheduling patterns. Programmers determined that Family Time should start in early fringe, probably maintaining that time slot for the first few years. Subsequent columns report estimates that affect quarterly revenue projections.
Working with other departments at the station, financial analysts estimate the ratings that the program will achieve, the likely price it will command in the advertising marketplace, and the predicted sell-out percentage (percentage of available advertising time sold). In this case they estimated that the program would get a 6.0 household rating in the first year when it airs at 5:30 P.M. In the second and third years of the contract the rating drops to 5.0, and by the end of the year 2007 the program is projected to earn a 4.0. This drop in projected ratings is based on the assumption that some of the available audience has already seen the series, and that competing stations might offer more recent or otherwise more attractive programming. Although the data are not shown in Table 9.2, programmers plan to move Family Time to the early afternoon toward the end of the contract, which brings the estimated audience down to a 3.0.
The cost per point varies by quarter, and the cost per spot (also called average unit rate) varies according to the estimated rating and the CPP. These figures represent the value that salespeople think the program has in the marketplace. Sellers offered the program on a cash-plus-barter basis, asking for 1 minute of barter time for the first 2 years of the contract. Note that the station is selling 11 avails through the third quarter of 2012, when it regains the minute of barter time it gave to the syndicator as part of the original contract. The station estimates that 95 percent of the available spots will be sold during the first 2 years of its run, dropping to 90 percent in year 3. The last column, net revenue, is calculated by combining the advertising cost and sell-out information with the total number of times the program is aired.
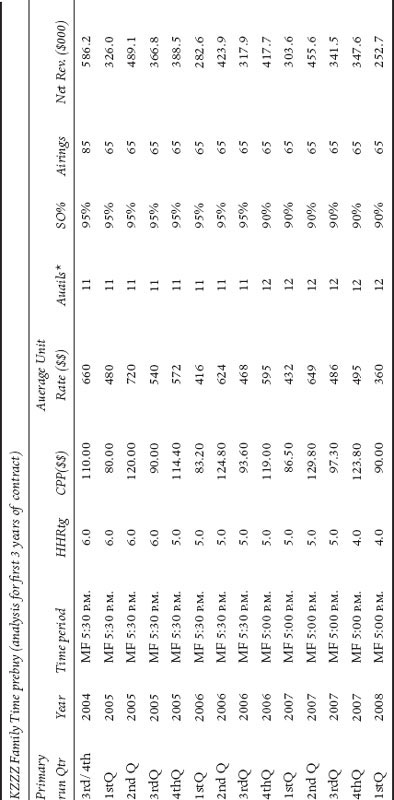
*Avails = Gross avails-barter-promos (one spot is reserved for promotional announcements in this program). This analysis assumes a 4% annual growth rate. This is reflected in the Cost Per Point.
This analysis is completed, quarter by quarter, for the life of the contract. Financial analysts projected that Family Time would generate close to $7.1 million in revenue, while costing the station only about $1.6 million in license fees. This means that the program would make a profit of $5.5 million over its 6-year contract—attractive, but highly unlikely in the real world. Most programs are likely to show a much smaller margin of profit.
The revenue that a program will generate is only part of the financial calculation. Analysts also need to consider the alternative uses of airtime, and whether these alternatives would be more profitable for the station. Perhaps a different program scheduled in the same time slot would sell at a higher cost per point. Or a program with more local avails would be more profitable than an all-barter program. The question that has to be answered in each instance is whether the benefits of acquiring a property justify the lost revenue from other options. Another way of phrasing this is that financial planners must consider the opportunity cost of scheduling one program instead of another. This consideration affects all levels of the analysis.
Another factor in assessing the costs and benefits of acquiring a program is its effect on the rest of the schedule. High-profile programs, such as popular off-network dramas or major sporting events, might attract new viewers and create promotional opportunities to build audiences for other parts of the schedule. They could provide large lead-in audiences to locally produced programs, such as news. Or the schedule might benefit from a halo effect that brings viewers to the channel. Higher ratings for these other programs would translate into higher revenues overall.
There is no standard threshold that determines whether a program is acquired after the pre-buy analysis. Different types of programs have vastly different profit margins. In the off-network syndication market, for example, a blockbuster program often earns less for the station in direct advertiser revenue because so much of the advertising time is given up for national barter. But, for the image reasons listed previously, the program could be an excellent asset. Other shows might be projected to attract comparatively small audiences but with the sale of all local availabilities would generate higher profits. Usually, financial managers and programmers will seek a mix of both kinds of shows.
Sports-rights deals require a more complex analysis than regular programs or series. They also require, in the opinion of some industry professionals, more “instinct.” Deal structures vary widely, from a team purchasing a 3-hour block from a station and selling the time themselves to deals that share production costs and leave the media organization to sell the time. Arrangements such as revenue sharing are not uncommon. This means that the same types of questions are asked about ratings predictions and opportunity costs, but there are additional considerations specific to the sports property. One complicating factor is that the times and lengths of games often fluctuate from week to week. This means that the regular schedule will be interrupted in inconsistent ways, which could drive regular viewers from the channel. It also means that advertisers in these regular programs might be bumped if a game goes late, and this has repercussions for the way the time is sold. However, while the analysis will differ based on the proposed terms of the deal, the basic question remains the same: What can I earn with one option compared with another? We have seen that the likely audience each option will attract is a key factor in assessing whether the balance of revenue lost and gained is in the organization’s favor.
We noted earlier that group ownership affects financial planning at local media organizations. The corporate culture of a group owner, as well as its long-term image goals, is likely to affect decision making at the station level. Stations that used to function on their own before the consolidation of ownership might be subject to corporate approval in decisions such as program purchases. For example, a station might determine, based on a pre-buy analysis, that a sports programming opportunity is not in the best interests of the local sales effort. This decision would not be in the best interests of a group owner that wanted to create a national image as a “sports broadcaster.” The national goals of the company would have to figure into the cost/benefit calculation made by the individual station.
Consolidation of businesses might also mean consolidation of financial expertise. As corporate financial analysts gain experience across many different markets, they can incorporate that knowledge into pre-buy analyses for individual group-owned outlets. Ordinarily, a smaller organization that is unaffiliated with a media group would not have access to this kind of expertise on a regular basis. In any case, group ownership means that program acquisition decisions are no longer made in isolation. Financial analysts at the newly acquired company might be accountable to financial managers at the corporate office. Program purchase decisions may require corporate approval or, in some instances, come from corporate programmers to the local stations as a fait accompli.
The results of financial analyses are used by program directors and general managers when they negotiate deals. The information gives them an indication of reasonable program prices and the highest price they should be willing to pay. It also helps them negotiate specific terms, such as the amount of barter time given to the syndicator. Because the value that local television stations attach to a spot could be very different than the value syndicators assess, stations might want to keep more time for local advertising sales. We should note that this example is hypothetical. Buyers in most markets do not have the option to negotiate the amount of barter time, although some of the smaller markets can still do this.
Although all departments have to cooperate in financial analysis, there is frequently tension among them. Agendas and priorities differ significantly. For example, the program director wants to build an audience over the course of a day, while the sales account executive wants inventory to sell potential clients. These programs may or may not fit the program director’s strategies. From time to time a programmer may decide to preempt regular programming to cover a particularly important news event. This creates problems for the sales staff. If regular programs are continually preempted, then advertisers need make-good spots to compensate for lost audiences. The finance department is likely to be aware of all these priorities but has to remain focused on bottom-line considerations that benefit the company as a whole.
We have centered this discussion on the acquisition of syndicated programs, but the same principles apply to program production and distribution decisions. Before producing a 1-hour first-run syndication program, for example, the production company would have to look at audience information for similar 1-hour shows. They would estimate the clearance that they would be able to achieve and the likely audience shares they would garner. The supply of similar programming would also be a consideration, because supply and demand affects prices in both the program and advertising markets. Syndicators develop detailed projections to estimate the net profit or loss they can expect from a new program. This involves predicting ratings in all markets, the average cost per thousand that advertisers will pay, and the likely revenue from license fees. Analysts also factor in the estimated cost of promotion efforts and publicity as well as agency commissions and other expenses.
This type of analysis also takes place with the introduction or change of locally produced programs. For example, a station might want to add a half-hour of local news. Financial analysts would look at other markets or similar stations to determine the profitability of expanding news operations. They would have to predict the audience for a new schedule, and determine whether the benefits justify a potential loss of viewers.
In order to assess the accuracy of the financial planning process, financial analysts may conduct a post-buy analysis after a program runs. The process is similar to the one described in chapter 5 for advertising post-buys. Basically, the planning procedure is repeated after the “real” data are collected, and the results are compared with the predictions prior to investment. If any significant discrepancies are found, further analysis identifies whether the error was due to faulty audience projections, unforeseen changes in viewing patterns or market conditions, or lower than expected advertising rates.
We have used syndication to explain the factors involved in projecting and evaluating program revenues. A similar process takes place at cable and broadcast networks; managers need to know the contribution to revenue made by each program in their schedule. Finance analysts work with their research departments to estimate ratings, cost per thousand, and the number of spots that will be sold to advertisers. In this calculation, they factor in the number of times a program will run and they deduct the ad agency commission to reflect net income from ad sales. In the case of networks with owned and operated stations, analysts do the same kind of calculation to estimate the revenue each program will earn for local stations.
What Is the Value of a Media Property?
Many media companies are publicly traded, meaning that individual or institutional investors can go to a stock exchange and buy shares in the company. Just as investors would study the prospects of any potential acquisition, a thorough financial analysis is critical for decisions involving media concerns. This is likely to include an inspection of a company’s ratings performance—past, present, and future. Even if shares in a media company are not traded on exchanges, investors can buy properties directly. Stations are brokered much like houses. Here again, investors must determine whether the property to be acquired will generate sufficient revenues to make the acquisition worthwhile. Projecting audience ratings is a critical element in making those judgments.
Financial analysts also recognize that, although audiences are an important determinant of media revenues, there may well be some discrepancy between a media property’s share of the audience and its share of market revenues. They must consider many other factors. This can have practical implications for evaluating the desirability of different acquisitions. Table 9.3 illustrates how a financial analyst might go about evaluating the long-term revenue potential of a television station.
TABLE 9.3
Station Revenues Based on Audience Share Projections
| 2004 | 2005 | 2006 | Maturity | |
Net market revenue |
$70 million |
$74 million |
$80 million |
X |
Station audience share |
21% |
22% |
23% |
25% |
Over/under sell factor |
0.80 |
0.83 |
0.86 |
0.90 |
Station revenue share |
16.80% |
18.30% |
19.80% |
22.50% |
| Station revenue | $11,760 million | $13,540 million | $15,840 million | X(.225) |
The top line across the table represents the net market revenue for all television stations in the market. This number is likely to be a function of the overall market economy, especially the annual volume of retail sales. It is estimated by looking at historical trends in the market, and making some carefully considered judgments about the economic outlook for those sectors of the economy that are especially important. The second line represents the station’s current and estimated share of the television audience. Here again, the analyst would consider recent trends and the chances that the station’s overall ratings performance will improve or decline. As we saw in chapter 4, there are many factors that affect a station’s ability to attract an audience. In this particular example, the analyst estimated that the station would eventually be able to attract and hold 25 percent of the audience.
But this does not necessarily mean that the station can expect to capture 25 percent of total market revenues. In fact, this station has regularly commanded a smaller share of market revenues than its share of the audience. In other words, it undersells its audience share. That factor is recognized in the third line across the table. The analyst believed that the undersell factor could be improved, but to be conservative, projected that share of revenue would always fall short of audience share.
Once these factors have been estimated, it is possible to make a reasonable projection of station revenues. When these revenue estimates are compared with projected operating expenses, the analyst can determine whether this property would have sufficient cash flow to cover its debt, and provide the owners with an acceptable return on their investments.
Another way ratings are used to estimate the value of a media property is in negotiations for retransmission consent. Broadcast stations have the legal right to either allow cable systems to carry (retransmit) their over-the-air signal for free in the local market or to charge the system a fee for the right to do so. Broadcasters argue that they bring larger audiences to cable systems than many of the program services cable operators pay a premium to carry. ESPN, for example, charges about $5.00 per subscriber; local market television stations are generally paid less than a $1.00 per subscriber. Broadcasters argue that higher ratings should mean higher retransmission fees.
Disagreements between cable/satellite distributors and local television stations can threaten audiences with the loss of popular programming. In 2012, Gannett Co. demanded significantly higher retransmission fees from Dish Network to carry its 19 local stations. Gannett also demanded that the network disable AutoHop, a DVR feature that allowed viewers to automatically skip commercials. This was one of dozens of high-profile retransmission stalemates that year. While most were settled in a reasonable timeframe before the threatened “blackout” of stations, the terms of these deals were not generally made public. Industry researcher SNL Kagan estimates, however, that broadcast retransmission fees will grow from just over 7 percent of all carriage fees paid by cable systems in 2012 to 10.7 percent of the total in 2015 (W. Friedman, 2012).
What Determines the Value of an Audience?
While the station’s salespeople and financial analysts are very good at reading market signals, they may not be as concerned with quantifying the more abstract determinants of economic value. We have noted that, under a system of advertiser-supported media, audiences are really a commodity. They are bought and sold just like other commodities. They are “perishable,” and their supply is unpredictable—but that hardly distinguishes them from other goods in the marketplace. Analysts have tried to figure out what determines their value, just as they do with other commodities. Knowing the determinants of a commodity’s price is certainly of practical value to those who do the buying and selling, but it can also help us understand the operation of media industries.
The economic value of an audience is largely determined by supply and demand. Corporations and other organizations demand advertising time, and the media supply it. Generally speaking, when the U.S. economy is strong, and corporate profits are high, demand increases and advertising expenditures rise. While such macroeconomic variables establish an overall framework for prices, a number of factors operate within that framework to determine the value of specific audiences.
On the demand side, some companies cannot curtail their advertising expenditures as easily as others. For instance, the makers of many nondurable goods, like soft drinks, cosmetics, and fast foods, fear significant losses in market share if they stop advertising. Consequently, they may continue to advertise heavily, even if times are hard. Local merchants, on the other hand, will quite often cut advertising budgets to reduce expenses. For these reasons, during an economic downturn, local advertising markets may “soften” more readily than national markets, driving down the price of local audiences.
We have already noted that different advertisers demand different sorts of audiences, and that this interest in market segmentation has had a marked effect on the ratings. Audiences are routinely categorized by their demographic and geographic attributes. Increasingly, they are segmented by psychographics and product-purchasing behavior. Not all audience segments, however, are as easily supplied as others. Some kinds of people spend more time in the audience, and are therefore more readily available to advertisers. Other kinds of people constitute a tiny part of the population (e.g., executives earning more than $500,000) and are, therefore, rare. This tends to make them a more valuable commodity.
All these aspects of supply and demand come into play when determining the value of an audience. Ultimately, such factors are represented in cost calculations (e.g., CPMs) for the electronic media. In fact, advertisers will sometimes make trade-offs between print and electronic media based on the relative cost of audiences. Table 9.4 summarizes recent CPMs for the major advertiser-supported media in several countries. Keep in mind that these figures are averages for an entire year; as such they give a very general estimate of CPMs. Although such contrasts can be an apples and oranges comparison, the price of competing media is another factor that determines the market value of a television or radio audience. This is especially true in local advertising where newspapers can provide stiff competition for the electronic media.
TABLE 9.4
Average CPM US$ (Adults) in Selected Countriesa
| Television | Radio | Newspapers | Magazines | |
Syria |
155.60 |
6.6 |
2.8 |
6.6 |
Lebanon |
86.20 |
0.17 |
43.9 |
9.9 |
Argentina |
69.7 |
0.7 |
15.5 |
9.2 |
Panama |
48.6 |
3.1 |
13.4 |
11.9 |
Portugal |
33.0 |
4.7 |
22.6 |
32.9 |
Hong Kong |
32.2 |
1.8 |
22.4 |
32.1 |
Singapore |
28.4 |
1.0 |
9.4 |
22.6 |
Australia |
26.4 |
9.6 |
37.2 |
23.2 |
Belgium |
22.5 |
9.2 |
(color) 61.1 |
19.6 |
Spain |
21.8 |
12.2 |
28.4 |
28.3 |
Czech Republic |
19.6 |
4.1 |
41.6 |
37.9 |
USA |
19.5 |
N/A |
71.4 |
15.4 |
Mexico |
19.2 |
0.1 |
82.4 |
86.3 |
Romania |
17.8 |
17.1 |
11.2 |
24.5 |
China |
17.1 |
8.2 |
9.6 |
11.4 |
Italy |
15.9 |
3.9 |
135.5 |
43.7 |
Philippines |
15.3 |
N/A |
4.0 |
27.9 |
Canada |
15.0 |
10.9 |
74.6 |
14 |
Taiwan |
11.9 |
N/A |
8.9 |
13.5 |
France |
10.3 |
16.1 |
58.8 |
12.7 |
Sweden |
10.3 |
N/A |
57.9 |
23.5 |
Vietnam |
10.3 |
N/A |
2.2 |
3.1 |
Ireland |
8.3 |
6.1 |
58.3 |
41.6 |
U.K. |
7.2 |
3.0 |
18.2 |
22.0 |
South Korea |
7.1 |
2.1 |
29.2 |
12.4 |
Russia |
6.6 |
3.7 |
2.1 |
9.7 |
Lithuania |
4.3 |
2.0 |
18.3 |
12.2 |
Kazakhstan |
4.1 |
0.7 |
33.1 |
55.5 |
Bulgaria |
3.9 |
5.8 |
13.0 |
N/A |
Greece |
3.3 |
8.3 |
39.9 |
30.4 |
Indonesia |
2.8 |
0.2 |
24.1 |
13.7 |
Turkey |
2.1 |
0.1 |
9.1 |
28.7 |
Poland |
1.3 |
1.2 |
19.1 |
14.5 |
Jordan |
1.1 |
1.2 |
12.1 |
70.9 |
| Brazil | N/A | 5.7 | 181.1 | 106 |
a Television, 30-second peak time; newspaper, B/W; magazine, color.
N/A, not available in this report.
Source: ZenithOptimedia Market and MediaFact Reports 2011 Edition.
Table 9.4 indicates the ways different countries vary in the relative costs of advertising across media. The reasons for these differences include the size of each market, the ownership of media organizations, historical development of print and electronic media, the availability of technologies in homes, and supply relative to demand for each form of communication. In some countries, Taiwan and Romania, for example, advertisers pay comparable prices to reach consumers through print and broadcast. In others, like Argentina, Canada, Lebanon, and Syria, the discrepancies are quite large—and the differences are not consistent country to country.
What Contribution Do Ratings Make to Revenues?
The preceding discussion runs the risk of suggesting that audiences have some inherent value that translates directly into revenues. A number of factors can account for the fact that there is not a lock-step relationship between audience size and revenues. These may be of considerable importance to both economic and financial analysts.
The first thing to remember is that audiences of the electronic media are, themselves, invisible. The only index of this commodity is ratings data—an estimate of who is probably out there. In a very real sense, rating points, not audiences are bought and sold. As long as such audience estimates are the only way to know the size and shape of the audience, they effectively become that commodity. Although ratings companies are under considerable pressure to produce accurate audience measurements, certain biases and limitations do exist. Some may be inherent in research methods; others reflect the way ratings businesses have responded to marketplace demands. In any event, the media must generally operate within the constraints imposed by the ratings, and that may be a hindrance to selling certain audiences. In effect, the ratings data themselves can distort the link between audience size and audience revenues.
For example, we have noted that cable has gradually eroded the audience for broadcast television. The cable industry, however, has had some difficulty marketing that audience because historically the ratings business has been geared to estimating broadcast audiences. With the introduction of the peoplemeter, and their expansion into many local U.S. markets, Nielsen is now in a better position to provide cable ratings. The shifts in share of revenue illustrate how that change has affected the placement of advertising. Table 9.5 shows how advertising expenditures have changed over the years. While radio’s share of revenue has remained fairly steady since the early 1980s, cable has claimed an increasing share at the expense of broadcast television. Once Internet became a viable advertising medium, ad revenues for radio and broadcast television dropped, and the growth of cable advertising slowed.
TABLE 9.5
Share of Total Television/Radio Advertising Revenuea
| Radio | Broadcast TV | Cable TV | Internet | |
1950 |
73% |
27% |
0% |
|
1960 |
29% |
51% |
0% |
|
1970 |
26% |
74% |
0% |
|
1980 |
24% |
75% |
1% |
|
1990 |
23% |
70% |
7% |
|
2000 |
23% |
51% |
17% |
9% |
2010 |
14% |
40% |
23% |
23% |
| 2011 | 13% | 38% | 23% | 26% |
Source: Based on advertising revenue estimates provided by the Radio Advertising Bureau, Television Bureau of Advertising, Cabletelevision Advertising Bureau, and Interactive Advertising Bureau.
The second thing to remember is that audiences are made available to advertisers in the form of spot announcements, and these spots are limited in number. A broadcaster could exhaust the inventory of available spots before meeting the demand for audiences. If demand is high early in the buying season, and broadcasters sell out, then even those advertisers who would pay a premium to reach the intended audiences would be unable to purchase spots. The result is that some audience revenues would go unrealized.
The amount of advertising time sold by electronic media is affected by several factors. By tradition, certain dayparts have more commercials than others. Prime time, for instance, has fewer spot announcements than late night or daytime television. The type of station also affects the amount of commercial inventory. Network affiliates have less time to sell to local advertisers than independents, because network programming reduces the size of their inventories. Inventories can be increased by adding commercial time to a program or reducing the duration of spots (e.g., from 30 to 15 seconds), but like cost cutting, there is a practical limit to how much can be done without being counterproductive. Indeed, broadcasters sometimes argue about how much commercial time can be sold within each hour before listeners might be driven away to another station. Stations frequently try to lure listeners to a new, or revised, format by presenting very few commercials or guaranteeing X commercial-free minutes.
Even if ratings data were completely accurate and inventories more flexible, audiences are not the only factor in determining revenues. A sales force must take audience data into the marketplace and persuade advertisers to buy the commodity. Selling is a very human, and often imperfect, process. Some sales managers are more aggressive than others in their approach to time buyers. Some salespeople are more effective than others in dealing with clients. In addition, no two advertisers are alike. Some, for example, may purchase heavy schedules early in the season and routinely receive quantity discounts. The net result is that two audiences that seem to be identical may sell for different amounts of money.
Economists have devoted a good deal of attention to the relationship between audience ratings and audience revenues. In addition to the factors we have already described, there are other, less benign, explanations for a discrepancy between an audience’s size and its market value. If, for instance, there are relatively few competitors in a market, they may be tempted to collude and set prices above competitive levels. Although we know of no cases of such collusion, the potential exists. What is clear, however, is that demand does affect price. Advertiser demand for television has been, and will probably remain, high. This has meant higher rates (proportional to the audience delivered) in markets with fewer stations. In less concentrated markets, the cost of audiences tends to be lower, but studies of this sort have not been conclusive.
Albarran, A. (2012). Management of electronic and digital media (5th ed.). Belmont, CA: Wadsworth.
Albarran, A. (2010). The media economy. New York: Routledge.
Alexander, A., Owers, J., Carveth, R., Hollifield, C. A., & Greco, A. (Eds.). (2004). Media economics: Theory and practice (3rd ed.). Mahwah, NJ: Lawrence Erlbaum Associates.
Napoli, P. M. (2003). Audience economics: Media institutions and the audience marketplace. New York: Columbia University Press.
Owen, B. M., & Wildman, S. S. (1992). Video economics. Cambridge, MA: Harvard University Press.
Picard, R. G. (2011). The economics and financing of media companies (2nd ed.). New York: Fordham University Press.
Turow, J. (2012). The daily you: How the new advertising industry is defining your identity and your worth. New Haven: Yale University Press.
Veronis Suhler Stevenson. (2012). Communications industry forecast and report. New York: Author.
Vogel, H. L. (2011). Entertainment industry economics: A guide for financial analysis (8th ed.). Cambridge: Cambridge University Press.