
Understanding Audience Behavior
Audience measurement comes in many different forms and has a wide variety of applications. The wealth of data can be a bit overwhelming. How does one harness all that information to answer questions about the audience? For example, what factors influence media choices? Why are some things popular and others are not? What variables trigger audience loyalties? What are unusual or important features of media use and what are routine? In this chapter, we offer a framework for addressing such questions. Our emphasis is on generalizable concepts and theories. Our goal is to help readers understand the forces that shape and predict audience behavior. The best forms of audience analytics are grounded in that understanding.
The chapter is divided into four sections. First, we take a closer look at just what an analyst is typically trying to assess—exposure to media. We categorize and discuss the principal measurements of audience behavior. Second, we review the most common theories for explaining people’s media choices. These rely heavily on people’s preferences to explain what the audience is doing. Third, we introduce a number of other factors that are critical in understanding audience formation. Finally, we present a model of audience behavior that reflects all of these considerations and offers a more complete way to understand exposure to media. This is the key to interpreting audience information.
It is best to begin this exercise by reminding ourselves of the central focus of audience measurement. The information collected by research firms may be vast in size and reported in a great many ways, but conceptually it is rather straightforward. At their core, most databases are simply a record of people’s exposure to media. A record that is typically inferred from people’s media choices (e.g., channel or program selections, page requests, etc.). As we noted in chapter 3, meters and servers collect a continuous stream of such behaviors but often not much else. The data do not say much about the effects of exposure. They usually do not explain people’s motivations or levels of engagement, although social media are beginning to fill that void. An analyst, then, typically has a mountain of data on individual patterns of media consumption through time, accompanied by a modest amount of information about the traits of each individual (e.g., age, gender, etc.).
An experienced analyst also knows that whatever the source of data, it is going to contain some errors. But even experienced researchers, who are aware of error in the data, tend to take the numbers at face value in their day-to-day work. For the most part, that is our approach. When substantial methodological problems or biases suggest a qualified interpretation of the data, it is noted, but otherwise we treat the audience ratings as valid measures of exposure.
We have already encountered several ways to summarize media audience behavior. Some of these are routinely reported by the ratings services, others are routinely calculated by ratings users. The most basic of all audience metrics is a rating. That term is bandied about in the industry and serves as a kind of shorthand for many forms of audience data. Technically, a rating is a percentage of the population watching a channel or listening to a station. Two other measures, shares and “HUTs” (households using television), often accompany ratings. Figure 4.1 provides an illustration of how those metrics are calculated. In this imaginary world of 10 television households, 2 are watching channel A and 3 are watching channel B. So those channels have ratings of 20 and 30, respectively. But not all homes are watching television at any point in time. The number of homes with sets in use is expressed in the HUT level. In our example, it is 50 percent, or just 50. A share is a percentage based only on those who are actually watching. In our example, A has a 40 share and B has a 60 share. Because HUT levels are always less than 100 percent of the population, a channel’s share is always larger than its ratings. In practice, there are all kinds of ratings, which describe different populations (male or female, young or old) or different media objects (programs, commercials, websites, etc.). We will describe these in detail in the following chapters.
It is useful, at this point, to draw a rather broad distinction between two basic types of audience metrics. We call one type gross measures and the other cumulative measures. The distinction has to do with whether they track the behavior of specific individuals over time. If an audience metric does not depend on tracking, it is a gross measure. If it does, it is cumulative. This temporal quality in the data defines a fundamental distinction that is carried through the rest of the book.
Gross Measures of the Audience
Gross measures of exposure include estimates of audience size and composition made at a single point in time. Examples include the ratings and shares we just described. Other gross measures include served impressions, views on YouTube, and movie ticket sales. In none of these instances do we have any clear sense of the number of “repeat customers” involved. In effect, these are snapshots of the population that indicate the popularity of a media product or outlet.

FIGURE 4.1. Simple Rating and Share Calculations
Electronic media can take these snapshots with great rapidity. Ratings services estimate how many people listen to a station in an average quarter hour or watch a program in an average minute. Projections of total audience size and estimates of the number of HUTs and persons using television (PUTs) belong in this category as well. Gross measures of exposure can also include secondary calculations derived from other gross measurements. Gross rating points (GRPs) are such calculations. GRPs are just a summation of individual ratings over a schedule. Simple cost calculations, like cost per ratings point (CPP) and cost per thousand (CPM), can, similarly, be thought of as gross measures. These measures are discussed thoroughly in chapter 5.
Gross measures are the most common summaries of audience, and most of the numbers reported in syndicated research reports are of this type. As a result, they are the best known and most widely used of audience measurements. Useful as they are, however, they fail to capture information about how individual audience members behave over time. That kind of behavior is expressed in cumulative measures.
Cumulative Measures of the Audience
The most familiar example of the second group of audience measurements is a station’s cumulative audience, or cume. To report a weekly cume audience, a ratings company must sort through each person’s media use for a week, and summarize the number that used the station at least once. Analogous audience summaries are: reach, unduplicated audience, and unique visitors to a website. A closely related cumulative measure that is familiar to advertisers is frequency, or how often an individual sees a particular advertising message over some period of time. Studies of program audience duplication, likewise, depend on tracking individual media users over time. You will read more about cumulative measurements in chapter 6.
With the exception of the cume ratings and unique visitors, cumulative measures are less commonly reported by syndicated research services than are gross measurements. Customized studies of audience duplication, however, may be useful in a variety of applications. For example, programmers studying audience flow or advertisers tracking the reach and frequency of a media plan are concerned with how the audience is behaving over time. Table 4.1 lists the most common gross and cumulative measures of media exposure.
Comparing Gross and Cumulative Measurements
To get a clearer picture of the difference between gross and cumulative measures, and to begin to appreciate the analytical possibilities offered by such data, consider Figure 4.2. Just like Figure 4.1, it uses households as the unit of analysis and television channels as the media object of interest. But conceptually, this is also how you might think of people visiting websites or seeing commercials at different points in time. The large box in the upper left-hand corner of the figure represents a simplified ratings database. The data are from a hypothetical sample of 10 households. These are numbered 1 through 10, down the left-hand column. The media use of each household is measured at 10 points in time, running from Time 1 to Time 10 across the top of the figure. Both types of measures can be generated for such a database.
TABLE 4.1
Common Measures of Exposure to Media
| Gross Measures | Cumulative Measures |
Average ratings |
Cume ratings |
Market shares |
Reach |
Impressions |
Unique visitors |
views |
Frequency |
Total sales |
Audience duplication |
In practice, of course, a ratings sample would be much larger, including hundreds or thousands of units of analysis. There also would be many more points in time. For example, a standard television diary divides each of 7 days into 80 quarter hours. That means that each person is measured across 560 (i.e., 7 × 80) points in time, rather than the 10 we have illustrated. Now try to imagine how many points in time we could identify in peoplemeter data that track viewing moment to moment over a period of years!
In Figure 4.2, we have assumed a three-station market, which means that each household can be doing one of four things at each point in time. It can be tuned to Channel A, Channel B, Channel C, or nothing at all. These behaviors are indicated by the appropriate letters, or a blackened box, respectively.
The most commonly reported gross measures of exposure are shown in the box directly under the database. Each column of data is like Figure 4.1, and is treated in the same way. Hence, Channel A has a rating of 20 and a share of 40 at Time 4. All one needs to do is look down the appropriate column. Unlike the calculation of a cume, whatever happened before or after that time period is irrelevant to the calculation of a rating.

FIGURE 4.2. Gross Versus Cumulative Measures in Rating Data
The box on the right-hand side of the figure includes common cumulative measures. To calculate these, we must first examine each household’s viewing behavior across time. That means moving across each row in the database. The first household, for example, watched Channel A four times and Channel B two times but never watched Channel C. Moving down each channel’s column of cumulative viewing, we can then determine its reach, or cume. Each channel’s cumulative audience is expressed as a percentage of the total sample that viewed it at least once over the 10 points in time. Therefore, the first household would be included in the cume of A and B but not C. Further, among those who did view a channel, if we compute the arithmetic average of the numbers in the column, we can report the mean frequency of viewing. This is essentially what an advertiser does when calculating reach and frequency, with the relevant points in time being determined by when a commercial message runs.
Studies of program audience duplication can also be executed from this database. For example, we might be interested in how well Station A retains an audience from one show to the next. We could determine that by seeing how many people who watched Station A at one point in time continued to watch the program that aired after it. For that matter, we could compare any pair of program audiences to assess repeat viewing, audience loyalty, and so on. In each case, however, we would have to track individual households across at least two points in time. Hence, we would be doing a cumulative analysis of exposure.
Depending on the kind of question they want to answer, ratings analysts would interpret gross measures, cumulative measures, or numbers that are derived from these two ways of defining exposure. As you will see, there are a large number of analytical techniques that can be organized in this way. In fact, these techniques are likely to maintain their usefulness even as the new technologies develop. Whether audiences are reached through the Internet, DBS, or traditional over-the-air broadcasting, the concepts of gross and cumulative measurements convey important information to programmers and advertisers. To exploit those analytical techniques to their fullest, however, we must develop a better understanding of the factors that shape audiences from moment to moment.
COMMON THEORIES OF MEDIA CHOICE
A question often asked by audience analysts is, “Why do people choose specific media content?” The answer most often given is, “They choose what they like.” This kind of reasoning is typical of industry practice, communications policy, and most academic theories of choice. It suggests that people’s preferences explain their choices, and hence audience behavior. This section reviews four of the most popular theories of media choice: the working theories used by industry practitioners; economic models of program choice; selective exposure theory; and uses and gratifications research. All rely very heavily, if not exclusively, on the idea of preferences. They provide a background against which our own framework can be better understood.
Working Theories of Program Choice
Working theories are the principles and assumptions used by media professionals in the conduct of their jobs. These “rules of thumb” may or may not have been subjected to systematic investigation. They may or may not correspond to the more academic theories of choice we review in the following sections. But they certainly deserve our attention. Programmers and media planners base these working theories on a day-to-day familiarity with the audience and how it responds to the media environment.
The people who craft media content are quite attentive to overall trends in popular culture as they try to anticipate what the audience will do next. Often, interest centers around the types of content people will like. We are all familiar with program “types.” In television, we talk about cop shows, situation comedies, news, sports, and reality programs. In radio, we describe formats as contemporary hits, country, rap, news/talk, or music of a certain decade. These are familiar industry categories, but we can actually define program types in any number of ways. For example, content could be grouped as entertainment or information, adult or children’s, and so on. In the United States, it is increasingly common to organize news and information into conservative and liberal categories, called “red” and “blue” media, respectively.
It is widely assumed that people will have consistent preferences for content of a type. We see anecdotal evidence of such reasoning in the operation of media industries. Popular movies are made into television series of the same sort. Hit television programs are imitated the following years, all apparently on the assumption that there is an audience out there that likes this kind of material. As one pundit phrased it, in television nothing succeeds like excess. Marketing researchers have conducted more formal studies to identify the content characteristics that seem to polarize people’s likes and dislikes. What they have generally discovered is that commonsense industry categories come as close to a viewer-defined typology as anything. That is to say, the people who like one situation comedy do, in fact, tend to like other sit-coms, and so on. Similar patterns of preference for rap music, country and Western, opera, and most other types of music are also common (MacFarland, 1997).
An interesting facet of people’s media preferences has emerged from this type of research. People’s dislikes are more clearly related to program type than are their likes. In other words, what we like may be rather eclectic, but what we dislike is more readily categorized. You might test yourself on this point by writing down the five television shows you like most and the five you like least. For some people, it is hard to express dislikes in anything other than program types. It seems that program choice results in not only seeking out what you like but also avoiding what you dislike.
Another significant feature of program type preferences is the linkage that often exists between certain types of content and the demographic characteristics of the audience. In television, for example, it is well established that news and information draw an older audience. Similarly, men tend to watch more sports than do women, children are attracted to animation, and viewers are often drawn to programs that feature characters of their own race or ethnicity. In fact, in multicultural contexts, media choices often gravitate to “culturally proximate” content, the most powerful dimension of which is language (Ksiazek & Webster, 2008). None of these associations is intended to suggest a lock-step connection between preferences and demographics; they are only tendencies. But working professionals should certainly be aware of their existence.
As important as preferences are in determining people’s choice of media materials, programmers know full well that many other factors enter the picture. In chapter 8, we describe how programmers analyze and try to manage audience flow. Radio and television programs are placed in a carefully crafted lineup. If a program is scheduled immediately after a popular show, it will enjoy a significant advantage in building an audience. Programming strategies such as lead-in effects and block programming all depend on this type of reasoning.
It is also important to consider when the audience is likely to be using the media, particularly linear media. The idea that total audience size is determined by things other than the available programming is common to both the conventional wisdom of programmers and to at least some formal theories of audience behavior. In 1971, the late Paul Klein, then a researcher at NBC, offered a tongue-in-cheek description of the television audience. Struck by the amazing predictability of HUT levels, Klein suggested that people turn the set on out of habit, without much advance thought about what they will watch. After the set is on, they simply choose the least objectionable program (LOP) from available offerings.
In effect, this suggests audience behavior is often a two-stage process in which a decision to use a medium precedes the selection of specific content. The tendency of people to turn on a set without regard to programming is sometimes taken as evidence of a passive audience, although this seems a needlessly value-laden label. The conceptual alternative, a thoroughly active audience, appears to be unrealistic. Such an audience would turn on a set whenever favorite programs were aired and turn off a set when they were not. We know, however, that daily routines (e.g., work, sleep, etc.) effectively constrain when we turn sets on. We also know that many people still watch or listen to programming they are not thrilled with, rather than turning off their sets.
Of course, this is a broad generalization about audience behavior. It is not intended to rule out the possibility that people can be persuaded to turn their sets on by media content. Major events, like the Super Bowl, royal weddings, or dramatic news stories, undoubtedly attract people to the media who would not otherwise be there. Heavy promotion and advertising can sometimes get the attention of potential viewers who then remember to tune in. It is also likely that levels of activity vary by medium. Print and the Internet may be intrinsically more engaging even though they require more effort on the part of media consumers. Moreover, levels of activity can vary over time. The same person might be choosy at one time and a “couch potato” the next. Overall, though, a two-stage process, including the role of habit, appears to explain audience behavior rather well.
Economic Models of Program Choice
Economic theory presents a formal model for explaining program choice. Although it is more abstract, it shares many of the elements embedded in the working theories we just reviewed. Peter Steiner (1952) is credited with groundbreaking work in this field. He, and those who have extended his work (e.g., Owen & Wildman, 1992), take the approach that a person’s choice of programming is analogous to his or her choice of more conventional consumer products. Hence, older theories of product competition have served as the model for economic theories of program choice.
These theories make two important assumptions about the audience. First, they assert that there are program types that can be defined in terms of audience preferences. That means that people who like one program of a type will like all other programs of that type. Conversely, people who dislike a program will dislike all others of that type. Economic models generally leave these “program types” abstract and undefined. But as we have seen, there is some reason to believe people have systematic likes and dislikes when it comes to common program types.
Second, if programming is advertiser-supported the models assume that programs are a “free good” to the audience member. Theorists explicitly ignore both the opportunity cost of audience time and the potential increased costs of advertised products. Assuming that programs are like free products has an important, although often unspoken, implication. If programs have no price, it seems logical that the only thing left to explain audience choice is preference. The assumption that preference is a cause of choice is certainly in keeping with the other economic theories, and it is broadly consistent with much social scientific theory.
Economic models of program choice have differed in how they resolve the active-passive question that we discussed earlier. Steiner (1952) assumed a thoroughly active audience in which audience size was determined by the presence of people’s preferred program types. According to Steiner’s model, when your favorite program type was not on, neither was your set. Subsequent models, however, have relaxed that rather stringent assumption and incorporated a two-stage process that allows for second and third choices, much like that proposed by Klein.
With these assumptions in place, it is possible to predict the distribution of audiences across channels. For example, if it is assumed that there is a relatively large audience for some particular type of programming, then two or more competing channels or stations will split that audience by offering programming of that type. This will continue to occur until that program type audience has been divided into small enough pieces that it makes sense for the next competitor to counterprogram with different types of shows. Consequently, when there are only a few competitors, similar programs tend to be offered across channels. According to this body of theory, as the number of competitors increases, media content becomes more differentiated. This creates what one commentator described as a “long tail” distribution, with popular offerings at one end and countless niches spread out along the other (Anderson, 2008). The availability of all this material sets the stages for the audience fragmentation, we described earlier.
Selective exposure theory offers another way to explain people’s use of media content. It has been developed by social psychologists, who, among other things, are interested in understanding the media’s effect on audience members. In its earliest form, selective exposure theory assumed that people had certain attitudes, beliefs, or convictions that they were loath to change. These predispositions led people to seek out media that were consistent with their beliefs and to avoid material that challenged them. Simply put, people would “see what they wanted to see” and “hear what they wanted to hear.”
This commonsense notion gained credibility in the 1950s and 1960s with the introduction and testing of formal psychological theories, like cognitive dissonance. Early studies seemed to indicate that people did select media materials that supported their existing belief systems, or cognitions. Hence, selective exposure to news and information appeared to be an important principle for understanding an individual’s choice of programming. While work on selective exposure to news languished for a time, the profusion of news and entertainment outlets on television and the Internet, including some with ideological slants, has encouraged new work in this area (e.g., Prior, 2007; Stroud, 2011).
Research on selective exposure has also gone beyond the bounds of news and information. Here the causal mechanism is not dissonance reduction so much as it is pleasure seeking. For example, experimental studies have shown that people’s choices of entertainment vary with their moods and emotions. Excited or overstimulated people are more inclined to select relaxing program fare, whereas people who are bored are likely to choose stimulating content. Emotional states, in addition to more dispassionate cognitions, all seem to influence our program preferences. These variations in selective exposure research sometimes go under the general heading of “mood management theory” (e.g., Hartmann, 2011; Zillmann, 2000).
Uses and Gratifications Theory
Gratificationist theory provides a closely related, if somewhat more comprehensive, perspective on audience behavior. Studies of “uses and gratifications,” as they are often called, are also the work of social psychologists. This approach emerged in the early 1970s, partly as a reaction against the field’s apparent obsession with media effects research. Gratificationists argued that we should ask not only “what media do to people” but also “what people do with the media.” Katz, Blumler, and Gurevitch (1974) spelled out the research agenda of this approach. According to them, gratificationists:
are concerned with (1) the social and psychological origins of (2) needs, which generate (3) expectations of (4) mass media or other sources, which lead to (5) differential patterns of media exposure (or engagement in other activities), resulting in (6) need gratifications and (7) other consequences, perhaps mostly unintended ones” (p. 20).
Since the early 1970s, gratificationist research and theory have attracted considerable attention. Under this perspective, patterns of media use are determined by each person’s expectations of how well different media or program content will gratify their needs. Such needs might be short-lived, like those associated with mood states, or they might be relatively constant. In any event, it seems likely that the gratifications being sought translate rather directly into preferences for the media and their content.
Gratificationist theory, therefore, has much in common with economic models of program choice and theories of selective exposure. All of them cast individual preferences, however they have emerged, as the central mechanism for explaining exposure. This approach to explaining media choice has a great intuitive appeal. Why does the audience for hard rock music tend to be young men? Because that is the kind of music they like. Why do older people consume more news and information? It is because they have a preference for that type of content. How, then, can we explain audience behavior? All we need to do is understand people’s preferences.
Unfortunately, the power of preferences to determine exposure to the media is not as absolute as many people assume. Theories that rely exclusively on preferences to explain audience behavior put all their “eggs in one basket.” They are pitched at what we earlier called the “micro-level” of analysis. But audience behavior is a “macro-level” phenomenon. To explain what large numbers of media users are doing, we need to consider the structural features of both the audience and the media environment. Without those macro-level factors, we can only see half the picture.
TOWARD A COMPREHENSIVE UNDERSTANDING OF AUDIENCE BEHAVIOR
Exposure to media happens at the interface between the audience and the media. In this section we consider both sides of the equation: audience factors and media factors. Each has a substantial effect on patterns of exposure. Within each category, we make a further distinction between structural and individual factors. Although it is sometimes hard to distinguish between the two, they reflect different levels of analysis. The distinction also identifies a traditional division in research and theory on media exposure. By structural determinants, we mean factors that are common to, or characteristic of, populations. These macro-level variables typically describe markets, media delivery systems, or masses of people. Much marketing and industry research highlights the role of structural determinants, like program schedules or hyperlinks, in shaping audiences. Individual determinants describe a person or household. These are micro-level variables that vary from person to person. Much social psychological research, like the theories we just reviewed, highlights the role of individual differences. Taken together, these factors offer a more complete framework for identifying the forces that shape audience behavior.
Structural Features of the Audience. The first structural feature of the audience that shapes exposure to media is the size and location of potential audiences. Sometimes, the potential audience is easy to determine, like the number of people living within reach of a broadcast signal. But the potential audience can also be more elusive. For example, something posted on the Internet is technically available to a worldwide audience, yet as a practical matter, many sites have a distinctly local character and following. Obviously, no form of media can have an audience larger than the size of the relevant market population. The population, in effect, sets an upper bound on the audience potential for any program service. The larger the potential, the more media organizations are willing to invest to win a “piece of the pie.”
In broadcasting, ratings services often divide large countries into local market areas. In the United States, there are over 200 television markets, what Nielsen calls Designated Market Areas (DMAs; see Appendix A). In China, there are 31 provincial markets. Clearly, the potential audience for a station in one market can be vastly larger than the audience in another. This does not, of course, guarantee that large market stations will have larger audiences, especially since large markets tend to have more media outlets. Nevertheless, it sets the stage for bigger audiences and bigger audience revenues.
Potential audiences, however, are not just a matter of the sheer number of people living within reach of a medium. The composition of the population can have an impact on long-term patterns of exposure as well. As the demographic makeup of potential audiences changes, it is reasonable to expect that patterns of media exposure will change as well. Census data, for example, can reveal shifts in the relative size of populations with different occupations, the age of the population, and most notably in the levels of education throughout the population. Occupation, age, and education are often associated with the choice of certain types of programming. A far-sighted media operator will take population shifts, most of which are quite predictable, into account when planning for the future.
The growth of Spanish-language programming in the United States can be viewed, at least in part, as a result of newly emerging potential audiences. For example, in 1970 Latinos or Hispanics accounted for 4.5 percent of the U.S. population. By 1990 that figure had doubled. By some estimates, it will double again by 2025, with even higher concentrations in a number of U.S. markets. Rapid growth rates also characterize the U.S. Asian population. Such changes in ethnic or linguistic populations provide new markets for advertisers and the media, and are often accompanied by new and very distinctive patterns of media use.
The second structural attribute of audiences, and one of the most powerful determinants of exposure to linear media, is audience availability. While potential audiences set an absolute physical limit on audience sizes, our daily routines set a practical limit on how many people are likely to be using either radio or television at any point in time. It is widely believed that the number of people using a medium has little, if anything, to do with programming and almost everything to do with who is available. Most practitioners take the size of the available audience as given, just as they would the size of the population itself. Even the use of nonlinear media (like watching video on-demand or visiting websites) is powerfully influenced by the rhythms of daily life (Taneja et al., 2012). As a rule then, people use media platforms when they have the time and inclination to do so. This limits who is available at any point in time and therefore sets an upper bound on the total size of the platform’s audience at that moment in time.
The size of the available audience, like other forms of mass behavior, is quite predictable. Three patterns are apparent: seasonal, daily, and hourly. Seasonal patterns of media use are more evident in television than in radio. Television use is heaviest in the winter months and lightest during the summer. This shift seems to occur because viewers have more daylight in the summer and pursue outdoor activities that take them away from the set. These seasonal changes mean lower HUT levels in the summer and higher HUT levels in the winter. But household-level data can mask important differences within demographic groups. For example, when school is out, daytime viewing among children and teenagers soars. The same vacation-time phenomenon appears to account for seasonal differences in movie theater attendance.
Audience size also varies by day of the week. In the United States, prime time television audiences are larger on weeknights and Sunday and smaller on Fridays and Saturdays. The late-night audience (e.g., midnight) on Friday and Saturday, however, is larger than it is during the rest of the week. This, too, seems to reflect a change in people’s social activities on the weekends.
The most dramatic shifts in audience availability, however, occur on an hourly basis. It is here that the patterns of each day’s life are most evident. Figure 4.3, shows how Americans allocate their time across media platforms during each half hour of the day. The data were collected in an unusual study sponsored by the Council for Research Excellence (CRE). In it, investigators followed former Nielsen panelists throughout the day, noting their activities and use of media. They labeled television viewing, including DVR use, as the “first screen.” Computer use, including the Internet and software, was labeled “second screen.” Using mobile devices for text, talk, or Internet was considered “third screen.” And use of any other screen, like in cinema movies, was the “fourth screen.” Television, radio, and, to a lesser extent, newspapers are people’s media choices early in the day. Computers occupy a larger share of time during the workday. Throughout most of the day, audio use, including radio listening, is a steady presence until people return home from work. At about 5:00 p.m., television use begins to grow, and it becomes the dominant medium during the evening. It is during this time when HUT levels are at their highest in the United States and everywhere else in the world.

FIGURE 4.3. When Media Are Used
Source: Adapted from CRE (2008) Video Consumer Mapping Study. Permission Nielsen Company.
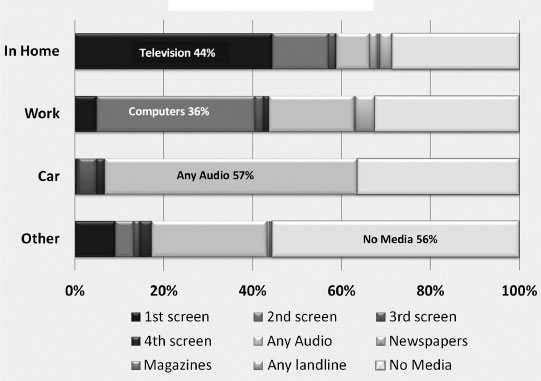
FIGURE 4.4. Where Media Are Used
Source: Adapted from CRE (2008) Video Consumer Mapping Study. Permission Nielsen Company.
Media use also varies by the user’s location. Figure 4.4 organizes the same CRE data by where media are used. The results are probably what you would expect. When people are at home, television is the dominant medium, followed by computers. When people are at work, computers are the most prominent, followed by some form of audio. In the car, audio—most likely radio—is the preferred platform. And in any one of these and other locations, there is a fair amount of time people spent using no media at all. All of these patterns in media use circumscribe what programs or media outlets a person is likely to encounter at any point in time.
Thus far, our approach to explaining exposure has had almost nothing to say about people’s content preferences or the appeals of different kinds of programming. Remember, however, that we can characterize much audience behavior as a two-stage process. When people use different media platforms is clearly driven by their habits and the rhythms of day-to-day life. But once people are engaged with a particular medium, their needs and wants, likes and dislikes, as well as a number of other factors, play a more important role in determining what they are exposed to. These are the micro-level determinants of audience behavior.
Individual Audience Characteristics. The most important micro-level determinants of exposure to media are, broadly speaking, people’s preferences. Much of a programmer’s skill in building an audience comes from an ability to judge what people will or will not like. As we noted in the previous section, this strategy for explaining audience behavior is also popular with academics. Most research and theory on the relationship between preference and choice focus on the individual and assume that a person’s preferences can be freely exercised in their media choices. Economic models of program choice, selective exposure theory, and gratificationist theories all rely on this assumption. It is often justified on the basis of studies done in laboratory settings that evaluate how individuals choose among limited options when they are alone. Unfortunately, in the real world at least two things interfere with the tidy relationship between a person’s media preferences and what they actually choose. The first is the tendency of people to use media, especially television, in groups. The second is knowing which of a great many options is the best.
Group viewing mediates the relationship between individual preference and choice. Even today, when most households have more than one set, people still view in groups especially during prime time (CRE, 2008). What little research there is on the dynamics of group viewing suggests that negotiation among competing preferences is quite usual. Different members of the family seem to exercise more or less influence at different times of the day. For example, programmers take into account that children are often in control of the television set in the late afternoon when they return from school. Exposure to television programming, then, results not only from who is available and what they like, but who is actually making the program selections. People get their first choices some of the time but can be outvoted at other times. Even if they are overruled, however, they will often stay with the viewing group. Ask any parent of a young child whether they are watching more cartoons since the child’s arrival. Ask children if they see more of the evening news than they would like. In effect, some of our exposure to media happens despite our preferences. Group viewing, or, for that matter, group music listening or group movie attendance, can constrain the relationship between preference and choice. More solitary forms of media use (e.g., reading or Internet) may offer a cleaner linkage between these factors.
An increasingly important factor that complicates the relationship between preference and choice is awareness. By awareness, we mean full knowledge of the media content or services that are available to you. Much theorizing about audience behavior assumes that people’s choices reflect a perfect awareness of their options. This is very much in keeping with the “rational choice” models that underpin conventional economic theory. Although that assumption might be workable in very simple media environments, it is fraught with problems in the abundant media environments that confront most audience members.
People simply cannot be expected to know everything there is to know about their options. Nobel laureate Herbert Simon (1997) referred to this condition as “bounded rationality.” There are two things that bound rational media choices. First, there is simply too much to choose from. Hundreds of television channels and millions of websites are usually just one click away. People can, and often do, use guides or search engines to help inform their choices, but these are time consuming and cannot provide perfect information. Second, media are typically “experience goods,” meaning, you really do not know what they have to offer until you experience them. Even if a person chooses a familiar artist or television program, they will not know if a new offering is enjoyable until they have tried it. So, people can never be fully aware of which media will best satisfy their preferences at any point in time. They just do the best they can, something that Simon called “satisficing.”
In addition to using guides to ease the problem of bounded rationality, media users rely on recommendations from other people. Communication researchers have known for a long time that interpersonal influence affects people’s choices (Katz & Lazersfeld, 1955). But until recently, such influences flowed within relatively small social networks of friends and family. Today, social media have greatly expanded those networks. Facebook and Twitter provide platforms for gathering and aggregating opinions about what media are worthy of attention. Social news sites like digg poll users about what stories people should read. Often the process of recommendation is automated by “recommender systems,” a topic we will address in the following section. Increasingly, though, social networks shape our media choices.
The role that audience preferences play in determining audience behavior, then, is more complex than many assume. For example, a small audience might indicate that people did not like a particular program, but it might also indicate that people were unavailable when it aired. A website or clip on YouTube that has only been viewed a few times might mean it is unappealing, or it could be that people do not know it exists. Any interpretation of media use should consider all the factors summarized in Table 4.2. But audience factors are only half the picture. The media themselves have an impact on patterns of exposure.
Audience Factors Affecting Exposure
| Structural | Individual |
Potential Audiences Local v. National v. Global Demographic Trends Ethnic or Linguistic Populations |
Preferences Program Type Preferences Tastes Gratifications Sought |
Available Audiences Seasonal variation Weekly variation Hourly variation |
Group v. Solitary Media Use Awareness of Options Social networks |
Like audience factors, media factors can be thought of as structural or individual in nature. The structural attributes of the media complement the structural features of the audience. They include market conditions and how media content and services are organized. Individual-level media factors define differences in the media environment from household to household.
Structural Features of the Media. The first structural characteristic of the electronic media is coverage, which is the extent to which people are physically able to receive a particular outlet or offering. In much of the world, broadcast signals are commonly available. Most households in developed countries now have cable or satellite services. High-speed access to the Internet is also becoming commonplace. But very few platforms are universally available, and the penetration of these technologies changes over time. Table 4.3 summarizes the growth of television systems in the United States since 1970. While television has been a fixture in virtually all homes over that period of time, cable has not. In fact, 10 percent of homes still get broadcast-only reception. But as you can see, new technologies can arise quickly. That changes the structure of the media environment. As the coverage of different media platforms grows or contracts, it opens or closes avenues for building audiences. Like population size, coverage sets a limit on what kinds of audiences are possible.
TABLE 4.3
Penetration of TV Technologies in U.S. Households 1970 to 2012

ADS-Alternate Delivery Service
DBS-Direct Broadcast Satellite
DVR-Digital Video Recorder
HD-High Definition
VCR-Video Cassette Recorder
PC-Personal Computer
Source: Nielsen (2011). The Television Audience 2010 and 2011.
Even when national media are able to offer “free” content to everyone, local outlets may affect coverage by refusing to carry certain programs. In the United States, with the exception of a few television stations that are actually owned and operated (O&Os) by the networks, affiliates are independent businesses that act in their own self-interest. This means that an affiliate may not carry (or “clear”) all of a network’s programming if it believes some other programming strategy will be more profitable. They could drop an entire series or preempt a single broadcast. These variations in network clearance mean that some broadcast network programs do not reach the entire population.
There are analogous phenomena with cable networks, syndicated programs, and the Web. Cable systems organize cable networks into exclusive tiers of service or they do not carry them at all. Syndicated programs are bought in some markets but not others, so very few approach the coverage of broadcast network programs. While websites can, in theory, reach anyone with Internet access, content owners may limit distribution to certain classes of users, like those who already have a cable television subscription. Some sites that offer free content at all are actively blocked. Businesses often do this on workplace computers. China is well known for having a “Great Fire Wall” that filters out unwanted content. Once again, this puts a cap on the total possible audience size.
Within any given medium, a number of other structural factors operate to affect audience behavior. The first consideration is the sheer number of options that confronts the audience. For most forms of media, that number has increased dramatically over the years. In the 1950s, the average U.S. television household could receive roughly four channels. Today, with cable and satellite television, it is common for homes to receive well over 100 channels. If you include nonlinear media like DVRs and VOD, not to mention the Internet, the choices seem almost limitless. We have noted how this contributes to audience fragmentation, but increased choice does not mean that all share equally in the audience.
We saw in Figure 2.2 that increased competition took a toll on broadcast network audiences, but we did not see how viewers spent the rest of their time. Even with abundant choices, some programs and outlets remain relatively popular while most must manage with small audiences. That discrepancy in audience size can be seen in what is called a long tail distribution. Figure 4.5 is a long tail distribution of television networks in the United States. It arranges media outlets along the horizontal axis from the most popular to the least popular. The vertical axis reports the size of each network’s audience, in this case the monthly cume or reach. The light bars are the broadcast networks. While their audiences are not what they used to be, they still have far more viewers than their cable counterparts. This may be due, in part, to having better coverage of the population.
The Internet offers users even more choices. Figure 4.6 is a long tail distribution showing the monthly reach of the top 138 Internet “brands” (e.g., Google, Yahoo, Facebook). Although it assumes the same general shape of the television distribution, it is even more concentrated. That is, a relatively small number of websites dominate the medium, while audiences for the rest trail off quickly.
Long tail distributions, also called “power law” or “80/20” distributions, are commonplace in media consumption. It does not matter if you look at movies, music, or magazines, it is always the case that a relatively small number of the top sellers account for most of the audience. In fact, a medium with more choices like the Internet is often more likely to produce “winner-take-all” results. Why this happens is a puzzle. It could be that best sellers are just of higher quality and therefore more popular. It could also be that people’s desire to talk about media causes them to “herd” to a few visible offerings. Social media and recommendations systems probably help the herding along. While abundant choice clearly affects audience behavior, just how people make use of that abundance is not a simple matter (Anderson, 2006; Webster & Ksiazek, 2012).

FIGURE 4.5. A Long Tail Distribution of U.S. Television Networks
Source: Webster & Ksiazek (2011)
The structural complexities of the media, however, go beyond the number of channels or outlets that are available. Different forms of media often have their own internal structures. Linear media, like radio and broadcast television, offer people a series of forced choices. It is quite possible to encounter situations in which two desirable programs are aired opposite one another, and the viewer has to choose between them. Had they been scheduled at different times, the viewer could have watched both. Program scheduling, within and across channels, therefore, has been an important factor in shaping the size, composition, and flow of audiences.
As we discuss in chapter 8, programmers use their knowledge of audience flow to encourage people to watch their programs rather than those of the competition. Indeed, there are well-documented patterns of audience duplication, such as inheritance effects, channel loyalty, and repeat viewing, that all seem to derive from structural factors (Goodhardt, Ehrenberg, & Collins, 1987; Webster & Phalen, 1997). Despite the growing availability of nonlinear media like DVRs, these patterns persist in every country where they have be studied (Jardine, 2012; Sharp, Beal, & Collins, 2009; Yuan, 2010).
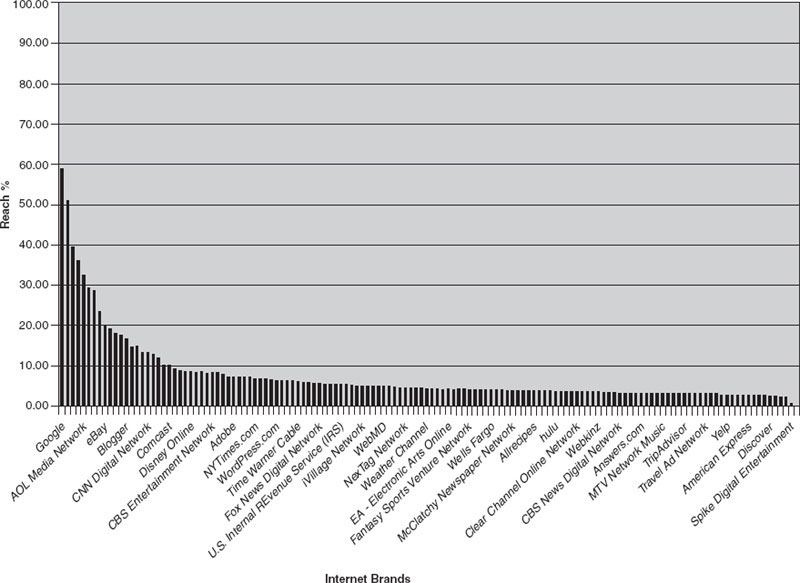
FIGURE 4.6. Long Tail Distribution of Internet Brands.
Source: Webster & Ksiazek (2011)
There are structural features built into the Internet as well. Many websites have hyperlinks that point visitors to other pages on the Web. These links make some things more visible and easily accessible than others, encouraging people to visit. The power of hyperlinks to direct traffic is built into search engines like Google, which ranks its recommendations by the number and importance of a sites inbound links (Battelle, 2005; Turow & Tsui, 2008). Search engines are one of many recommender systems that help people make choices in a world of bounded rationality. Some use simple head counts to report things like the most viewed videos or news stories. Others, like “social TV guides,” use algorithms to recommend what “people like you” have chosen. As useful as these systems might be, they have their own biases. For example, most put a premium on personalizing results, encouraging people to consume more of the same. Virtually all of them steer users to the most popular options within categories (Webster, 2010). In doing so, they direct public attention to some things and away from others. They are yet another structure that, increasingly, shapes audience behavior.
But even these factors do not entirely exhaust explanations of variability in media environments. There are a few micro-level media factors that complete the picture.
Individual Media Environments. Factors like network coverage, program scheduling, and search engine results are generally beyond the control of any one audience member. But certain aspects of the media environment are within the individual’s control. In fact, this is truer today than it has ever been. As new technologies and programming alternatives enter the marketplace, each of us has greater latitude in shaping a media environment to suit our purposes. These decisions can certainly affect our exposure to the media and are closely related to the micro-level audience factors we reviewed earlier.
One of the first considerations is the kind of technologies owned by individual audience members. Radio and television sets have been in virtually all U.S. households for decades, but more and more people have multiple sets throughout their homes. Set technology also changes over time. The latest televisions not only have big, high-definition screens, but they integrate access to the Internet. Every day seems to bring new electronic toys that entice consumers, whether it is the latest tablet computer or smartphone. A 2011 survey of online respondents in 56 countries around the world indicates how many have or intend to buy several kinds of newer media platforms. For example, only 12 percent report owning tablets, but another 19 percent said they plan on buying one. Similarly, 36 percent had smart phones, and another 21 percent intended to get one (Nielsen, 2011). Individuals presumably buy these technologies because they believe they will be useful—even if it is only to impress the neighbors. But owning any one of those platforms can change the way people use media and, in the aggregate, affect audience behavior.
Subscriptions are yet another decision that each person or household makes. People have long subscribed to different print media like newspapers or magazines. They now subscribe to Internet service providers (ISPs), cable or satellite systems, premium services like HBO or Netflix, as well as various online publications and services. These obviously enable differential patterns of exposure.
Individuals also have idiosyncratic habits that structure their media environments. Most media users must cope with an overwhelming number of choices. We have known for some time that, confronted with a large number of channels, television viewers develop a channel repertoire (Heeter & Greenberg, 1988). That is a small subset of the available channels that the viewer actively uses. For example, people who receive 100 channels generally use 15 or so on a regular basis. That pattern is typical around the world (e.g., Yuan & Webster, 2006). Similarly, confronted with overwhelming choices on the Web, people rely on “bookmarks.” As media use now ranges across multiple platforms, audience analysts have begun to identify analogous “media repertoires” (e.g., van Rees & van Eijck, 2003). These can effectively preclude exposure to most channels and websites, even if they are only one click away. Moreover, technologies that allow people to preset favorites or “learn” and support a person’s habits of use could further entrench repertoires. The net result is that, on a day-to-day basis, each media user makes choices from a surprisingly limited menu. These menus are tailored to each individual and may pose an effective barrier to more wide-ranging selections. Table 4.4 summarizes the media factors we have discussed.
TABLE 4.4
Media Factors Affecting Exposure
| Structural | Individual |
Coverage Household penetration Signal carriage Clearance |
Technologies owned Radios and TV sets DVDs and DVRs Computers/phones |
Content options Number of choices Program schedules Hyperlinks |
Subscriptions Cable/satellite Internet service Premium services |
Recommender systems Search engines Social media |
Repertoires Channel repertoires Bookmarking |
AN INTEGRATED MODEL OF AUDIENCE BEHAVIOR
Audience behavior is influenced by many things. We have defined and discussed most of them in the preceding sections but have not put the pieces of the puzzle together. It is useful, at this point, to step back and reflect on what has been presented as we construct a cohesive framework or model of audience behavior. A good model helps us ask the right questions and, in turn, guides the analysis of data.
Audience researchers have devoted considerable time and effort to understanding people’s use of the electronic media. Ad agencies and the media themselves have done very pragmatic studies of audience formation, economists have developed rather abstract theories of program choice, and social psychologists have performed a seemingly endless succession of experiments and surveys to reveal the origins of media use. Despite progress in these, and many other fields, there has been an unfortunate tendency for each group to work in isolation from the others. Instances of collaborative work between theorists and practitioners or even across different academic disciplines are all too rare.
At the risk of greatly oversimplifying matters, two fairly distinct approaches to understanding the audience can be identified. The first emphasizes the importance of the individual factors. This perspective is typical of work in psychology, communication studies, and, to some extent, marketing and economics. It also has enormous intuitive appeal and is likely to characterize most common-sense explanations of the audience. After all, audiences are simply collections of individuals. Surely, if we can understand behavior at the individual level, then our ability to explain larger patterns of mass behavior will follow. When we conceptualize audience behavior at the individual level, we tend to look for explanations by thinking of those things that distinguish us as individuals. Above all, we have invoked preferences as a way to explain behavior. With this focus, however, we often miss seeing patterns that crystallize higher levels of analysis. For instance, it is doubtful that any one television viewer chooses to create an inheritance effect, yet night after night, we see that kind of audience flow. It is unlikely that people conspire to make long tail distributions, yet their actions create them with great regularity.
The second perspective emphasizes structural factors as key determinants of mass behavior. This approach is more typical in sociology, social network analysis, and at least some forms of marketing and advertising research. It downplays individual needs and wants and concentrates on things like market information, coverage areas, program schedules, and hyperlinks in an attempt to understand audience behavior. Although work in this area can be highly successful in creating statistical explanations of aggregated data, it often has a hollow ring to it. One is often tempted to ask, “What does this mean in human terms—what does it tell us about ourselves?” Such explanations are usually possible but not always apparent.
It is important to recognize that neither approach is right or wrong. They just have different way of seeing the audience. The first focuses on individual media users and tries to understand audiences from the inside out. The second focuses on structures and works from the outside in. Academics sometimes say these approaches emphasize either “agency” or “structure.” And there is a school of thought that says you cannot have one without the other, something academics call a “duality” (Giddens, 1984; Webster, 2011). That is, people need structures to enact their desires and, in doing so, they reproduce and change those structures. Agency and structure are “mutually constituted,” which is a productive way to think about audiences. For example, we call program schedules a structural factor, yet programmers constantly adapt these to the actions of viewers. Signal coverage is a structure, yet it depends on individuals buying technologies and subscribing to services. Similarly, recommender systems like search engines are structural, yet they build their recommendations by aggregating individual actions. The list goes on and on. The most comprehensive models of audience behavior recognize the roles of agency and structure, and the tensions between them (e.g., Cooper & Tang, 2009; Webster, 2011; Wonneberger, Schoenbach, & van Meurs, 2009; Yuan & Ksiazek, 2011).
The model presented in Figure 4.7 is intended to help organize our thinking about audience behavior as it is commonly defined in audience research. It suggests broad relationships, but it does not, in and of itself, provide hypotheses to be tested. It certainly falls short of being a mathematical model (although we use Figure 4.7 as a springboard for discussing several such models in chapter 6). The model focuses on short-term audience behaviors. Within that time frame, the structures we see are relatively rigid.
The central component of the model, the thing we are trying to explain, is exposure to media. As we argued in chapter 1, audience analysts are interested in macro-level behaviors. We saw earlier in this chapter that the most common measures of that behavior can be categorized as gross or cumulative. Two broad categories are shown as the causes of exposure: audience factors and media factors. The shape of the “boxes” indicates the direction of influence. For example, the model suggests that audience factors help determine ratings, not vice versa. There also are cause-and-effect relationships among the factors within each box. For instance, audience preferences probably contribute to patterns of availability, and cable subscription helps shape cable network coverage. We have opted to omit arrows suggesting all these interrelationships, to keep the model cleaner.
To use the model, you should identify the sort of audience behavior you wish to analyze. Are you concerned with the size of an audience at a single point in time (i.e., a gross measure), or are you interested in how audience members are behaving across time (i.e., a cumulative measure)? To begin the process of evaluating, explaining, or predicting that behavior, consider the structural determinants first. There are three reasons why we recommend you look initially for structural explanations. First, like the measures of exposure you are analyzing, they are pitched at the macro-level of analysis. Second, they are more knowable. Information on program schedules, network coverage, and total audiences is typically in the research reports themselves. Individual factors, like audience awareness or the strength of user preferences, are a bit harder to pin down. Third, we know from experience that structural explanations work well with most forms of audience data. If they fail to provide a satisfying answer, however, begin the process of thinking through the individual-level factors on either side of the model.

FIGURE 4.7. A Model of Audience Behavior
Let’s work our way through an example to get a better sense of the model. Keep in mind that it is not designed to provide a quick answer to difficult audience research questions but rather to guide the analyst in considering all the relevant factors. Consider, for instance, the ratings of a local television news program. Why do some stations have high ratings, and others have low ratings? What factors will shape a station’s audience size in the future? Advertisers, as well as local station managers and programmers, would probably have an interest in this sort of analysis. Imagine that you work for a station and you want to assess its situation.
A rating, of course, is a gross measure of audience size. Local news ratings, in particular, have an important impact on station profitability. To explain the size of a station’s news audience, we should first consider structural factors. If audience size is to be expressed as an absolute number, we would need to know the size of the potential audience defined by the population in the market. At the same time, we would want to consider the nature of the station’s coverage area. Is it a VHF or a UHF station? If it is the latter, you’re probably already at a disadvantage. Is there anything about the station’s signal or local geography that would limit the station’s ability to reach all of the potential audience? Next, we would want to know the size of the audience at the time when the news is broadcast. An analysis of share data, of course, might overlook this, but since we are interested in ratings, the bigger the available audience, the better are our chances of achieving a large rating. We might pay special attention to those segments of the audience that are more likely to be local news viewers. Experience tells us that these are probably going to be older adults. Next, we would consider a variety of program-scheduling factors.
The first scheduling consideration would involve assessing the competition. Just how many competitors are there? As they increase in number, your ratings are likely to decrease. Do other stations enjoy any special advantages in covering the market? What are your principal competitors likely to program opposite the news? Will you confront only news programs, or will the competition counterprogram with something different? The latter is much more likely if you are an affiliate facing other independent stations. If the available audience contains a large segment that is less likely to watch the news (e.g., children and young adults), that could damage your ratings. Consider the programming you have before and after your news. A highly rated lead-in is likely to help your ratings, especially if it attracts an audience of news viewers. If you are an affiliate, pay close attention to the strength of your network’s news program. Research has shown that there is a very strong link between local and network news ratings.
More often than not, these structural factors explain most of the variations in local news ratings. A station can control some things, like lead-in programming. Other things, like the number of competitors it has, are beyond its control. Because a single ratings point might make a substantial difference in a station’s profitability, however, consideration of individual factors may be warranted, especially if these are things a station can manipulate.
Among the most likely candidates for consideration are viewer preferences and awareness. Are there certain personalities or program formats that are going to be more or less appealing to viewers? Every year, consultants to stations—news doctors they are called—charge large fees to make such determinations. It is possible that monitoring social media may give a lower-cost way to assess people’s preferences and levels of engagement. But remember, these are self-selected commentators who may not represent the audience at large. In markets that are not measured continuously, stations often schedule sensationalist special reports to coincide with the ratings sweeps. A riveting investigative report is unlikely to boost a program’s ratings, however, unless additional viewers are made aware of it. So stations must simultaneously engage in extraordinary promotional and advertising efforts. Here again, social media present new opportunities for building the program’s brand or a conversation about stories, although it is sometimes difficult to manage that process. And all the stations in a market are probably doing the same thing. Therefore, although catering to audience preferences is important in principle, in practice it may not make a huge ratings difference. Even so, a small edge can be crucial to a program’s profitability.
The analysis of Internet audience behavior follows along the same lines as television, except we typically define exposure in terms of unique visitors, page views, or impressions. Suppose, for example, you wanted to explain the flow of traffic from one website to another. This might reveal something about audience loyalties. The kind of behavior we are interested in is cumulative, and a study of audience duplication between websites is probably our best bet. Once again, begin by considering structural factors. If we were interested in global audience flows—after all, it is the “World Wide” Web—we would probably want to be mindful of the language used on the websites. Loyalties might well revolve around language and ethnic and national identities. Among the media structures to consider would be the nature of links among sites. Sites that are tied together by hyperlinks are more likely to share traffic. You would also want to assess the role of user information regimes in making some sites more salient than others. It is possible that a handful of structural factors will explain audience duplication across sites. If not, adding information about the kinds of sites (e.g., news, sports, entertainment, shopping, etc.) might better reflect the range of user preferences for content and help explain why some sites seem to cluster together.
In closing, we might comment briefly on the long-term nature of exposure to media. One danger of characterizing audience behavior as the result of nicely drawn arrows and boxes is that things are made to seem simpler than they really are. For instance, the model defines exposure as the result, but not the cause, of other factors. Over time, audience ratings can have a substantial effect on the structure of the media (e.g., Anand & Peterson, 2000; Napoli, 2011). Similarly, the model, as we have presented it, suggests a high degree of independence between audience and media factors. In the short term, that seems to be a workable assumption. Over the long haul, however, it could promote a distorted picture of audience behavior.
To at least acknowledge these issues, we have specified some long-term relationships between audience and media factors. For example, the growth of potential audiences and patterns of availability clearly affect the development of media services and programming strategies. Conversely, the structure and content of the media undoubtedly cultivate certain tastes, expectations, and habits on the part of the audience. These are important relationships but not central to our purpose. Bearing such limitations in mind, we hope the model provides a useful framework for evaluating audience data and exploiting the analytical techniques discussed in the remaining chapters.
Anderson, C. (2006). The long tail: Why the future of business is selling less of more. New York: Hyperion.
Barwise, P., & Ehrenberg, A. (1988). Television and its audience. London: Sage.
Hartmann, T. (ed.). (2009). Media choice: A theoretical and empirical overview. New York: Routledge.
MacFarland, D. T. (1997). Future radio programming strategies: Cultivating listenership in the digital age. Mahwah, NJ: Lawrence Erlbaum Associates.
McPhee, W. N. (1963). Formal theories of mass behavior. New York: The Free Press.
McQuail, D. (1997). Audience analysis. Thousand Oaks, CA: Sage.
Owen, B. M., & Wildman, S. W. (1992). Television economics. Cambridge, MA: Harvard University Press.
Pariser, E. (2011). The bubble filter: What the Internet is hiding from you. New York: Penguin Press.
Prior, M. (2007). Post-broadcast democracy: How media choice increases inequality in political involvement and polarizes elections. Cambridge, UK: Cambridge University Press.
Rosengren, K. E., Wenner, L. A., & Palmgreen, P. (Eds.). (1985). Media gratifications research: Current perspectives. Beverly Hills, CA: Sage.
Stroud, N. J. (2011). Niche news: The politics of news choice. Oxford: Oxford University Press.
van Rees, Kees, and Koen van Eijck. “Media Repertoires of Selective Audiences: The Impact of Status, Gender, and Age on Media Use.” Poetics 31, no. 5–6 (2003): 465–90.
Webster, J. G., & Phalen, P. F. (1997). The mass audience: Rediscovering the dominant model. Mahwah, NJ: Erlbaum.
Zillmann, D., & Bryant, J. (Eds.). (1985). Selective exposure to communication. Hillsdale, NJ: Lawrence Erlbaum Associates.
Zillmann, D., & Vorderer, P. (2000). Media entertainment: The psychology of its appeal. Mahwah, NJ: Lawrence Erlbaum Associates.