Chapter 2
Understanding Database Schemas and Dimensions
This chapter covers portions of Objective 1.1 (Identify basic concepts of data schemas and dimensions) of the CompTIA Data+ exam and includes the following topics:
 Schema concepts
- Snowflake and star schemas
- Slowly changing dimensions
- Keeping current information
- Keeping historical information
For more information on the official CompTIA Data+ exam topics, see the Introduction.
This chapter covers topics related to database schemas, particularly snowflake and star schemas. In addition, it explores the importance of keeping database information in current and historical formats.
Schema Concepts
We have already established the fact that data is a key component for business growth and to accelerate the presence in today’s competitive market. Due to the increasing focus on the value of data, organizations are collecting massive volumes of data—running into petabytes—across data warehouses and data lakes.
Data is most useful if it is stored in a structure that is easy to understand and gives logical descriptions of and shows relationships between data objects. A schema represents the structure of the database. It shows how the data is arranged and the relationships among the data objects, such as tables, fields, packages, views, relationships, primary keys, and foreign keys. A schema is not data; rather, it provides information about the structure of data and relationships among tables or models. A database schema specifies which tables or relationships form a database and the fields included in each table.
There are three types of schema:
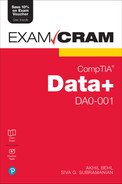
 Physical schema: A physical schema represents how data is stored physically in a disk storage or other storage system in the form of files. A database that is designed physically is known as a physical schema.
- Logical schema: A logical schema specifies the logical constraints that can be applied to the stored data. It shows the integrity constraints, which are rules that are used to maintain quality for insertion and update of data in a database management system. Entity relationship modeling is a process that specifies the relationships between the entities.
- View schema: A view schema describes the end user’s interaction with a database system.
Note
A view can be described as a virtual table in the form of a predefined SQL query. A view can contain selected rows and can be created from multiple tables.
Figure 2.1 illustrates the three schemas.
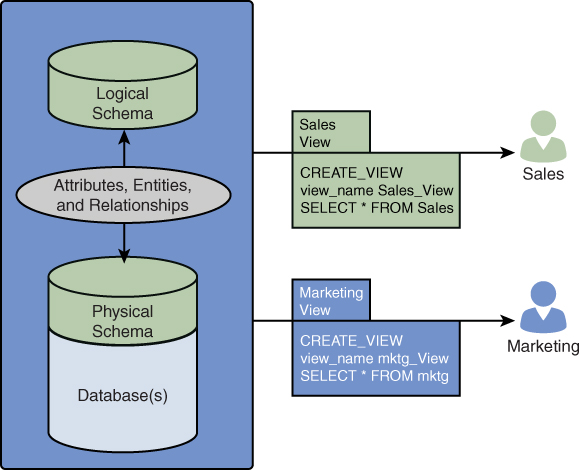
Figure 2.1 Three Types of Database Schemas Logical, Physical, and Views
Note
The process of creating a database schema is called data modeling.
Two data warehouse schemas are very commonly used:
- Star schema
- Snowflake schema
Before we get into the nuts and bolts of these schemas, let’s take a moment to consider the importance of schemas in a data warehouse. As established in Chapter 1, “Understanding Databases and Data Warehouses,” a typical data warehouse may store data from multiple data sources. Dimensional modeling provides the support needed for the high volume of queries against the data in a data warehouse. Dimensional modeling optimizes a database for faster retrieval of data.
Note
Ralph Kimball developed the concept of dimensional modeling based on “fact” and “dimension” tables. You’ll learn more about fact and dimension tables later in this chapter.
The structure and storage of data in a data warehouse are designed such that the data warehouse can accommodate and decrease the time required for processing of complex multidimensional queries.
Dimensional modeling is implemented by using the star schema and the snowflake schema in data warehouses. These dimensional models have a unique method of data storage and offer specific advantages that are covered in this chapter.
The elements of a dimensional data model are as follows:
- Facts: As the name implies, facts are the quantified metrics or measurements from a business process perspective. In an organization, from a sales perspective, a fact would be sales of a product and retirement of the quota associated with that product.
- Dimensions: A dimension provides the context around a fact in that it defines the what, why, when, who, how, and so on. Again, in an organization, from a sales perspective, a dimension could be the type of product, how much of it sold in the last quarter, the profit margins, why it could not do as well as predicted, which salespeople reported an increase in volume sales of the product, and so on.
- Attributes: The attributes are the characteristics of the dimensions, such as where the product sold well (in which states or cities) or the average age of consumers.
- Fact table: The fact table is the primary table in dimension modeling, and it contains aggregate measures or data (from facts) as well as the foreign key to the dimension table(s).
- Dimension table: A dimension table contains the associated dimensions about the fact(s). As described previously, a dimension table is joined to a fact table by a foreign key. There may be one or more dimension tables associated with a fact table.
ExamAlert
Facts and dimensions are an important topic pertinent to database schemas.
Star and Snowflake Schemas
ExamAlert
The snowflake schema is becoming increasingly pertinent in data warehousing and has been adopted widely across data warehousing applications. The CompTIA Data+ exam is likely to focus on this schema.
Star Schema
A star schema, as the name implies, is a star-shaped schema that consists of a star structure with one (primary) fact table and a number of associated dimension tables. The star schema supports querying for large datasets.
Figure 2.2 illustrates the star schema.
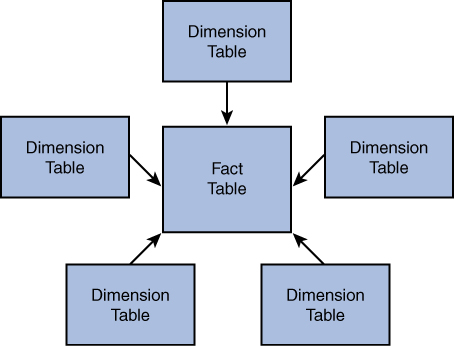
Figure 2.2 Star Schema Representation
You have already learned a bit about fact tables and dimension tables. In this section, we’ll look at them more closely.
You already know that a fact table contains facts, and it is connected to a dimension table via a foreign key. Further, a fact table has two types of columns:
- Column that contains facts
- Column that contains foreign keys to the dimension table
The fact table consists of a primary key, which is usually a composite key made up of all the foreign keys. The facts in the fact table include either detail-level facts or aggregated facts.
The dimension table is composed of one or more hierarchies that classify the data. If there are no hierarchies in a dimension table, then it is termed a flat dimension or a list. The primary keys of a dimension table are components of composite primary keys of the fact table. The attributes of a dimension table are descriptive and textual values. A dimension table is smaller in size than a fact table.
To put all this information about fact and dimension tables into context, let’s look at an example. Consider the following fact table, called Sales_Revenue:
Table Sales_Revenue
Sales Revenue |
Product_Number |
Region_ID |
Customer_ID |
Sales_RepID |
Target_ID |
Now consider the dimension tables Product_Number, Region_ID, and Customer_ID that expand on the Sales_Revenue fact table:
Tables Product_Number, Region_ID, Customer_ID, and Sales_RepID
Product_Number | Region_ID | Customer_ID | Sales_RepID | Target_ID |
Product_SaaS_ID | SaaS_Govt | Customer_Name | Sales_Rep_Name | Sales_Rep_SFDC |
Product_SaaS_List_Price | SaaS_Public_Sec | Customer_SFDC_ID | Sales_Rep_Product_SaaS | Sales_SaaS_Target |
Product_PaaS_List_Price | PaaS_Govt | Customer_Industry | Sales_Rep_Product_PaaS | Sales_PaaS_Target |
Product_SaaS_Demographics | PaaS_Public_Sec | Customer_Existing_Assets | Sales_Rep_Govt_Sec | Sales_SaaS_Quota |
Product_PaaS_Demographics | SaaS_Others | Customer_Renewals | Sales_Rep_Public_Sec | Sales_PaaS_Quota |
Note
This example shows only some of the dimension tables involved in this schema.
Based on this example, Figure 2.3 outlines the way the star schema would look.
Figure 2.3 Star Schema for the Sales Example
Following are the key characteristics of the star schema in this example:
- Each dimension is represented by only one dimension table.
- The fact table consists of a key and a measure.
- Each dimension table consist of a set of attributes.
- The dimension tables are joined with the fact table via foreign keys.
- The dimension tables are not joined to each other directly.
- The performance compared to that of the snowflake schema is better as the structure is simpler, and queries are faster.
Next, we will cover the snowflake schema.
Snowflake Schema
The snowflake schema is an expansion or extension of the star schema in that the dimension tables are further connected to sub-dimension tables. The representation of the fact table, dimension tables, and sub-dimension tables resembles the shape of a snowflake—hence the name snowflake schema. Figure 2.4 shows the structure of the snowflake schema.
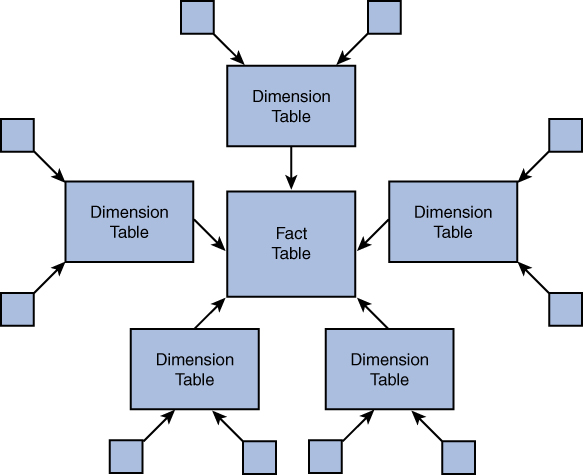
Figure 2.4 Structure of the Snowflake Schema
As shown in Figure 2.4, the fact table is surrounded by dimension tables; and in addition, sub-dimension tables are associated with dimension tables through a many-to-one relationship. Each dimension table represents one level in the hierarchy that is extended by one or more sub-dimension tables. There is no limit to the sub-dimensions that can be created for a given dimension table.
Consider the sub-dimension tables for the dimension tables Product_ID and Sales_Rep_ID:
Dimension Table Product_Number with Sub-dimension Tables Product_PaaS and Product_SaaS
Product_PaaS | Product_Number | Product_SaaS |
Product_PaaS_Cloud | Product_SaaS_ID | Product_SaaS_Cloud |
Product_PaaS_Hybrid | Product_SaaS_List_Price | Product_SaaS_Hybrid |
| Product_PaaS_List_Price |
|
| Product_SaaS_Demographics |
|
| Product_PaaS_Demographics |
|
Dimension Table Sales_RepID with Sub-dimension Tables Sales_Rep_Info and Sales_Rep_Funnel | ||
Sales_Rep_Info | Sales_RepID | Sales_Rep_Funnel |
Sales_Rep_Address | Sales_Rep_Name | Sales_Rep_SaaS_Funnel |
Sales_Rep_Education | Sales_Rep_Product_SaaS | Sales_Rep_PaaS_Funnel |
Sales_Rep_Age | Sales_Rep_Product_PaaS | Sales_Rep_Total_Funnel |
| Sales_Rep_Govt_Sec |
|
| Sales_Rep_Public_Sec |
|
Figure 2.5 shows these tables in the snowflake schema.

Figure 2.5 Snowflake Schema for the Sales Example
The key characteristics of the snowflake schema are as follows:
- The performance is slower compared to that of the star schema due to the presence of multiple tables.
- The schema is easier to implement than the star schema primarily due to the extensive use of dimension tables.
- The snowflake schema normalizes information.
- Operational maintenance of the snowflake schema is difficult because there are many tables.
Note
Normalization is the process of structuring database tables in order to reduce data redundancy and improve data integrity.
Table 2.1 provides an overview of the differences between the star and snowflake schemas.
TABLE 2.1 Star Schema vs. Snowflake Schema
Characteristic | Star Schema | Snowflake Schema |
Structure | The star schema contains one fact table that is surrounded by one or more dimension tables. | The snowflake schema is an extension of the star schema in which there are sub-dimension tables that are connected to the dimension tables. |
Design complexity | The design of the database is simple because there are no sub-dimension tables. | The presence of sub-dimension tables makes the database design complex. |
Data redundancy | There is a high level of data redundancy. | There is a very low level of data redundancy. |
Data structure | The data structure is denormalized. | The data structure is normalized. |
Foreign keys | The number of foreign keys is low, which means the query time is fast. | There are many foreign keys, which means it takes more time to process the queries. |
Suitability and relationships | The star schema is suitable for data marts with simple relationships. | The snowflake schema is suitable for data warehouses with complex relationships. |
Use cases | The star schema is recommended for a dimension table that has a small number of rows of records. | The snowflake schema is recommended when there are multiple dimension tables with multiple rows or records because it reduces redundancy. |
Slowly Changing Dimensions, Keeping Historical Information, and Keeping Current Information
Data collected over time can be analyzed to help in guessing what will happen in the near future based on past events. It is important to understand that, as the years go by, the data stored in the past is not current and should be treated as historical data, whereas current data is just that—current information that may be leveraged for real-time decision making.
Data dimensions change gradually over time rather than over predetermined time periods or intervals. Some characteristics continue to evolve, whereas others become irrelevant. You can see this in your own life, where some experiences help you make decisions in the future, whereas others are just experiences at a point in time and have no value in the near or far future.
The following sections cover slowly changing dimensions as well as topics related to keeping current information and keeping historical information.
Keeping Current and Historical Information
Information that is current—or the “now” information in a data warehouse—is typically leveraged for purposes of producing reports, dashboards, and data-driven business metrics, which enable an organization to make informed decisions. For example, the current information about how many employees have achieved their sales targets enables a business to project the near-future sales quota that should be created for the sales reps as well as define the market cap the company should pursue.
On the other hand, keeping historical information implies that an organization has access to historical records and can base future decision making on what happened a while ago. For example, an organization might look at how product A did vs. product B across the last 3 to 5 years to determine whether there’s any reason to keep the lower-performing product in the market when investment in R&D of the higher-performing product would yield better results that drive the organizational goals and keep it ahead of competition.
In order for an organization to effectively and efficiently use a data warehouse, the data warehouse must be designed such that users are able to analyze historical and current information and drive decisions based on data points.
Slowly Changing Dimensions
Slowly changing dimensions (SCDs) refers to the concept where data dimensions in a data warehouse contain both current and historical data, and the data dimensions change over time (though not necessarily periodically). SCDs are mostly seen as a progressive factor among data engineers, administrators, architects, and consultants as they have to manage and keep on top of changing attributes.
ExamAlert
Slowely changing dimensions is a key topic and expect to see questions on it in CompTIA Data+ exam.
Why keep both current and historical data in a data warehouse—and why bother keeping historical data at all? The rationale for keeping historical data has already been mentioned: Analyzing historical data can help in making future decisions. Whether to keep historical data is largely a business decision that is likely to be governed by the business needs and goals of an organization. A business may require historical insights to reflect on what is possible tomorrow to drive sales, for example.
To further contextualize SCDs, let’s take a look at an example. In an organization, the sales department has to maintain data for its customers as well as sales reps and products. As time progresses, sales representatives may move on from the organization. Moreover, customer accounts may change as the organization acquires new customers and loses old ones. In addition, the organization’s products will continue to evolve, with new versions/releases replacing old ones. In this case, keeping track of how many customers have been acquired or lost is an important metric for the business to have and will drive its decisions related to attracting and retaining more customers. The product lines that are no longer relevant may just be archival data; this data would not have any impact on future products. Finally, the data related to sales reps who are no longer with the organization can provide valuable insights on controlling attrition in the workforce.
Let’s take a look at the various SCDs and how they can help organizations adopt effective ways to manage the information in their data warehouses.
Slowly Changing Dimension Type 0
SCD type 0 refers to data attributes that never change. These attributes will continue to persist as is and will not be updated in the data warehouse. An example would be the date the organization was established as this is an attribute associated with an immutable fact about the organization. You would not expect this specific dimension to change in the data warehouse. The advantage of SCD type 0 records is that they never require updating and are persistent.
Slowly Changing Dimension Type 1
SCD type 1 data is new information; with this type, the latest snapshot of the record overwrites the earlier data in the data warehouse. In other words, no historical records are kept. An example would be an employee changing their marital status. Because this is an attribute associated with the employee, keeping any historical records would not have any meaningful context or outcomes.
Another example would be the type of customer record. For instance, as shown in the following tables, the customer field Cust_Type changed from Retail to Corporate. However, the business records would not gain much from keeping this historical information.
Before the Change
Cust_ID | Cust_Name | Cust_Type |
C001 | Alex Murphy | Retail |
After the Change | ||
Cust_ID | Cust_Name | Cust_Type |
C001 | Alex Murphy | Corporate |
The key advantage of SCD type 1 is that it offers an easy solution to handle the SCD issues as there is no need to keep track of the historical information. One the other hand, the disadvantage is that all history is lost, and it is not easy to trace back older records.
Slowly Changing Dimension Type 2
SCD type 2 refers to new data that is added in new rows; it does not overwrite the old data. Hence, all the historical data is kept intact for future use. This is a common approach for maintaining and leveraging historical records along with current data. However, a large data warehouse is needed to store all the current and historical data. Hence, the usability of the data should be evaluated to determine whether the data is required for business reports. Here’s an example of changing dimensions and leveraging SCD type 2:
Before the Change
Cust_ID | Cust_Name | Cust_Type | Start_Date | End_Date | Current_Customer |
C001 | Have More | Retail | 1.1.2020 | 31-12-9999 | Y |
After the Change
Cust_ID | Cust_Name | Cust_Type | Start_Date | End_Date | Current_Customer |
C001 | Have More | Retail | 1.1.2020 | 31-12-2020 | N |
C002 | Jacky’s Spaceships | Corporate | 22.2.21 | 31-12-9999 | Y |
Slowly Changing Dimension Type 3
SCD type 3 refers to data added in new columns. This is very similar to type 2, but instead of adding rows in type 2, type 3 adds columns for new dimension attributes. When one of the attribute value changes, the old value is moved to a separate column, and the current column is updated with the new value. The following example shows how the rep’s department change is reflected.
Before the Change
Rep_ID | Rep_Name | Profile | Salary_Annual | Rep_Dept_Current |
R001 | Satya Singh | Consultant | $50000 | Retail |
After the Change
Rep_ID | Rep_Name | Profile | Salary_Annual | Rep_Dept_Current | Rep_Dept_Old |
R001 | Satya Singh | Consultant | $50000 | Corporate | Retail |
Note
SCD type 2 is much more commonplace than SCD type 3.
Slowly Changing Dimension Type 4
SCD type 4 refers to the data changes handled by creating and maintaining a new table altogether for historical information and keeping the original table updated with current data. This approach leads to the creation of multiple historical information tables in a data warehouse. Type 4 is not common.
The following example, which builds on the previous one, shows an employee changing roles/profiles within an organization that uses SCD type 4.
Current Table
Rep_ID | Rep_Name | Profile | Salary_Annual | Rep_Dept_Current |
R001 | Satya Singh | Consultant | $50000 | Corporate |
Historical Table
Rep_ID | Rep_Name | Profile | Salary_Annual | Rep_Dept_Current |
R001 | Satya Singh | Graduate Hire | $30000 | Corporate |
What Next?
If you want more practice on this chapter’s exam objective before you move on, remember that you can access all of the Cram Quiz questions on the Pearson Test Prep software online. You can also create a custom exam by objective with the Online Practice Test. Note any objective you struggle with and go to that objective’s material in this chapter.