Chapter 1
Understanding Databases and Data Warehouses
This chapter covers portions of Objective 1.1 (Identify basic concepts of data schemas and dimensions) of the CompTIA Data+ exam and includes the following topics:
 Databases and database management systems
- Relational databases vs. non-relational databases
- Data warehouses
- Data lakes
For more information on the official CompTIA Data+ exam topics, see the Introduction.
This chapter covers topics related to databases, data warehouses, and data lakes, as well as key topics related to relational and non-relational databases. Databases and database systems are an indispensable component of our life that impact both trivial and very complex transactions online and offline. Data warehouses and data lakes enable modern systems to leverage information—which may be structured or unstructured—for analytics. Understanding the types of databases, data warehouses, and data lakes helps you understand the role they play as well as the key aspects of their existence in organizational constructs.
Databases and Database Management Systems
A database can be defined as a collection of related data (or datasets). This data might include names of people, their ages, their addresses, their phone numbers, their Social Security numbers, and so on. While this sort of data can exist in various shapes and forms (for example, in a physical notebook or a file), it is most useful for analysis, storage, and retrieval purposes to store it in a computer system. Computer programs can then access the data as and when required, which in turn allows humans to access and make decisions or carry out pertinent tasks.
Consider a simplified view: A database is a collection of related data that can be stored in a rational and organized manner. For example, an organization’s accounting department would need access to details such as the following about every employee:
 First and last name
- Bank information
- Address
- Department
- Contract rate (for example, permanent or contractual and hourly rate)
All this information is needed in order to keep track of employees’ hours worked and issue the appropriate compensation. Without a way to order and access information about employees, trivial tasks such as issuing bank transfers toward the end of month to pay the employees won’t be possible.
Note
Data can be documented and indexed using software such as Microsoft Access or Excel on an individual’s system. However, approaching data this way is not useful unless the right people have access to the data in order to gain insights and drive the outcomes desired. Storing data in a database makes the data much more usable as it acts as a centralized repository of information for the organization.
Another key example where a database is required is when you make a booking with a hotel and pay for your stay. In the process, you select the room type, the amenities, including breakfast in your room rate, and so on, and your reservation is created in the hotel’s database by the database operator. In addition, based on your membership level with that hotel chain (silver, golden, platinum, and so on), you may get additional perks. Because the hotel chain’s database holds information on your status, your perks are automatically added for each stay. This is a good example of the importance of databases in our daily lives.
Table 1.1 shows a very simple relational database.
TABLE 1.1 Employee Database
Employee_id | Firstname | Lastname | State | Department |
L00220 | Kate | Mayer | NJ | Sales |
L00230 | Smith | Yale | TX | HR |
L00240 | Anna | Shoup | FL | Finance |
L00250 | Sammy | McDonald | CA | Marketing |
Data can be stored in a number of ways, including:
- Structured data
- Unstructured data
- Semi-structured data
Note
To define a database, it is key to define the structure of the records by specifying the different types of data elements to be stored in each record. You can further define the type of database that can be created: relational or non-relational.
It is important to understand why data must be stored in a specific format as well as the advantages and disadvantages of one format over the other. Chapter 4, “Understanding Common Data Structures and File Formats,” covers these aspects in more detail.
The next section covers the topic of DBMS.
Database Management System (DBMS)
A database management system (DBMS) is an electronic system that enables users to create and manage a database containing up-to-date and relevant information.
Note
The term electronic system has been used to call out that DBMSs are digital systems, as opposed to the physical files or folders that served as organizational data stores a few decades ago.
While users can access data from a database directly, the process is not intuitive. The information may be segregated across multiple fields and structured in a way that forces the user to search through a number of fields—which is tedious and error prone.
A DBMS enables users to run queries to find the data they’re after, which facilitates the processes of describing, constructing, operating, and sharing databases among the users in an organization as well as the applications that need access to the data. Examples of commonly used DBMSs include:
- Microsoft SQL
- Oracle SQL
- PostgreSQL
- MongoDB
- RedShift
Following are the highlights of DBMSs:
- A DBMS offers a centralized view of data that can be accessed by multiple users or applications (via connectors or APIs).
- A DBMS abstracts the physical and logical construct of data from the users; that is, it allows users to interact with the database without knowing where it is located.
- A DBMS acts as a broker between the user and the database. DBMS enables database administrators to implement authentication, authorization, and logging, thereby limiting what each type of user can see and do with the data they have access to.
DBMSs offer the following functionalities for users and administrators, depending on the rights they are assigned:
- Create databases
- Backup and restore databases
- Connect to and manage multiple local and remote databases
- Create tables in databases
- Create, read, update, and delete (CRUD) data in databases
- Query data in databases
- Set up multiple user accounts and roles as well as apply permissions to access data objects
A DBMS also stores the database definition in the form of a database catalog or dictionary. This descriptive information, called metadata, is data about data. (Refer to Chapter 4 for more information on metadata.) A data catalog is an organized inventory of all data assets, such as structured and unstructured data, data visualizations, and data reports. A data dictionary contains the metadata.
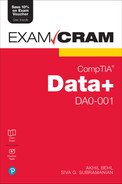
Figure 1.1 illustrates a DBMS, including users, applications, databases, and the flow of information.
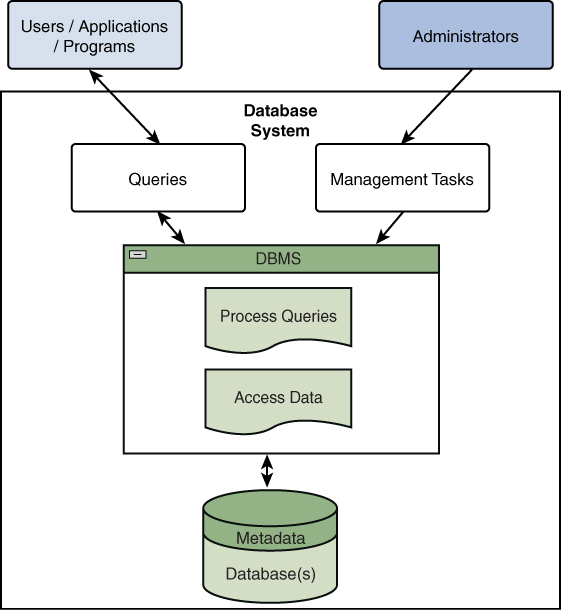
Figure 1.1 A DBMS, Including Users, Applications, and Programs
As Figure 1.1 illustrates, there are two main types of connectivity to DBMSs:
- User/application/program: Primarily focused on queries made to the DBMS for extracting and changing/updating data from the underlying databases by the end users and apps
- Administrative: Primarily focused on management of data as well as databases via DBMS
Note
A DBMS is seen as an abstraction layer between the databases and the consumer, and it offers capabilities that are much more refined than direct access to the databases.
Next, we will discuss relational and non-relational databases and how records may be arranged.
Relational Database
A relational database is quite simply defined as a database in which data is stored in tables. Tables consist of columns and rows. Table 1.2, which expands on Table 1.1, illustrates what a relational database looks like in the real world.
TABLE 1.2 Employee Relational Database
Table Employee_Details | ||||
Employee_id | Firstname | Lastname | State | Department |
L00220 | Kate | Mayer | NJ | Sales |
L00230 | Smith | Yale | TX | HR |
L00240 | Anna | Shoup | FL | Finance |
L00250 | Sammy | McDonald | CA | Marketing |
Table Salary | ||
Salary_Code | Salary_Weekly | Employee_id |
1A220 | 2000 | L00220 |
2B230 | 1500 | L00230 |
3C240 | 1500 | L00240 |
4D250 | 1000 | L00250 |
In many ways, a relational database might seem similar to an Excel spreadsheet; however, there are some key differences, including the following:
- A relational database breaks data into multiple tables.
- A table consists of rows and columns.
- The data within each row is referred to as a record.
- A column defines the data types, such as char, varchar, and integer.
- Each row is uniquely identified by the respective primary key column.
- Rows in one table are related to rows in another table via a foreign key.
In the example shown in Table 1.2, Employee_id is the primary key for the Employee_Details table. As part of the Salary table, Employee_id is the foreign key, and the primary key is Salary_Code. These keys relate the two tables—hence the term relational database.
Note
The relational part of relational database is the feature that allows a connection (that is, relationship) between different tables in a database, as shown in Table 1.2, via primary and foreign keys.
Relational databases can be operated using Structured Query Language (SQL). SQL isn’t a database type itself; rather, it is a language that is used to create, modify, and query data in a relational database. SQL is the basic language used in database management systems.
Fun Fact
Authors came across SQL during their university days working with OracleDBMS version 9. SQL is a fairly simple language, and anyone can learn it quickly.
The tables in a relational database can be joined to make it easier for a user to understand the relationships in the data. SQL has the ability to do basic mathematical operations such as counting, adding, grouping, subtotaling functions, and making logical transformations. Data analysts can view a table in different orders, such as by date, name, or any other column name available.
Common examples of relational databases include:
- Oracle
- MySQL
- PostgreSQL
- Microsoft SQL Server
DBMSs That manage relational databases are known as relational database management systems (RDBMSs).
Some advantages of RDBMSs are as follows:
- Relational databases work well for structured data and offer quick lookups and query times that are typically very fast.
- RDBMSs offer flexibility as SQL is a well-known standard language, and almost every RDBMS tool supports SQL queries.
- There are multiple on-premises and cloud RDBMS solutions available, and making the transition from an on-premises to a cloud-based RDBMS is not very complex.
- RDBMSs offer reduced redundancy by offering data normalization.
- RDBMSs offer ease of backup and disaster recovery by automating data backup jobs.
Relational databases are ideal for transactional processing, such as website user authentication or e-commerce transactions. You’ll learn more about this later in the chapter, in the section “Online Transactional Processing (OLTP).”
Non-relational Databases
Non-relational databases (also called NoSQL databases) do not use tables to store data. Instead, they employ a different method of storing data.
Note
Non-relational/NoSQL databases are so named because they do not require SQL for managing data.
Because there are no tables in non-relational databases, there is no need to connect tables. The simple design of a non-relational database increases scalability. Social media, mobile applications, and data analytics are some of the most common examples of where NoSQL databases are often leveraged.
ExamAlert
NoSQL databases are very popular among data scientists and data engineers and are a common offering with most cloud platform providers. Expect to see questions on NoSQL databases on CompTIA Data+ exam.
There are four types of non-relational databases:
- Document data stores: In a document data store, the data is stored in document format. Usually, the data is stored as Java Script Object Notation (JSON) documents in a semi-structured format. This type of data store keeps the data together and available for developers to access as part of their code (since it’s already in JSON or JSON-like format such as YAML or XML), thereby decreasing the processing required to make data insights. The data structures can be changed within a document to offer more flexibility to developers. Common examples of NoSQL document data stores are MongoDB, DocumentDB, and Cosmos DB.
- Columnar data stores: A columnar data store is a NoSQL database in which the data is stored as columns. The columns are grouped together into column families, each of which consists of a set of columns that are logically related and can be retrieved or manipulated as a unit. Whereas in a relational database the data is optimized across rows, in a columnar data store the data is optimized for fast retrieval of columns. A columnar database can store unstructured or semi-structured data. Figure 1.2 shows a columnar database using the Employee database example from earlier in this chapter. Examples of columnar data stores include MariaDB, RedShift, and Apache HBase.
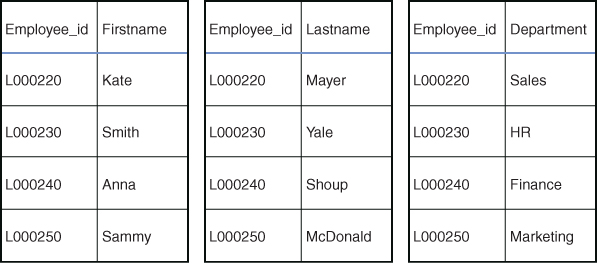
Figure 1.2 Columnar Data Store
- Key/value data stores: Key/value data stores are the simplest form of non-relational (or NoSQL) databases. Such a data store is organized as a dictionary with key/value pairs. Each unique record consists of a key and value. A dictionary contains a collection of records, which are stored and retrieved using a unique key.
Figure 1.3 provides an example of a key/value data store in which major Indian cities are listed as keys pointing to specific cities (values) across northern and southern India.
Figure 1.3 Key/Value Data Store
- Graph data store: In a graph data store, the data is stored as knowledge graphs. The nodes of a graph can be persons, objects, or places. Graph data stores work by storing data alongside relationships; by retrieving a relationship, you can describe the related data. This may seem quite different from the concept of a relational database, with data stored based on relationships. Graph data is usually used for storing and managing the network of connections between the elements in the graph. Figure 1.4 illustrates a graph database. In this graph, the nodes (colored bubbles) represent people and may contain data about their attributes (such as Employee_id), and the lines connecting the nodes show the relationships.
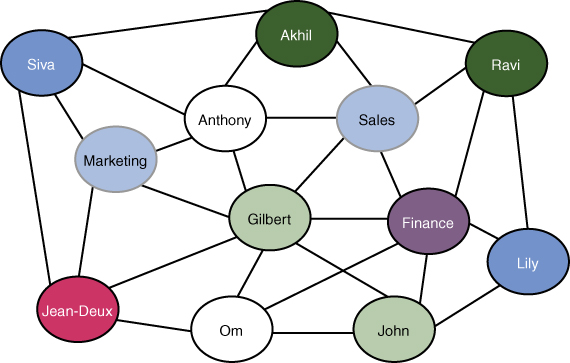
Figure 1.4 Graph Data Store
The key advantages of non-relational databases are as follows:
- They provide a very flexible structure for storing semi-structured or unstructured data as documents, graphs, keys and values, and so on.
- NoSQL databases are recommended for big data operations as well as analytics as the speed of data retrieval is very fast.
- NoSQL databases can be very cost-effective compared to structured relational databases as not all information needs to be processed, which means data can be stored in raw format.
- Non-relational databases are designed to be reliable and continuously available. Many modern cloud first databases are NoSQL.
Note
Many database management systems today are multi-model. For example, relational database systems often include aspects that are typically associated with NoSQL, such as document stores, column stores, and graphs.
Table 1.3 summarizes the differences between relational and non-relational databases.
Table 1.3 Differences Between Relational and Non-Relational Databases
Chracteristic | Relational Database | Non-Relational Database |
Data storage | Data is stored in tables. | Data is stored in non-tabular format as documents, graphs, or key/value pairs. |
SQL vs. NoSQL | Relational databases are also called SQL databases. | Non-relational databases are also known as NoSQL databases. |
Joining | The tables can be joined together. | There is no joining function. |
Data volume | Not suitable for processing large volumes of data. | Can process large volume of data. |
Structured, Unstructured vs. semi-structured data | Only structured data can be stored in SQL databases. | Unstructured and semi-structured data types are commonly stored in NoSQL databases. |
Examples | MySQL and PostgreSQL are examples. | Cassandra and MongoDB are examples. |
Data Warehouses and Data Lakes
Organizations have evolved over the past years, and their data requirements have evolved as well. While in a traditional manner, data related to employees and customers is still very important, organizations are well on their way to being more competitive by conducting analysis on the voluminous data they have from offline and online transactions. This data is primarily used to drive data-based decision making, whether for IT budgets or for making decisions about investing in lines of business or new products to launch.
Data is not all created equal, and neither are the ways of dealing with data. There are heaps of structured data, and there’s even more unstructured data (which is being generated as part of online activities, such as posts, searches, and so on). While data warehouses were created out of the need to structure data in a singular manner to make sense of it, data lakes were conceptualized primarily to cater to modern challenges to dig more deeply into heaps of data.
Again, not all analytics were made the same, and while some leverage real-time (or streaming) data based on a data lake, other analytics may be dependent on piles of data being pushed together to a data warehouse—in other words, batch data.
The following sections explain concepts related to data warehouses and data lakes.
ExamAlert
Data warehouses and data lakes are very commonly used by cloud providers and are likely to be included on the CompTIA Data+ exam.
Data Warehouses
A data warehouse is a centralized repository of data that is predominantly used for business analytics and business intelligence. The key purpose of a data warehouse is to offer insights for future decision making based on historical data.
It is key to note that a data warehouse only supports structured data and well-defined schemas. A data warehouse supports a schema-on-write approach that follows a predefined schema for the data.
A data warehouse may contain information from multiple organizational sources. The key functions of a data warehouse are as follows:
- Data extraction
- Data cleansing
- Data transformation
- Data loading/refreshing
Figure 1.5 illustrates the concept of a data warehouse.

Figure 1.5 Data Warehouse Overview
Note
The data in a data warehouse is read-only as the CRUD operations are performed at the data source level, typically as part of OLTP systems. Batch data is pushed to data warehouses for point-in-time analytics.
As shown in Figure 1.5, a data warehouse consists of multiple components:
- Data sources: The source of data to be processed and analyzed; the data is typically online transactional processing (OLTP) data.
- ETL tools: Extract, transform, and load (ETL) tools are used to extract data from data sources and cleanse the data as well as transform it before loading it in the data warehouse.
- Database: Data warehouses leverage RDBMSs as data management tools.
- Data: The data in a data warehouse is the raw data from OLTP systems, and this raw data is used to derive metadata and summary data.
- Query tools: Tools such as query and reporting tools as well as data mining applications enable users to analyze data and interact with a data warehouse.
- Analytics and reporting: Users can leverage reports to drive decision making.
The data in data warehouses is structured, processed data that results from ETL processes and can be leveraged by queries and data mining tools.
Data warehouses can be architectured in three ways:
- Single-tier architecture: A single-tier architecture can store a minimum amount of data and is focused on getting data only from a restricted number of sources as well as data de-duplication. This architecture is not widely used at an enterprise level.
- Two-tier architecture: A two-tier architecture separates the physically available data source(s) from the data warehouse. Such an architecture is not expandable and hence is not commonly used by large organizations focusing on multiple users and multiple data sources.
- Three-tier architecture: This architecture consists of three tiers: top, middle, and bottom. The top tier is a front-end client layer that contains tools such as query, reporting, analysis, and data mining tools. The middle tier is an OLAP server that acts as a mediator between an end user and the database. The bottom tier is a relational database system in which data is cleansed, transformed, and loaded using tools from the back end.
Some common examples of data warehouse solutions are:
- AWS RedShift
- Azure SQL Data Warehouse
- Oracle Data Warehouse
The key advantages of leveraging a data warehouse are as follows:
- Data warehouses support quick access to critical data and metadata.
- Data warehouses integrate data from multiple data sources.
- Data warehouses reduce turnaround time in the process of analyzing the information.
- Data warehouses enables users to analyze data from different time periods to make future predictions.
- Data warehouses provide consistent information by virtue of their dependency on RDBMSs.
Data warehouses also have some key disadvantages:
- As data warehouses are based on RDBMSs, unstructured data cannot be stored in them.
- It is difficult to alter data types and data source schema, as data warehouses can only ingest structured data that fits predefined schemas.
There is a subset of a data warehouse called a data mart that is typically used by a specific set of users in an organization. The core purpose of a data mart is to partition a smaller set of data to provide easier data access for specific targeted groups within an organization. For example, a sales data mart could be used by a sales department to know the details about sales statistics related to a newly launched product. No other department would have access to the sales data mart.
Figure 1.6 illustrates the various data marts that could be created to cater to specific lines of business.
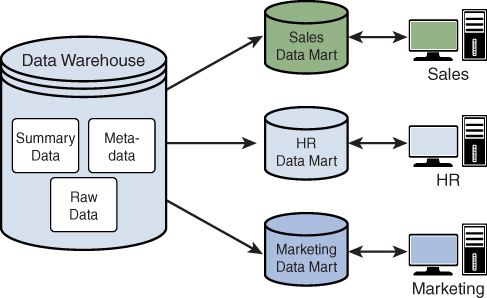
Figure 1.6 Data Mart Overview
Three types of data marts can be created, depending on an organization’s requirements:
- Dependent data mart: This type of data mart is created from the existing enterprise data warehouse and follows a top-down approach, with all pertinent data extracted according to the analysis requirements. Because it leverages the existing data warehouse and extracts only meaningful data partitions, the only additional work is related to defining the data required by the respective line of business. A dependent data mart can be seen as a subset of a data warehouse.
- Independent data mart: This type of data mart is a standalone system that is created without the use of the enterprise data warehouse. It follows a bottom-up approach in that it has its own ETL specifics for extracting, processing, and storing or retrieving data as and when needed. An independent data mart can be seen as a much smaller-scale data warehouse.
- Hybrid data mart: This type of data mart is a combination of a dependent data mart and an independent data mart. It uses both top-down and bottom-up approaches for managing the data, with existing interesting data captured from the data warehouse and new interesting data extracted from source systems directly.
The next section covers the insights to data lakes.
Data Lakes
A data lake is a large data storage repository that can store structured, semi-structured, and unstructured data from multiple data sources. It can also contain raw data as well as processed data. Think of a data lake as a data warehouse on steroids. The major advantage of a data lake is that the data need not be processed before it is stored, as it must be with a data warehouse.
However, the data from a data lake cannot be used directly and requires processing on the fly. Data lakes leverage a “schema-on-read” approach, which means the data is transformed at query time. In other words, whereas data warehouses use ETL, data lakes thrive on ELT (extract, load, and transform). Therefore, the resource consumption and extraction of data from data sources (such as blogs, logs, searches, and image and multimedia repositories) is extremely fast compared to consumption and extraction with traditional ETL processes, thereby reducing the cost and complexity associated with the ETL processes.
Figure 1.7 illustrates the typical structure and components of a data lake.
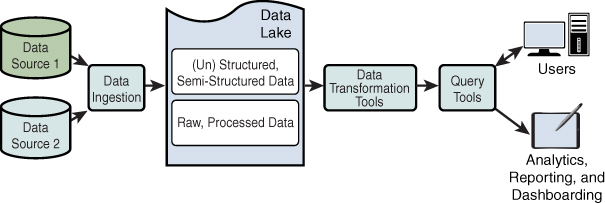
Figure 1.7 Data Lake Overview
As shown in Figure 1.7, a data lake consists of multiple components:
- Data sources: Multiple data sources from which data can be loaded to be processed and analyzed.
- Data ingestion layer: This layer is used to ingest data (in its native format) from multiple data sources. For example, media files can be imported as MP4 or JPEG files, and well-structured data from SQL databases can be imported consequently.
- Data transformation tools: A variety of tools are used for transform functions to normalize the schema and ready the data for consumption by analysts.
- Query tools: Tools such as query and reporting tools as well as data mining applications enable users to analyze the data and interact with the data warehouse.
- Analytics and reporting: Users can leverage reports or dashboards to drive decision making. Reports and dashboards are created based on analysis on the data loaded in the data lake in line with one or more use cases.
Data lake solutions have become increasingly prevalent due to the large volumes of data that need to be analyzed and the many types of people who use them, for example, data engineers, data analysts, data architects, and data scientists. A data lake is often used as part of a cloud service offering or in a hybrid arrangement with a cloud-hosted data lake with on-premises data sources. This combination of downstream analytics and reporting as well as dashboarding tools offers state-of-the-art data-based decision-making ability.
Some of the most common and popular examples of data lakes are:
- Google BigQuery
- AWS Lake Formation
- Azure Synapse
- Snowflake
The key advantages of leveraging a data lake are as follows:
- Data lakes support raw, processed, structured, semi-structured, and unstructured data from a variety of sources. They eliminate silos by offering a single repository for all data types and types of data. More on data types and types of data in Chapter 3, “Data Types and Types of Data.”
- Data lakes require no schema lock in and are therefore great for data port-ability from a variety of data types and types of data.
- Data lake solutions enable data analysts to query data in new ways and create new use cases as the business demands.
Data lakes also have some disadvantages, including:
- Data lakes are meant primarily for data analysts, data engineers, and data scientists. A much higher-than-average skillset is required to leverage the true potential of data lakes.
- Non-selective data storage from multiple data sources may imply higher storage costs.
Table 1.4 summarizes the differences between data warehouses and data lakes.
TABLE 1.4 Differences Between Data Lakes and Data Warehouses
Characteristic | Data Lakes | Data Warehouses |
Type of data | Data from all type of data sources can be stored, regardless of the data schema. | Data from OLTP systems and data with quality metrics and their attributes are stored. |
Storage | Data is typically stored in raw form and processed on the fly when queried. | Data is stored after processing and ready for queries. |
Users | Data lakes are ideal for data scientists and data engineers. | Data warehouses are ideal for operational users. |
Processing time (ingestion and analytics) | Processing time is faster. | Processing time is slower. |
ELT vs. ETL methodology | Uses ELT (extract, load, and transform) processes. | Uses ETL (extract, transform, and load) processes. |
Schema | The schema is defined after the data is stored, via a schema-on-read approach. | The schema is well defined before the data is stored, via a schema-on-write approach. |
Cost of storage | Data storage is comparatively inexpensive. | Data storage is comparatively expensive. |
OLTP and OLAP
Online Transactional Processing (OLTP)
You have certainly used a point-of-sale (POS) system to make a card transaction using a debit/credit card or reserved a plane ticket to go on a dream vacation. It is possible, however, that you haven’t recognized that those systems leverage OLTP. Think about it: You wouldn’t wait hours for a merchant to process your transaction; rather, you can complete a purchase by making a payment to a merchant in moments, which implies that these transactions are done in real time. OLTP transactions—including those already mentioned as well as online banking, online shopping, and ATM transactions—typically occur in milliseconds.
Note
OLTP involves real-time or streaming transaction data unlike the batch data that is pushed to a data warehouse.
OLTP is a software system that is specifically built to process transaction-focused data in a database. OLTP data stores enable large numbers of concurrent real-time transactions. It is important to note that OLTP data stores take an all-succeed or all-fail approach; that is, the transactions either succeed or fail and do not remain in an intermediate state. Figure 1.8 provides an overview of an OLTP system.
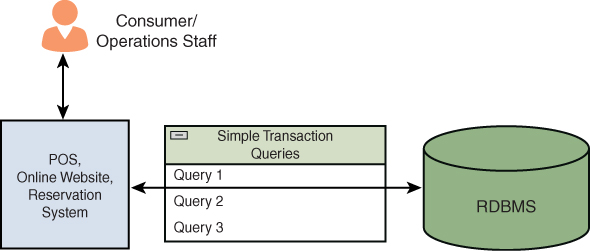
Figure 1.8 OLTP Overview
With OLTP, it is important that the transactions go as expected and that there are no hiccups because any transactional issues (including data corruption or data inconsistency) can lead to undesirable outcomes. OLTP data stores offer reliability and consistency by implementing the ACID (atomicity, consistency, isolation, and durability) design principle. ACID is a transaction management process that uses concurrency controls to ensure that consistency is maintained.
Note
ACID is not a novel concept and has been used for designing DBMSs with large numbers of concurrent transactions as well as user access to the data.
The ACID design principle has these components:
- Atomicity: This implies that all transactions always succeed or fail completely. In other words, if there’s an incomplete transaction, it is not valid.
- Consistency: This ensures that a database that was in a consistent state remains in a consistent state following a successful transaction.
- Isolation: This ensures that one transaction does not intervene or disrupt another transaction.
- Durability: This ensures that the results of a successful transaction are committed and cannot be rolled back.
As with any other database system, there are tools available to manage OLTP systems. End users and applications can manage OLTP systems via Data Manipulation Language (DML) using update, insert, and delete operations on an ongoing basis.
Following are the key tenets of OLTP:
- OLTP can process multiple concurrent simple transactions.
- OLTP maintains the integrity of the data, even when the same data is accessed by multiple users at the same time.
- OLTP provides indexed datasets, and thus, the data can be rapidly searched, retrieved, and queried.
- A complete data backup must be maintained because large transactions are processed concurrently by the users.
The next section gives insights to OLAP.
Online Analytical Processing (OLAP)
If your organization launched a new product last year and is about to launch a new version of that product, how do you know if the previous product did well in the market and how it fared against competition? How do you identify the demand patterns? How do you identify the customer sentiments? While you might have all this data available across a range of systems (such as sales records and ERP and CRM systems), there isn’t a single source of truth unless you have performed analytics on the historical data and arrived at a conclusion that can drive the success of the new release. This is where you can leverage an online analytical processing (OLAP) system for data analysis. Planning, analyzing, forecasting, and budgeting are some of the common functions that are performed by business analysts using OLAP. OLAP systems process large volumes of data from data warehouses, data marts, or any other centralized data stores and are important in business intelligence and data mining processes.
ExamAlert
OLTP and OLAP systems are used across our daily lives and CompTIA Data+ exam is likely to focus on these topics.
OLAP systems are used for various analytics, such as diagnostic, predictive, and prescriptive analytics. Unlike with OLTP systems, where the datasets are not so large, OLAP systems execute complex queries against large multidimensional databases and data lakes. Figure 1.9 depicts an OLAP system.

Figure 1.9 OLAP System Overview
Note
The idea behind OLAP is to dig in to historical information to make sense of it in order to support future decisions and to create near to far future strategy from a business viewpoint rather than an IT perspective.
Following are the key tenets of OLAP:
- OLAP supports multidimensional conceptual views of datasets.
- OLAP acts as a middle layer between a data warehouse and a front end.
- Data can be represented in advanced presentations such as 3D cubes, pivot tables, and cross tabs.
- OLAP can perform advanced computational functions and advanced data modeling functions.
Table 1.5 lists the key differences between OLTP and OLAP systems.
TABLE 1.5 Differences Between OLTP and OLAP Systems
Characteristic | OLTP | OLAP |
Use-cases | It is an online transaction system mainly targeted at concurrent transactions. | It is an online analysis and data retrieving process leveraged for data analytics. |
Processing capacity | It can process a large number of short online transactions. | It can process a large volume of data. |
Types of queries | It deals with standard and straightforward queries such as insert, delete, and update queries. | It deals with complex multi-dimensional queries that involve select functions. |
User personas | OLTP is primarily used by operational staff such as clerks and cashiers. | OLAP is primarily used by business analysts and data engineers. |
Type of data processed | It addresses current transactional data. | It addresses primarily historical data. |
Response time | Response time is milliseconds. | Response time is from a few seconds to minutes. |
Backups | Requires complete backups of data. | Requires data backups from time to time. |
Finally, it is important to know that OLTP and OLAP are not competing systems; rather, they are complementary systems. Typically, an organization has transactional data and batch data undergoing analytics and reporting. While from a business transaction perspective OLTP is key, analyzing the data is an aspect of OLAP, and this is where the two systems come together to give a holistic view into the organizational processes leading to business insights and feeding back into the process for continuous improvement.
To simplify this, let’s consider an example of a new product to be launched and look at historical performance of an earlier version of the product. An OLTP system would have the historical data based on consumer transactions and key operational insights (such as inventory management and customer surveys). This data could be leveraged by OLAP and a data warehouse/data lake to get deeper insights into what changes are required from the previous product as well as what will make the new product sell like hotcakes in the market—whether it be a launch campaign or social media publicity/ads. Figure 1.10 depicts this arrangement at a high level and on an architectural level.
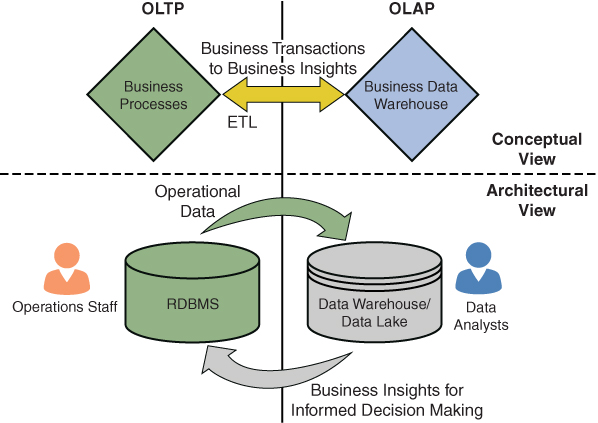
Figure 1.10 OLTP and OLAP Complementing Each Other Across Business Processes and Business Insights
The integration of OLTP and OLAP includes the following components:
- Business processes: These are the processes that the business follows to achieve the goals/outcomes set forth by the business owners/leaders.
- Customer transactions: This is information about the customers, products, and transactions stored in the OLTP database.
- ETL (extract, transform, and load): The transactional data from various relational database management systems is retrieved, transformed, and loaded in the data warehouse/data lake.
- Data warehouse/data lake: Data is accessed by the data mart from the data warehouse or from the data lake that is used by OLAP to store processed data.
- Data mining, analytics, and decision making: The data is extracted from the data warehouse/data lake through data mining, and after analysis, it is used for decision making.
What Next?
If you want more practice on this chapter’s exam objective before you move on, remember that you can access all of the Cram Quiz questions on the Pearson Test Prep software online. You can also create a custom exam by objective with the Online Practice Test. Note any objective you struggle with and go to that objective’s material in this chapter.