
5. Incorporating Market Intelligence into the Forecast
As a marketing professor, I am constantly subjected to the good-natured needling from my supply chain management colleagues. One of my favorite Dilbert cartoons constitutes one of their favorite pieces of ammunition. In this strip, Dilbert makes the observation that “Marketing is liquor and guessing.” Well, I made the point in Chapter 2, “Demand Forecasting as a Management Process.” that forecasting is, at its core, guessing about the future. I won’t agree that liquor is involved, but it is certainly the case that the “guessing” that is inherent in demand forecasting can be upgraded to “informed guessing” by the inclusion of market intelligence as a part of the forecasting process. That is the subject of this chapter—what types of market intelligence will benefit the forecasting process, and how that market intelligence can be incorporated effectively. The chapter begins by defining market intelligence, and categorizing the different types of market intelligence that can be helpful to the forecasting process. Companies can benefit from both internal sources of market intelligence—sales and marketing—and external sources of market intelligence—including customers. This chapter explores each of these sources and covers the advantages and risks of incorporating each type of intelligence. The chapter concludes with comments about how to consolidate all these different sources of information, both quantitative and qualitative, into a final forecast.
What Is Market Intelligence?
Here is a simple definition for market intelligence:
Market intelligence is a procedure for systematically gathering, interpreting, and disseminating insight about the market environment, for purposes of enhancing organizational decision-making.
Okay, fine, but why talk about market intelligence in a forecasting book? Chapter 2 defined demand forecasting in the following way: A demand forecast is a firm’s best estimate of what demand will be in the future, given a set of assumptions. In essence, market intelligence is the task of collecting and analyzing information about the environment so that the demand forecaster can document the assumptions that underlie the forecast. This is the information that the forecaster needs to determine how the future is likely to look different from the past. The discussion on quantitative forecasting concluded that these statistical techniques were designed to identify patterns in historical demand that can then be projected into the future. But it also concluded that very often, the future will not look like the past, and we need insight into how, and why, the future will look different—and that is the role of market intelligence.
The task, then, for the demand planner, is to identify useful and credible sources of this market intelligence. Sources are both internal and external to the firm. Chapter 4, “Qualitative Forecasting Techniques,” covered at some length some of the internal sources of information that forecasters attempt to exploit, such as sales, marketing, product management, and senior executives. External sources can include market research reports from third-party providers, government reports such as census data, academic research, and other types of published information. Another important source of external data is customers, and this chapter explores customer-provided data in detail.
Bottom-Up versus Top-Down Forecasts
Chapter 7, “World-Class Demand Forecasting,” covers best practices in demand forecasting, as well as a concept known as the forecasting point of view. Just to preview that concept, two points of view exist from which you can derive a forecast. The first is called “bottom-up” forecasting. In this approach, the forecaster essentially thinks about individual customers, or individual products. What will demand from customer A be next quarter? How about customer B? How about customer C? After all customers are considered—and often, this means all large customers are considered individually, then all small customers get bundled into an “all other” pile—the forecaster simply adds them up. The total forecast is the sum of the forecasts for each customer. A forecaster can follow a similar approach for a bottom-up product forecast. What will demand for SKU 1 be? How about SKU 2? How about SKU 3? After all the SKUs are considered, then you add them up, and get a forecast. The second point of view is a “top-down” look at future demand. When considering the problem from this perspective, the forecaster first attempts to forecast industry demand for an entire category of products. Then, the task is to forecast the company’s expected share of that industry demand. Multiply total forecasted industry demand by the firm’s forecasted share, and you get a top-down forecast. The point I make in Chapter 7 is that although both perspectives have their limitations, best practice entails using both points of view, and then doing a detailed reconciliation when the bottom-up number is materially different from the top-down number, which it often is.
Different categories of market intelligence contribute to each of these perspectives. One way to categorize sources of market intelligence is to think of them as broadly being either “macro” or “micro.” Micro-level sources of market intelligence are those that would be useful for creating a bottom-up forecast, and can be thought of as either customer based or product based. Macro-level sources are those that would be useful for creating a top-down forecast, and can be thought of as industry based. Table 5-1 provides examples of both information that is needed at both micro- and macro-levels, as well as possible sources of that market intelligence. This table is not intended to be comprehensive, nor is it necessarily even “correct” for each reader’s industry. It is intended to give examples of the types of macro- and micro-level information that demand forecasters need, and possible sources of that information. Each situation will, of course, be unique.

Table 5-1. Micro versus Macro Market Intelligence
What Do Demand Forecasters Need to Do?
It’s easy to make the assertion: “Forecasters need market intelligence.” The challenge is to figure out how to get it, and what demand forecasters need to actually do to acquire and use market intelligence to make their forecasts more valuable. Following are some strategies that demand forecasters need to adopt to make market intelligence a critical part of the demand forecasting process.
• Identify what information you need, and who is likely to have that information. In other words, take Table 5-1 as a starting point, but adapt it to your specific situation. Remember, both “What do I need?” and “Where will I get it?” are critically important, and potentially equally challenging, questions.
• After you identify those sources of information, create linkages with those people whose job it is to collect that information. In most organizations, individuals exist whose job is collecting and monitoring external, macro-level industry and market information. Further, in nearly all organizations, sales and marketing people are constantly acquiring insights about their customers and can provide micro-level customer and product information. Not only must these people be identified, but they must be incentivized to work with the demand forecasters to translate their macro- or micro-level insights into information that can be incorporated into demand forecasts. That was an easy sentence to write, but accomplishing its task is a hard! Refer to the discussion in Chapter 4 on obtaining qualitative forecasting information from sales and marketing.
• Establish a routine for documenting macro-level trends. The micro-level information should be contributed on a regular basis as a part of the qualitative judgment element of a demand forecasting process. However, companies often struggle with creating—and sticking with—a routine for bringing macro-level information into the forecasting process. These macro-level trends often change slowly, and covering the same ground in every demand review meeting can feel unduly repetitive. Some companies have a routine for quarterly reviews of macro trends, rather than as a part of the monthly drumbeat of the DSI process. Another direction taken by companies is to report macro trends only in terms of exceptions. In other words, the demand forecasters collect and monitor macro-level information monthly, but report only changes that are material to the forecasts at the demand review meeting.
• Document and validate the macro-level information that is received, especially from external sources. Not all macro-level information is as unbiased or accurate as it could be, and the firm would be loath to make strategic resource allocation decisions based on information that turned out to be questionable. The demand planners might very well be challenged at the demand review, so their establishing a process for validating the information received from external sources is advisable.
In summary, then, remember the definition of a demand forecast: A demand forecast is a firm’s best estimate of what demand will be in the future, given a set of assumptions. Think of the process of collecting, interpreting, and disseminating market intelligence as the way forecasters piece together the assumptions that underlie every demand forecast. From here, then, the discussion turns to a special case of external market intelligence: customer-generated forecasts.
Customer-Generated Forecasts
Customer-generated demand forecasts can be an excellent source of market intelligence. Manufacturers have a variety of customers from whom they could receive forecasts. The types of customers, and the types of forecasts, include the following:
• Project-based customers. As discussed in Chapter 3, “Quantitative Forecasting Techniques,” many companies have customers that issue RFPs (Requests for Proposals) for complex, multi-period, multi-product projects. For example, Honeywell Corporation has a division called HBS, which stands for Honeywell Building Solutions. This division partners with customers to provide a variety of systems that are needed to maintain the safety, security, and energy needs of large buildings or campuses of buildings. HBS bids for contracts to partner on large-scale building projects to provide these types of support services. A huge variety of products and services might be involved in the projects. After a project is awarded to HBS, the demand forecasters would benefit greatly from collaboration with the customer to forecast the timing and the mix of products that will be required as the project progresses, as well as the quantities and configurations of products that will be needed.
• OEM customers. Companies often supply raw materials or components to their customers, who then use those products as a part of their own manufacturing processes. For example, Michelin Corporation provides tires to automobile manufacturers around the world. Demand forecasters at Michelin would greatly benefit from receiving production schedules from their OEM customers, specifying the timing and the mix of tires they will require.
• Distribution and retail customers. Companies such as Hershey Foods sells most of its products through distributors or retail customers such as Walgreens. Demand forecasters at Hershey can benefit greatly from capturing end-user demand through point-of-sale (POS) data, which after netting out inventory on hand, can help them to forecast both sell-in (demand from the retailer) and sell-through (demand from consumers) demand. In addition, demand forecasters at companies such as Hershey Foods benefit from access to promotional calendars that can be used to predict store-level promotional activity, and the resulting spikes in demand.
Thus, regardless of the type of customer, benefits come from receiving customer-generated forecasts.
However, a number of issues must be addressed concerning customer-generated forecasts, including the following:
• Should we get forecasts from customers?
• If we do decide we want forecasts from customers, which customers should we work with?
• How should this forecasting customer collaboration take place?
• How should we incorporate the customer-generated forecasts into our process?
Should We Get Forecasts from Customers?
Receiving forecasts directly from customers has clear benefits. Who knows better what customers are likely to want to buy than the customers themselves? If customers and suppliers find themselves in strong, collaborative relationships, then collaborative forecasting can help both companies realize significant benefits in reduced inventories, increase fill rates, and lower costs. Chapter 1 first introduced these benefits, during the discussion of demand/supply integration across the supply chain. Figure 1-2 is reproduced here as Figure 5-1, but with questions raised about the risks or concerns associated with using customer-generated forecasts. Whenever benefits exist, usually risks or concerns exist as well, which are illustrated in Figure 5-1. The first question that a forecaster must address, then, is “Do the benefits that can be realized from receiving forecasts from customers exceed the costs?” Following are some of the risks, as shown in Figure 5-1:
1. Is the customers’ demand forecasting process effective? Even if their intentions are good, the customer might not yet have read this book, and therefore, their forecasting efforts might not lead to accurate, credible forecasts! If the customer forecasts are neither accurate nor credible, then adding their input to your forecasting process might do more harm than good.
2. Can your customers effectively translate their customer demand into clear requirements from their suppliers? This point gets at the effectiveness of the customer’s DSI processes. As we have said repeatedly, without a good DSI process in place, an accurate forecast isn’t worth very much. That forecast eventually needs to be translated into good business and supply chain decisions, and if the customer’s DSI processes are lacking, then the signal back to the supplier in terms of a demand forecast might be flawed.
3. Is the nature of the input that you receive from customers useful? Each company operates with different nomenclature, part numbers, and product hierarchies, and there will inevitably be some translation from the customer’s nomenclature to yours. The relevant question becomes: is the customer provided forecast in a format or level of detail that makes translation of their forecast into your forecast more trouble than it’s worth?
4. Is it the customers’ intent to provide you with an accurate forecast of their demand? Or do they have an agenda? Chapter 4 talked about “game-playing,” or the fact that individuals who contribute to demand forecasts often have “other agendas” that might lead them to deliver something other than an accurate forecast. One agenda discussed is the “I’ll forecast high so I’ll be sure to get what I need” game. Customers can certainly have an incentive to adopt this agenda in regard to their demand forecast. As is the case with salespeople, if customers perceive an availability problem might occur, then they might very well forecast high, hoping that the supplier will “make more” and thus avoid any shortages. One of the tricky elements of a customer-provided forecast is that this forecast is seldom perceived by the customer as a commitment. Rather, just like any forecast, it is a “best guess” about what will happen in the future. Because it is not a commitment, if the manufacturer builds what the customer has forecasted, and the customers then don’t then buy at the level they forecasted to buy, the manufacturer is the one who is left with inventory, not the customer. Thus, often little downside risk exists to the customer from providing an inflated forecast.
5. If you are asking customers to expend effort on your behalf (that is, providing you with a demand forecast), do they understand the benefit to them? Will they ask for something in return, such as discounted pricing or guaranteed supply? This is a subject upon which the demand forecaster and the sales organization can really collaborate. The demand forecasters can help the salespeople to position this request as a win-win proposition. The clear benefit to the customers comes from the enhanced product availability that comes from better demand forecasting.
6. As Chapter 6 discusses, forecasting performance is improved when feedback on accuracy and bias is provided to those completing the forecasts. Customer forecasts will be more useful if the customer is open to receiving feedback, in terms of accuracy and bias metrics. The question here is twofold. Is your firm willing to expend the effort required to provide this feedback to the customer, and is the customer receptive to receiving this feedback? Depending on the nature of the relationship, opportunity might exist to provide the customer with incentives for providing high-quality demand forecasts.
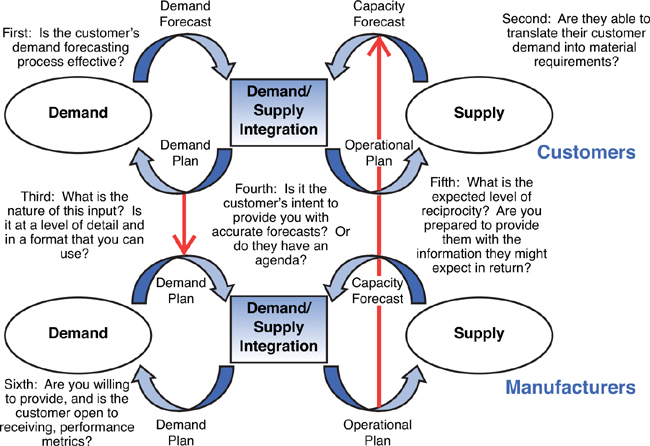
Figure 5-1. Demand/supply integration across the supply chain: the risks
The bottom line, then, is that forecasters must perform a cost-benefit analysis on the question of “Should we ask our customers for demand forecasts?” They must assess the risks such as those in the preceding list, and include those risks in their cost-benefit calculation.
If We Do Decide We Want Forecasts from Customers, Which Customers Should We Work With?
Although important benefits might be available from acquiring customer-generated forecasts, an inevitable cost exists. Adding customer input to the forecasting process also adds complexity. The likelihood is that the cost in additional complexity will at some point outweigh the potential benefits. The forecaster, then, must decide on which customers to pursue for customer-generated forecasts, and which not to pursue. How do you decide?
One way is to perform a simple Pareto analysis. For most organizations, a concentration principle is in place; where 20% of customers generate 80% of the business. In many situations, that concentration level is even greater. Many companies would find it quite straightforward to name their top 20, or 50, or 100 customers in terms of business volume, and a simple way to decide on which customers should be targets of opportunity for customer-generated forecasts is to simply pursue those “A” level customers. It is often the case, however, that critically important customers can be determined by factors other than current sales volumes. Some customers have strategic importance due to their future sales potential, high margin, or some other criteria. However determined, a “first cut” at which customers should be pursued for customer-generated forecasts are those customers who are determined to be strategically important customers.
Unfortunately, it might not be that simple. Just because a customer is an “A” level customer does not necessarily mean that they are a good customer to provide customer-generated forecasts. Additional analysis must be performed. For example, a customer might be high volume, but might be terrible forecasters! If so, the input they provide might prove to be at best useless, and at worst, dysfunctional. Further, the customer might not have a culture that embraces close collaboration with suppliers. The culture might be one where arm’s length relationships are the norm, and the idea of expending resources to provide a supplier with a demand forecast might be outside the company’s normal operating procedures. Finally, even though this customer might be highly important to the supplier, and the supplier would benefit from receiving a demand forecast, the customer might not feel that the supplier is an important enough player in its supply chain to warrant the resource expenditure.
How Should This Forecasting Customer Collaboration Take Place?
The mechanics of how customer-generated forecasts can be provided range from simple and relatively informal to highly structured and highly formalized. At the most informal end of the spectrum is a simple exchange of spreadsheets on a regular basis, with key product forecasts provided on those spreadsheets. As the next section discusses, the alignment of forecasting level can be an issue. Is the detail expressed in the customer-provided spreadsheet match up with level of detail that the demand forecaster needs? Once again, the amount of data translation required is part of the cost-benefit analysis that needs to take place. A more formal and structured approach to forecasting collaboration might involve actual face-to-face meetings between the demand forecasters and the appropriate personnel at the customer’s location. These appropriate personnel could be from supplier relations, procurement, material planning, or merchandising. Such meetings can take place on a regular basis—often monthly or quarterly, and the agendas can include the exchange of forecasts or other relevant business plans and to discuss specific problems or opportunities. I’ve worked with several companies who have regularly scheduled conference calls, accompanied by data exchanges, with their key customers, to review the numbers that are exchanged and talk through any anticipated issues.
At the far end of the spectrum in terms of formality and structure are arrangements such as Vendor Managed Inventory (VMI), or Co-Managed Inventory (CMI) or even Collaborative Planning, Forecasting, and Replenishment (CPFR1) agreements. Any of these arrangements require a substantial investment of resources, both human and technical by both parties—supplier and customer—from which significant benefit can be gained. Because of the substantial investment, most companies choose their formal partners carefully, investing resources such as these only in relationships where the benefit will exceed the cost, and where the level of trust between supply chain partners is strong enough to support this level of collaboration.
1 Readers who are interested in learning more about CPFR should connect with the Voluntary Interindustry Commerce Solutions Association, the group that has pioneered the CPFR protocol and worked to foster collaboration and effectiveness across the supply chain, particularly in the CPG/retailer environment. For more information, visit http://www.vics.org.
How Should the Customer-Generated Forecasts Be Incorporated into Our Process?
One important element to consider with customer-generated forecasts is that these forecasts are one of several inputs to the forecasting process. Figure 5-2 is a graphical representation of how multiple inputs ultimately become a demand forecast. Although this looks quite simple and compelling in the figure, in reality, the details can get quite messy. As I mentioned in the previous section, depending on the level of granularity at which the customer forecast is expressed, significant translation and manipulation often must be applied to the customer’s demand forecast before it can be in a form that is useful for the supplier’s demand forecast. In many cases, the amount of translation and manipulation is simply not worth the effort.

Figure 5-2. Inputs to the demand forecasting process
Summary of Customer-Generated Forecasts
Your company should consider using customer-generated forecasts. But before you do, here are four questions that those who are responsible for managing the demand forecasting process should ponder:
1. Does our company want to get forecasts from our customers? The answer to this question requires an analysis of the costs versus the benefits. Such an analysis frequently results in an answer of “yes,” because customers can provide extremely helpful insights into their demand patterns.
2. Assuming the answer to the preceding question is “yes,” then which customers do we want to get forecasts from? Here, the forecaster, along with the sales teams that work with these customers, needs to apply some sort of criteria to the selection of customers from whom to solicit forecasts. Strategic importance to the firm, the customer’s forecasting skill, and the customer’s willingness to expend the necessary resources are some of the criteria to consider.
3. After we’ve decided which customers to consider for customer-generated forecasting, how should we be collaborating with these customers? A spectrum of collaboration mechanisms exists, ranging from simple exchange of spreadsheets, to monthly or quarterly visits, to formal VMI or CPFR relationships. The maxim to keep in mind is, “The closer the collaboration, the higher the cost, but (potentially) the higher the reward.”
4. After we’ve worked all the preceding issues out, how do we incorporate the customers’ forecasts into our process? The key issues that need to be faced here revolve around adapting the forecasting tools to facilitative the inclusion of these forecasts, and developing a mechanism for evaluating the usefulness of the customer’s forecast, relative to other sources of input.
Putting It All Together into a Final Forecast
At this point, the forecaster is faced with the challenge of data consolidation and interpretation. Chapter 4 discussed how qualitative judgments that often come from sales and marketing can contribute to the richness of the forecast. This chapter has discussed compilation of market intelligence that helps to frame the assumptions that underlie the forecast, as well as a specific form of market intelligence—customer-generated forecasts. Now it’s time to turn to the task faced by demand planners of putting it all together in a way that creates a final forecast that can be discussed at the demand review.
Following the compilation of data from the various sources represented in Figure 5-2, the demand forecaster must make judgments about how to create a “final forecast” from the provided sources. Table 5-2 shows how this might look to the demand forecaster. In this simulated forecast, the analyst’s job is to construct the final forecast for May through December, and actual demand is available for January through April. The first four rows in the table correspond to the categories of inputs illustrated in Figure 5-2. To populate this table, I generated random numbers in the “baseline statistical” row. Then, I randomly assigned an adjustment to the forecast for each of the rows labeled “product manager,” “sales,” and “customer.” This procedure might be followed in a company where each of the input sources is provided with the baseline forecast, then is asked to enter an adjustment if that source felt that an adjustment was necessary. Notice that some of the cells are blank. For example, in June, the product manager had no information that would lead him or her to believe that any adjustment to the baseline statistical forecast would be necessary. Recall from Chapter 4 the discussion of how to maximize value from salesforce forecasting. I made the point there that the optimal approach for salespeople is to begin with a statistically generated forecast, and then adjust it when they have reason to believe that an adjustment will make the forecast better. The reader might want to look back at Figure 4-1, which gives guidelines for when to make such adjustments. Although the discussion in Chapter 4 referred to sales-people, it applies to any individual who is asked to provide qualitative adjustments to demand forecasts.
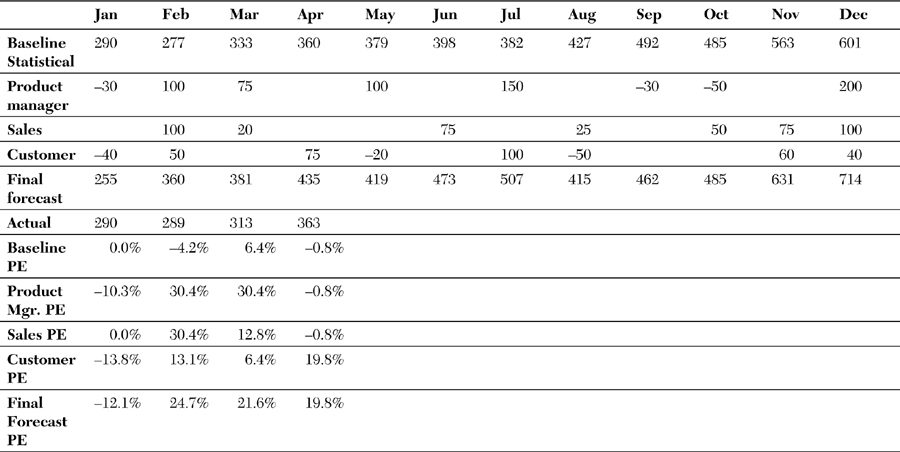
Table 5-2. Example of Creating a Final Forecast, Using Various Inputs
Returning to the example in Table 5-2, I took all judgment away from the analyst, and calculated a “final forecast” which consists of the “baseline statistical” forecast, plus (or minus) the average of the three adjustments. I also randomly generated some numbers for January through April that I labeled “actual,” meaning that this was the actual demand experienced in these months. Then, to provide the analyst with a means to judge the quality of the forecasts, I calculated the percent error (PE) for each of the individual components: baseline statistical, product manager adjustment, sales adjustment, and customer adjustment. Let’s examine how each source of forecast information has done. Granted, we only have 4 months of data to go by, so in “real life” we wouldn’t put much credence in these results, but examining the thought process that a forecast analyst might follow is nevertheless useful.
Interestingly, all three sources of forecast adjustments made the forecast worse. In this example, the most accurate forecasts came from the baseline statistical forecast. Had this been actual (and not randomly generated) demand and forecast data, and if the analyst had considerably more than 4 months of actual performance data to work with, then that analyst would have useful insight to allow him or her to be less mechanical, and more analytical, in the creation of the final forecast. The analyst would now be able to make good business judgments about which source of forecast information was the most helpful, and identify some biases that are present in each of the various sources. (Chapter 6 covers more on measurement of bias and accuracy.)
An example of best practice is at a company that participated in the audit research several years ago. At this company, the forecasting team had gathered accuracy data for several years on the various sources of input to their forecasts. Similarly to my simulated example, this company regularly received input from its sales teams, product management teams, and several of its large customers. Also similarly, this company had calculated the extent to which each source of information made the forecast better or worse. In other words, over time, did the sales team improve upon the baseline statistical forecast? If so, by how much? What was the contribution of the product management team? Which customers improved the forecast, and which made it worse? With this data in hand, this company was able to create an overall “weighting” that was applied to each adjustment. In my simple example, I created the final forecast by adding the average of all the adjustments to the baseline forecast. This company, rather than creating a final forecast with a simple average of the additional inputs, created a final forecast with a weighted average of those inputs, with the weighting being created using historical measures of forecast accuracy. This accomplished two things: It resulted in better final forecasts, and provided incentives to the various contributors to the final forecast to make their input as helpful as it could be.
Summary
At this stage in the discussion all the relevant pieces of the demand forecast have been brought together. You’ve learned about the role that quantitative, or statistical, forecasting plays in the process, by looking “in the rear-view mirror” at historical demand. You’ve explored the important contribution that qualitative judgment makes in determining how the future is likely to look different from the past. You’ve also looked at the bigger picture of market intelligence, and how such market intelligence is necessary to frame the assumptions that underlie the forecast. The next piece of the puzzle returns the discussion to the adage first quoted in Chapter 2: “What gets measured gets rewarded, and what gets rewarded gets done.” The next chapter provides an in-depth look at forecasting performance measurement.