Chapter 11. Database Design Case Study 1
Mighty-Mite Motors
It is not unusual for a database designer to be employed to reengineer the information systems of an established corporation. As you will see from the company described in this chapter, information systems in older companies have often grown haphazardly, with almost no planning and integration. The result is a hodgepodge of data repositories that cannot provide the information needed for the corporation to function because they are isolated from one another. In such a situation, it is the job of the database designer to examine the environment as a whole and to focus on the integration of data access across the corporation, as well as the design of one or more databases that will meet individual department needs.
On the bright side, an organization such as Mighty-Mite Motors, which has a history of data processing of some kind, knows quite well what it needs in information systems, even if the employees are unable to articulate those needs immediately. There will almost certainly be a collection of paper forms and reports that the organization uses regularly to provide significant input to the systems design process.
Corporate Overview
Might-Mite Motors, Inc. (MMM) is a closely held corporation, established in 1980, that manufactures and markets miniature ridable motor vehicles for children. Products include several models of cars, trucks, all-terrain vehicles, and trains (see Figure 11-1). Vehicles are powered by car batteries and can achieve speeds of up to 5 mph.


At this time, MMM is organized into three divisions: Product Development, Manufacturing, and Marketing and Sales. Each division is headed by a vice president, who reports directly to the CEO. (An organization chart appears in Figure 11-2.) All of these divisions are housed in a single location that the corporation owns outright.

Product Development Division
The Product Development division is responsible for designing and testing both new and redesigned products. The division employs design engineers who use computer-aided design (CAD) software to prepare initial designs for new or redesigned vehicles. Once a design is complete, between one and ten prototypes are built. The prototypes are first tested in-house using robotic drivers/passengers. After refinement, the prototypes are test by children in a variety of settings. Feedback from the testers is used to refine product designs and to make decisions about which designs should actually be manufactured for mass marketing.
Manufacturing Division
The Manufacturing division is responsible for producing product for mass-market sales. Manufacturing procures its own raw materials and manages it own operations, including personnel (hiring, firing, scheduling) and assembly line management. Manufacturing maintains the inventory of products that are ready to go on sale. It also handles shipping of products to resellers, based on sales information received from Marketing and Sales.
Marketing and Sales Division
MMM sells directly to toy stores and catalog houses; the corporation has never used distributors. Marketing and Sales employs a staff of 25 salespeople who make personal contacts with resellers. Salespeople are also responsible for distributing catalogs in their territories, visiting and/or calling potential resellers, and taking reseller orders. Order accounting is handled by Marketing and Sales. As noted earlier, Marketing and Sales transmits shipping information to Manufacturing, which takes care of actual product delivery.
Current Information Systems
MMM's information systems are a hodgepodge of computers and applications that have grown up with little corporate planning. The Product Development division relies primarily on stand-alone CAD workstations. In contrast to the sophistication of the CAD machines, testing records are kept and analyzed manually. Product Development employs product designers (some of whom function as project leaders) and clerical support staff but no information systems personnel. Attempts to have clerical staff develop simple database applications to store data about children who test new and redesigned products and the results of those tests have proven futile. It has become evident that Product Development needs information systems professionals, and although the division is willing to hire information technology (IT) staff, corporate management has decided to centralize the IS staff rather than add to a decentralized model.
Manufacturing uses a stand-alone server to track purchases and inventory levels of raw materials, personnel scheduling, manufacturing line scheduling, and finished-product inventory. Each of the applications running on the server were custom-written by outside consultants in COBOL many years ago; the most significant maintenance they have had was when they were ported from the department's original minicomputer to the server about 15 years ago. The data used by a Manufacturing application are contained in files that do not share information with any of the other applications. Manufacturing employs one COBOL programmer and a system administrator. Although the programmer is talented, the most he can do is fix superficial user interface issues and repair corrupted data files; he was not part of the original program development, and does not understand the functioning of much of the application code, which was poorly written and even more poorly documented. The applications no longer meet the needs of the Manufacturing division, and management has determined that it isn't cost effective to write new applications to access the existing data files.
Marketing and Sales, which wasn't computerized until 1987, has a local area network consisting of one server and 15 workstations. The server provides shared applications such as word processing and spreadsheets. It also maintains a marketing and sales database that has been developed using a PC-based product. The database suffers from several problems, including a limit of ten users at a time and concurrency control problems that lead to severe data inconsistencies. The marketing and sales database was developed by the division's two IS employees at the time, both of whom have since left the company. None of the current staff understands the software. Regardless of the amount of time spent trying to maintain the database, inaccurate data continue to be introduced.
The Marketing and Sales network is not connected to the Internet. Salespeople must therefore transmit hard copies of their orders to the central office, where the orders are manually keyed into the existing database. Some of the salespeople do have laptop computers, but because the network has no Internet connection, the salespeople cannot connect to it when they are out of the office.
Reengineering Project
Because MMM seems to have lost its strategic advantage in the marketplace, the CEO has decided to undertake a major systems reengineering project. The overall thrust of the project is to provide an information system that will support better evaluation of product testing, better analysis of sales patterns, better control of the manufacturing process, and enhanced communications options throughout the corporation. New information systems will be based on a client/server model and include one or more databases running on an Internet-connected network of servers, workstations, and PCs.
New Information Systems Division
The first step in the reengineering project is to establish an information systems division. This new division will also be housed in the corporate headquarters, along with the three existing divisions. To accommodate the new division, MMM will be construction a 10,000-square-foot addition to its building.
MMM is in the process of searching for a chief information officer (CIO). This individual, who will report directly to the CEO, will manage the new division and be responsible for overseeing the reengineering of information systems that will handle all of the corporation's operations.
All current IS personnel (those who work for the Manufacturing and Marketing and Sales divisions) will be transferred to the new IS division. The division will hire (either internally or externally) three management-level professionals, a Lead Programmer (responsible for overseeing application development), a Database Administrator (responsible for database design and management), and a Lead Analyst (responsible for overseeing systems analysis and design efforts). Retraining in the client/server model and client/server development tools will be provided for all current employees who are willing to make the transition. Those who are unwilling to move to the new development environment will be laid off.
Basic System Goals
The CEO has defined the following goals for the reengineering project:
▪ Develop a corporation-wide data administration plan that includes a requirements document detailing organizational functions that require technology support and the functions that the reengineered system will provide.
▪ Provide an application road map that documents all application programs that will be needed to support corporate operations.
▪ Document all databases to be developed for the corporation. This documentation will include ER diagrams and data dictionaries.
▪ Create a timeline for the development of applications and their supporting databases.
▪ Specify hardware changes and/or acquisitions that will be necessary to support the reengineered information systems.
▪ Plan and execute a security strategy for an expanded corporate network that will include both internal and external users.
▪ Implement the planned systems.
Current Business Processes
To aid the systems analysts in their assessment of MMM's information systems needs, the CEO of MMM asked all existing division heads to document the way information is currently processed. This documentation, which also includes some information about what an improved system should do, provides a starting point for the redesign of both business and IS processes.
Sales and Ordering Processes
MMM receives orders at its plant in two ways: by telephone directly from customers or from members of the sales staff who have visited customers in person. Orders from the remote sales staff usually arrive by fax or overnight courier.
Each order is written on a standard order form (Figure 11-3). If the order arrives by fax, it will already be on the correct form, but telephone orders must be written on the form by in-house order takers. Several times a day, a clerk enters the orders into the existing database. Unfortunately, if the sales office is particularly busy, order entry may be delayed. This backup has a major impact on production line scheduling and thus on the company's ability to fill orders. The new information system must streamline the order entry process, including the electronic transmission of order data from the field and the direct entry of in-house orders.

The in-house sales staff has no access to the files that show the current finished-goods inventory. They are therefore unable to tell customers when their orders will be shipped. They can, however, tell customers how many orders are ahead of theirs to be filled and, based on general manufacturing timetables, come up with an approximation of how long it will take to ship a given order. One of the goals of the information systems reengineering project is to provide improved company-wide knowledge of how long it will take to fill customer orders.
Manufacturing, Inventory, and Shipping Processes
The MMM Manufacturing division occupies a large portion of the MMM facility. The division controls the actual manufacturing lines (three assembly lines), a storage area for finished goods, a storage area for raw materials, and several offices for supervisory and clerical staff.
The manufacturing process is triggered when a batch of order forms is received each morning by the manufacturing office. The batch consists of all orders that were entered into the sales database the previous working day. A secretary takes the individual order forms and completes a report summarizing the number ordered by model (Figure 11-4). This report is then given to the Manufacturing Supervisor, whose responsibility it is to schedule which model will be produced on each manufacturing line each day.

The scheduling process is somewhat complex because the Manufacturing Supervisor must take into account previously placed orders, which have determined the current manufacturing schedule and current inventory levels, as well as the new orders, when adjusting the schedule. The availability of raw materials and the time it takes to modify a manufacturing line to produce a different model are also entered into the scheduling decision. This is one function that MMM's management understands will be almost impossible to automate; there is just too much human expertise involved to translate into an automatic process. However, it is vital that the Manufacturing Supervisor have access to accurate, up-to-date information about orders, inventory, and the current time schedule so that judgments can be made based on as much hard data as possible.
As finished vehicles come off the assembly line, they are packed for shipping, labeled, and sent to finished-goods storage. Each shipping carton contains one vehicle, which is marked with its model number, serial number, and date of manufacture. The Shipping Manager, who oversees finished-goods storage and shipping, ensures that newly manufactured items are entered into the shipping inventory files.
The Shipping Manager receives the customer order forms after the order report has been completed. (Photocopies of the order forms are kept in the Marketing and Sales office as backups.) The orders are placed in a box in reverse chronological order so that the oldest orders can be filled first. The Shipping Manager checks orders against inventory levels by looking at the inventory level output screen (Figure 11-5). If the manager sees that enough inventory is available to fill an order, the order is given to a shipping clerk for processing. If there isn't enough inventory, then the order is put back in the box, where it will be checked again the following day. Under this system, no partial orders are filled because they would be extremely difficult to track. (The reengineered information system should allow handling of partial shipments.)

Shipping clerks are given orders to fill. They create shipping labels for all vehicles that are part of a shipment. The cartons are labeled and set aside to be picked up by delivery services. The shipping clerks prepare the package labels (which also serve as packing slips), to ensure that the items being shipped are removed from the inventory file, and return the list of filled orders to the Shipping Manager. The orders are then marked as filled and returned to Marketing and Sales. The reengineered information system should automate the generation of pick-lists, packing slips, and updating of finished-goods inventory.
MMM's raw materials inventory is maintained on a just-in-time basis. The Manufacturing Supervisor checks the line schedule (Figure 11-6) and the current raw materials inventory (Figure 11-7) daily to determine what raw materials need to be ordered. This process relies heavily on the Manufacturing Supervisor's knowledge of which materials are needed for which model vehicle. MMM's CEO is very concerned about this process because the Manufacturing Supervisor, while accurate in scheduling the manufacturing line, is nowhere near as accurate in judging raw materials needs. The result is that occasionally manufacturing must stop because raw materials have run out. The CEO would therefore like to see ordering of raw materials triggered automatically. The new information system should keep track of the raw materials needed to produce each model and, based on the line schedule and a reorder point established for each item, generate orders for items when needed.


Raw materials are taken from inventory each morning as each manufacturing line is set up for the day's production run. The inventory files are modified immediately after all raw materials have been removed from storage for a given manufacturing line. There is no way to automate the reduction of inventory, but the new information system should make it very easy for nontechnical users to update inventory levels.
Product Testing and Support Function
MMM's top management make decisions about which model vehicles to produce based on data from three sources: product testing, customer registrations, and problem reports.
Customer registrations are received on cards packaged with sold vehicles (Figure 11-8). Currently, the registration cards are filed by customer name. However, MMM would also like access to these data by model and serial number to make it easier to notify customers if a recall occurs. Management would also like summaries of the data by model purchased, age of primary user, gender of primary user, and who purchased the vehicle for the child.
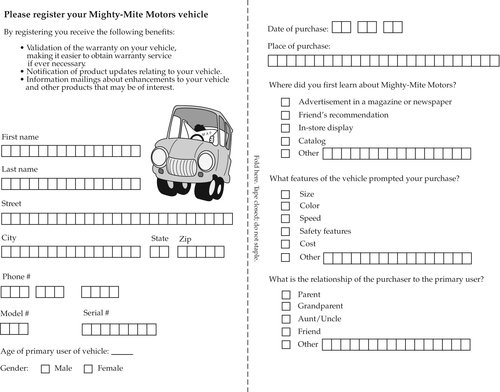
Problem reports (Figure 11-9) are taken by customer support representatives who work within the product testing division. These reports include the serial number and model that is having problems, along with the date and type of problem. Currently, the problem descriptions are nonstandard, made up of whatever terms the customer support representative happens to use. It is therefore difficult to summarize problem reports to get an accurate picture of which models are experiencing design problems that should be corrected. MMM would therefore like to introduce a standardized method for describing problems, probably through a set of problem codes. The result should be regular reports on the problems reported for each model that can be used to help make decisions about which models to continue, which to discontinue, which to redesign, and which to recall.

MMM does not repair its own products. When a problem report is received, the customer is either directed to return the product to the store were it was purchased for an exchange (during the first 30 days after purchase) or to an authorized repair center in the customer's area. In the latter case, the problem report is faxed to the repair center so that it is already there when the customer arrives. MMM does not plan to change this procedure because it currently provides quick, excellent service to customers and alleviates the need for MMM to stock replacement parts. (Replacement parts are stocked by the authorized repair centers.)
Product test results are recorded on paper forms (Figure 11-10). After a testing period is completed, the forms are collated manually to produce a summary of how well a new product performed. MMM would like the test results stored within an information system so that the testing report can be produced automatically, saving time and effort. Such a report will be used to help decide which new models should be placed in production.

Designing the Database
The most effective approach to the design of a database (or collection of databases) for an environment as diverse as that presented by Mighty-Mite Motors usually involves breaking the design into components indicated by the organization of the company. As the design evolves, the designer can examine the entities and the relationships to determine where parts of the organization will need to share data. Working on one portion of the design at a time also simplifies dealing with what might at first seem to be an overwhelmingly large database environment. Paying special attention to the need to share data helps ensure that shared data are consistent and suitable for all required uses.
A systems analysis indicates that the MMM database environment falls into the following areas:
▪ Manufacturing (including finished-goods inventory and raw materials ordering)
▪ Sales to toy stores and shipping of products ordered
▪ Purchase registrations
▪ Testing
▪ Problem handling
Examining the Data Flows
During the systems analysis, a data flow diagram can be a great help in identifying where data are shared by various parts of an organization. The top-level DFD (the context diagram in Figure 11-11) actually tells us very little. It indicates that three sources outside the company provide data: customers (the stores to which the company sells), purchasers (the individuals who purchase products from the stores), and raw materials suppliers. Somewhere, all those data are used by a general process called Manufacture and Sell Products to keep the company in business.

However, the level 1 DFD (Figure 11-12) is much more telling. As the data handling processes are broken down, five data stores emerge:

▪ Raw materials: This data store holds both the raw materials inventory and the orders for raw materials.
▪ Product data: The product data store contains data about the products being manufactured, product testing results, and the finished-goods inventory.
▪ Customer orders: This data store contains customer information as well as order data.
▪ Problem data: This final data store contains problem reports.
As you examine the processes that interact with these five data stores, you will find a number of processes that manipulate data in more than one data store, as well as data stores that are used by more than one process:
▪ The raw materials data store is used by the raw materials ordering and the manufacturing processes.
▪ Product data are used by manufacturing, sales, shipping, and product registration.
▪ Customer order data are used by sales and shipping.
▪ The purchases data store is used by purchaser registration and problem handling.
▪ The problem data store, used only by problem handling, is the only data store that is not shared by multiple processes.
The raw materials ordering process is the only process that uses only a single data store. Nonetheless, the level 1 DFD makes it very clear that there is no instance in which a single process uses a single data store without interaction with other data stores and processes. Given that each process in the DFD probably represents all or part of an application program, this suggests that the database designer should consider either a single database or a set of small databases along with software to facilitate the interchange of data.
The DFD makes it very clear that the need for the integration of the various data stores is very strong. In addition, Mighty-Mite Motors is a relatively small business, and therefore a single database that manages all needed aspects of the company will not grow unreasonably large. It will also be more cost effective and perform better than multiple databases that use some type of middleware to exchange data. Ultimately, the database designer may decide to distribute the database onto multiple servers, placing portions of it that are used most frequently in the division where that use occurs. The database design, however, will be the same regardless of whether the final implementation is centralized or distributed. The essential decision is to create a single database rather than several smaller, interrelated databases that must exchange data.
The ER Diagram
The systems analyst preparing the requirements document for the Mighty-Mite Motors reengineering project has had two very good sources of information about exactly what needs to be stored in the database: the employees of the company and the paper documents that the company has been using. The document that is given to the database design is therefore quite complete.
The design needs to capture all the information on the paper documents. Some documents are used only for input (for example, the product registration form or the order form). Others represent reports that an application program must be able to generate (for example, the line schedule report).
Although the current documents do not necessarily represent all of the outputs that the application programs running against the database will eventually prepare, they do provide a good starting place for the design. Whenever the designer has questions, he or she can then turn to Might-Mite's employees for clarification.
Working from the requirements document prepared by the systems analyst, along with the paper input and output documents, the database designer puts together the ER diagram. Because there are so many entities, all of which interconnect, the diagram is very wide and has been split into three pieces to make it easier to understand. As you look at each of the pieces, keep in mind that entities that appear on more than one piece represent the connection between the three illustrations.
The first part (Figure 11-13) contains the entities for raw materials and manufacturing. This portion of the data model is dealing with three many-to-many relationships:

▪ material_order to raw_material (resolved by the composite entity material_order_line)
▪ raw_material to model (resolved by the composite entity material needed)
▪ manufacturing_line to model (resolved by the composite entity line_schedule)
The second portion of the ERD (Figure 11-14) contains entities for product testing and sales. (Remember that in this instance, the customers are toy stores rather than individual purchasers.) There are two many-to-many relationships:
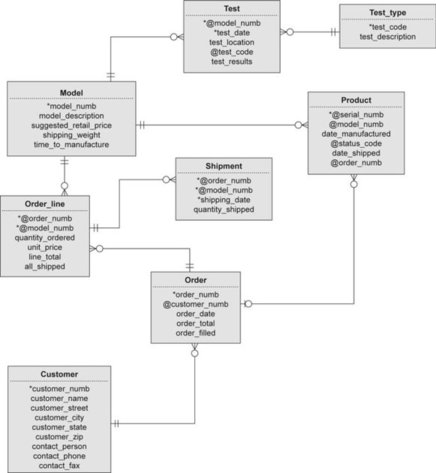
▪ test_type to model (resolved by the test entity)
▪ order to model (resolved by the order_line composite entity)
The test entity is somewhat unusual for a composite entity. It is an activity that someone performs and as such has an existence outside the database. It is not an entity created just to resolve a many-to-many relationship.
At this point, the diagrams become a bit unusual because of the need to keep track of individual products rather than simply groups of products of the same model. The model entity in Figure 11-13 represents a type of vehicle manufactured by Mighty-Mite Motors. However, the product entity in Figure 11-14 represents a single vehicle that is uniquely identified by a serial number. This means that the relationships among an order, the line items on an order, and the models and products are more complex than for most other sales database designs.
The order and line item entities are fairly typical. They indicate how many of a given model are required to fill a given order. The shipment entity then indicates how many of a specific model are shipped on a specific date. However, the database must also track the order in which individual products are shipped. As a result, there is a direct relationship between the product entity and the order entity, in addition to the relationship between order_line and model. In this way, Mighty-Mite Motors will know exactly where each product has gone. At the same time, the company will be able to track the status of orders (in particular, how many units of each model have yet to ship).
The final portion of the ERD (Figure 11-15) deals with the purchasers and problem reports. There are two many-to-many relationships:
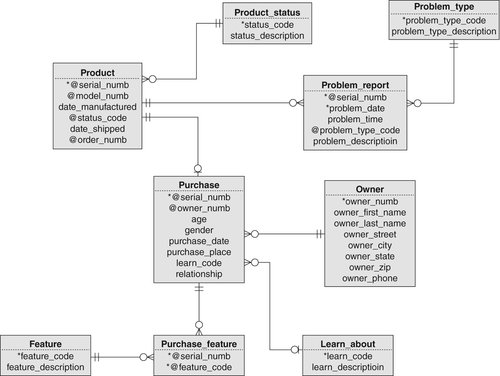
▪ problem_type to product (resolved with the entity problem_report)
▪ purchase to feature (resolved with the composite entity purchase_feature)
Like the test entity you saw earlier, the problem_report entity acts like a composite entity to resolve many-to-many relationships, but it is really a simple entity. It is an entity that has an existence outside of the database and that was not created simply to take care of the M:N relationship.
Note: Calling an entity a “problem_report” can be a bit misleading. In this case, the word “report” does not refer to a piece of paper but to the action of reporting a problem. A “problem_report” is therefore an activity rather than a document. In fact, the printed documentation of a problem report will probably include data from several entities, including the product, problem_report, purchase, and owner entities.
If you look closely at Figure 11-15, you’ll notice that there is a one-to-one relationship between the product and purchase entities. The handling of the data supplied by a purchaser on the product registration card presents an interesting dilemma for a database designer. Each product will be registered by only one purchaser. (Even if the product is later sold or given to someone else, the new owner will not have a registration card to send in.) There will be only one set of registration data for each product, which first suggests that all of the registration data should be part of the product entity.
However, there is a lot of registration data—including one repeating group (the features for which the purchaser chose the product, represented by the feature and purchase_feature entities)—and the product is involved in a number of relationships that have nothing to do with product registration. If the DBMS has to retrieve the registration data along with the rest of the product data, database performance will suffer. It therefore makes sense in this case to keep the purchase data separate and to retrieve it only when absolutely necessary.
Note: One common mistake made by novice database designers is to create an entity called “registration card.” It is important to remember that the card itself is merely an input document. What is crucial is the data the card contains and the entity that the data describe, rather than the medium on which the data are supplied.
Creating the Tables
The tables for the Mighty-Mite Motors's database can come directly from the ER diagram:
model (model_numb, model_description, suggested_retail_price, shipping_weight, time_to_manufacture)
test_types (test_code, test_description)
customers (customer_numb, customer_name, customer_street, customer_city, customer_state, customer_zip, contact_person, contact_phone, contact_fax)
orders (order_numb, customer_numb, order_date, order_total, order_filled)
order_line (order_numbzu, model_numb, quantity_ordered, unit_price, line_total, all_shipped)
shipments (order_numb, model_numb, quantity_shipped)
product (serial_numb, model_numb, date_manufactured, status_code, order_numb, date_shipped)
raw_material (material_id_numb, material_name, unit_of_measurement, quantity_in_stock, reorder_point)
supplier (supplier_numb, supplier_name, supplier_street, supplier_city, supplier_state, supplier_zip, supplier_contact, supplier_phone)
material_order (po_numb, supplier_numb, material_order_date, material_oreder_total)
material_order_line (po_numb, material_id_numb, material_quantity, material_cost_each, material_line_cost)
manufacturing_line (line_numb, line_status)
line_schedule (line_numb, production_date, model_numb, quantity_to_produce)
owner (owner_numb, owner_first_name, owner_last_name, owner_street, owner_city, owner_state, owner_zip, owner_phone)
purchase (serial_numb, owner_numb, age, gender, purchase_date, purchase_price, learn_code, relationship)
purchase_feature (serial_numb, feature_code)
learn_about (learn_code, learn_description)
feature (feature_code, feature_description)
problem_report (serial_numb, problem_date, problem_time, problem_type_code, problem_details)
problem_type (problem_type_code, problem_type_description)
Generating the SQL
Assuming that the designers of the Mighty-Mite Motors database are working with a CASE tool, then generating SQL statements to create the database can be automated. For example, in Figure 11-16 you will find the SQL generated by Mac A&D from the ER diagram you saw earlier in this chapter.


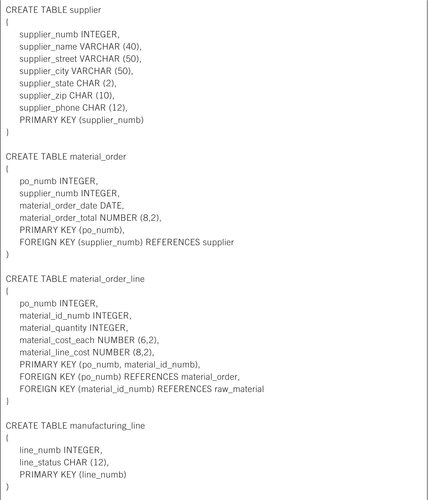


..................Content has been hidden....................
You can't read the all page of ebook, please click here login for view all page.