
11. Electronic Exchanges and Trading: Benefits
Electronic exchanges offer many benefits to every constituent, from traders to regulators. Globalization, more tradable products, and a vast ocean of real-time data, along with global networks and powerful computers, have led to fundamental changes in the way markets function. Buy-side firms can now execute complex order types and route them to exchanges through broker-neutral platforms.
It has been a busy few decades for financial markets globally. The transformation to electronic trading has allowed exchanges to fundamentally change their structure and their business model. Today most exchanges are for-profit global companies based on the electronic trading model. One of the biggest drivers of this change has been the adoption of technology by the financial markets.
Today technology is the primary engine for every component of the trade cycle. The exchange infrastructure is mostly electronic and is connected to the global trading community through computer networks. The exchanges have significantly benefited from this new model. Globalization has allowed the exchanges to expand their market share and significantly increase volume. As public companies, the exchanges today have the flexibility to merge with or acquire other exchanges around the world. Their electronic architecture allows them to complete these mergers and acquisitions quickly and smoothly. For example, it took over seven years for NYMEX and COMEX, both member-owned exchanges at the time, to complete their merger. By contrast, the merger between the CME and CBOT as stockholder-owned company took less than two years. There has been a frenzy of mergers and acquisitions between exchanges, allowing them to grow market share and acquire new products. Today the exchanges view technology as an integral part of their business, giving them a new revenue stream and helping them grow their business at an unprecedented speed.
The changes within exchanges have also fueled competition across financial markets. Today they are flooded with new players offering products to the trading community to help them access global exchanges more cheaply and quickly. The financial markets have seen new levels of transparency, speed, and anonymity in the trade cycle that would not have been possible in the floor-trading days. Traders have access to more markets and more data in real time than they ever did in the past. A new wave of innovative applications is helping the trading community use the flood of data to develop new strategies and new order types. Automated trading applications are helping traders trade a larger suite of products and manage greater volume. Transparency in the marketplace has also helped regulators and risk managers track markets and trading activity more efficiently and accurately. The benefits of the new model have been significant and, as exchanges continue to grow, the financial markets will continue to find creative ways to reap the rewards.
Globalization: Bringing the World Closer Together
The physical boundaries of exchanges limited their growth and market share. Although traders could trade by telephone, customers off the floor were at a disadvantage to the traders on the floor. Any significant growth for an exchange would require a bigger physical floor, which is costly to build and maintain. The only way to significantly increase market share would be to eliminate the physical boundaries of the exchanges. And the new model provided exchanges just that. The computers and networks allowed exchanges to connect to the trading community virtually. The globalization of exchanges through the use of technology has allowed them to expand by connecting with exchanges around the world. They are now able to list new products (created or acquired) quickly and with very little up-front cost. This global expansion has led to a significant surge in the volume across exchanges and across asset classes.
Pioneers chose cyberspace instead of a physical floor to build their exchanges. Some of the early followers took the risk of migrating their products off the physical floor and onto the electronic platform. These exchanges began seeing the benefits of the electronic trading model as they moved their operations off the floor. They saw their market share increase and exchange volume surge. We saw CME establish Globex to capture market share in Asia, and we saw Eurex build remote connections to reach traders in continental Europe and the United States. With the help of this expanded market, Eurex was able to capture LIFFE's flagship product. This infamous steal was a wakeup call for other derivatives exchanges. As these upstarts grew, the financial markets saw the power of the electronic trading model. As more exchanges began adopting electronic trading, the market share and trading volume at those exchanges increased. Whether it was the battle between the ICE (electronic energy market) and NYMEX (floor based) in the futures world or ISE (electronic options market) and CBOE (floor based), the story was the same: Electronic trading won.
As the exchanges converted from the floor-trading model to the electronic trading model, they began their journey toward globalization. They established their global footprint by transforming their business model through partnerships, mergers, and acquisitions. The open exchange API served as a bridge between the exchanges and the trading community. The new players in the market, such as trading screen providers, market data providers, and other software developers, jumped at the opportunity to take advantage of the open exchange connectivity. The technology vendors helped exchanges and other financial players reduce their trading costs. For example, NYSE's purchase of ARCA has saved them over $200 million in technology expenses. 1 Technology providers such as OM and AEMS2 license their software to exchanges around the world. AEMS alone sells its software to over 20 exchanges, responsible for 17% of Euronext's revenue. 3
Mergers and acquisitions within financial markets have further increased the interconnectivity between players. As we saw in earlier chapters, the mergers and acquisitions between exchanges have increased significantly in the past decade as the physical barriers were broken and the migration toward electronic trading picked up. The pioneers who had a head start in establishing their position in electronic trading saw their volume pick up as they expanded their market share. The increase in volume provided the exchanges with increased revenue, which in turn allowed them to further bolster their product offerings by forming partnerships with more exchanges.
Table 11.1 shows some of the major exchange groups and their volume increase between 2006 and 2007. These exchange groups are collections of exchanges that are formed through mergers as well their own subsidiary creation to trade new asset classes. For example, CBOE group is composed of the Chicago Board of Options Exchange (CBOE) as well as the CBOE Futures Exchange. The CBOE Futures Exchange was created by the CBOE to begin futures trading. As the table shows, the exchange group has seen healthy growth in its volume from 2006 to 2007, even when one of the exchanges or electronic trading platforms had slower growth, such as LIFFE-Paris, which is part of NYSE Euronext, or even negative growth, as with Clearport, which is part of the NYMEX group. 4
| *Excludes OTC contracts. | |||
| **DME was launched in 2007. | |||
| Source: FIA. | |||
| 2007 | 2006 | Change (%) | |
|---|---|---|---|
| Australian Stock Exchange | 24,969,811 | 22,452,328 | 11.21 |
| Sydney Futures Exchange | 91,121,162 | 78,120,106 | 16.64 |
| Australian Securities Exchange Total | 116,090,973 | 100,572,434 | 15.43 |
| Chicago Board of Options Exchange | 944,471,924 | 674,735,348 | 39.98 |
| CBOE Futures Exchange | 1,136,295 | 478,424 | 137.51 |
| CBOE Total | 945,608,219 | 675,213,772 | 40.05 |
| Chicago Board of Trade | 1,029,568,853 | 805,884,413 | 27.76 |
| Chicago Mercantile Exchange | 1,775,429,438 | 1,403,264,034 | 26.52 |
| CME Group Total | 2,804,998,291 | 2,209,148,447 | 26.97 |
| Eurex | 1,899,861,926 | 1,526,751,902 | 24.44 |
| International Securities Exchange | 804,347,677 | 591,961,518 | 35.88 |
| Eurex Total | 2,704,209,603 | 2,118,713,420 | 27.63 |
| ICE Futures Europe | 138,470,956 | 92,721,050 | 49.34 |
| ICE Futures US | 53,782,919 | 44,667,169 | 20.41 |
| ICE Futures Canada | 3,452,165 | 2,896,536 | 19.18 |
| Intercontinental Exchange Total | 195,706,040 | 140,284,755 | 39.51 |
| Liffe–UK | 695,974,929 | 515,478,934 | 35.02 |
| Liffe–Amsterdam | 159,827,511 | 126,833,753 | 26.01 |
| Liffe–Paris | 90,868,890 | 86,016,916 | 5.64 |
| Liffe–Brussels | 1,348,884 | 1,300,009 | 3.76 |
| Liffe–Lisbon | 1,005,238 | 673,514 | 49.25 |
| NYSE Arca Options | 335,838,547 | 196,586,356 | 70.84 |
| NYSE Euronext Total* | 1,284,863,999 | 926,889,482 | 38.62 |
| New York Mercantile Exchange | 304,994,104 | 233,397,571 | 30.68 |
| Comex | 40,468,298 | 30,072,043 | 34.57 |
| Clearport | 7,923,010 | 12,682,712 | −37.53 |
| Dubai Mercantile Exchange** | 223,174 | ||
| NYMEX Total | 353,608,586 | 276,152,326 | 28.05 |
CME: Expansion through Global Marketplace and Acquisition
CME has come a long way from its humble beginnings as a regional exchange in Chicago, where it was once the Egg and Butter Exchange. Today it controls approximately 98% of the U.S. futures market and is one of the leading derivatives exchanges in the world. CME entered the world of electronic trading very early by first launching the Globex platform in 1992. Globex was offered in conjunction with floor-trading to allow trading after hours—the first step in capturing global market share. On the first day of its launch, Globex traded 2,063 contracts. 5 Today over 80% of the volume on CME goes through its electronic platform. The growth in volume at CME has been phenomenal, with over eight consecutive years of double-digit growth. In September 2008, CME averaged 13.9 million trades per day. 6 CME achieved this tremendous growth by both opening its electronic trading platform to the global marketplace and through mergers and acquisition. The partnership between CME and Reuters created the FX Market platform. 7 The 50/50 joint venture would provide access to currency products, a nice complement to CME's currency futures products. 8 The recent acquisition of CBOT allowed CME to offer financial futures such as 2-, 10-, and 30-year U.S. Treasury futures as well as agricultural products. CME's recent merger with NYMEX added energy products to its product suite.
LIFFE: Using Technology to Make a Comeback
After losing significant market share to Eurex, LIFFE found its footing by putting itself on the fast track toward electronic trading. It ordered a complete shutdown of its floor within one year. It was a bold move that risked losing traders and liquidity, the lifeblood of an exchange. For LIFFE, the risk paid off. After closing its floor in 2000, the exchange has seen steady growth. With its merger with Euronext, the exchange became a conglomerate covering markets in several European countries. It also took advantage of the modular exchange model to provide its electronic trading platform to other exchanges. The CBOT, until its recent merger with CME, used the LIFFE Connect platform for its trading platform. TFX in Japan still uses LIFFE Connect for its trading needs. Finally, with its recent merger with NYSE, LIFFE has established itself as part of a major transatlantic exchange conglomerate. Through mergers, acquisitions, and partnerships and its migration toward electronic trading, it now boasts a product suite across asset classes and a presence in the United States, Europe, and Asia. Similarly, exchanges around the world jumped on the bandwagon of partnerships, mergers, and acquisitions to gain market share. Whether it's the pioneers solidifying their positions in the electronic trading world or the followers playing catch-up, technology provided exchanges and financial markets the flexibility to expand and capture market share around the world.
Surge in Volume
Trading on the floor was fun and chaotic. It was a unique work environment cherished by the financial community for over a century. However, the growth in financial markets in recent years would be unthinkable in the floor-trading environment. Manual trading, clearing, and settlement could never be able to keep up with the volume growth seen in the last decade. The trading community used computer screens and automated trading applications to trade more products across multiple exchanges, fueling the surge in volume across them. The cycle of growth continued. The exchanges expanded, the traders traded more, and the exchanges beat their volume record year after year. For example, in the U.S. equities market a normal day of volume today is almost twice as much as the record set in the 1987 crash, and the volume for a given stock on a busy day equals the volume of the entire market in the past. 9 The derivatives markets have been flourishing as well, and the growth has been remarkable in every region of the world (see Table 11.2) from 2006 to 2007.
The electronic infrastructure has allowed exchanges to process this growing volume with the speed and degree of accuracy that could not have been achieved with floor-trading. In the floor-trading days, spikes in volume would certainly introduce significant delays in trade processing. But the ability to handle increasing volume today is far better than in the past. The surge in volume has continued to put a burden on the electronic infrastructure of the exchanges, but it is easier to upgrade a machine to handle this surge. And the exchanges have largely been keeping up with the growing volumes. 10 They continue to take advantage of new technologies and new computer hardware, which has given them the capacity to handle more trades. The CME, for example, has expanded significantly in recent years. It successfully completed the merger with the CBOT in 2007 and, with the recent acquisition of NYMEX, has significantly increased its product suite and market share. The exchange upgraded its Globex system to handle the additional load. It added additional hardware to support order entry, market data, and the matching engine, which would process CBOT trading. 11 CME also adopted FAST (FIX Adopted for Streaming12) to transmit market data for both the CME and the CBOT. This reduced the bandwidth requirement for CME customers by over 50%.13. and 14. The electronic trading model gave exchanges the flexibility to scale their infrastructure to support the growing volume by adopting newer technologies, upgrading hardware, and scaling their architecture.
The early adopters proved the viability of the electronic trading model, and the growing volume has changed the minds of even the strongest opponents of the new model. The exchanges with an electronic trading platform saw tremendous volume growth and threatened the exchanges still doing business on the floor. The pioneers solidified their position as the electronic trading leaders by improving their electronic infrastructure. In the end, however, most followers didn't fare so badly, either. They jumped on the electronic trading bandwagon by making use of the modular exchange model, which allowed them to pick the best players for each component of the trade cycle. As these exchanges moved toward electronic trading, they saw a significant boost in their trading volume. For example, when the CBOT unveiled side-by-side trading for grain futures in August 2006, within five months migration to screen for corn, wheat, and soybeans reached the halfway point. The CBOT's open-outcry volume for agricultural product grew 23% year-over-year, but adding in the electronic trading pushed the growth rate to 40%. 15
It was clear evidence that electronic trading would provide a significant boost to overall volume for the exchange, whether it was the fight between ICE, an upcoming electronic trading exchange, versus NYMEX, 16 an established energy exchange, or the upstart in equity options ISE taking on CBOE, a leading established options exchange. Exchanges across asset classes saw a tremendous surge in volume. The volume in global futures and options markets grew from 6.2 billion contracts in 2002 to 15 billion in 200717 across 54 exchanges globally, an increase of over 58%. The story was the same in equities and equity options. The NYSE18 and Nasdaq19 saw their volumes increase as they forged ahead with the adoption of electronic trading platforms. The NYSE saw a 16.7% increase in 2007 and Euronext saw another spectacular year, with its volume going up 47% in Europe. Similarly, the Nasdaq OMX saw a 30% increase in market share. The U.S. options markets also saw significant growth. According to the Options Clearing Corporation (OCC), the equity options turnover jumped 40%, to 2.8 billion contracts, in 2007 compared to 2006. 20
Volume Growth around the World
Trading was once dominated by U.S. and European exchanges. Although the established markets, such as CME, Eurex, NYSE, and CBOE, continue to be the leaders in today's financial markets, the overall landscape has certainly changed. There have been new players in the United States and Europe in all asset classes. The Boston Options Exchange (BOX) was launched in February 2004 and captured almost 5% of the options market within the first 20 months of trading. 21 ICE, founded in 2000, took over IPE to compete with NYMEX for its flagship product, Brent Crude. These markets challenged the established markets in the United States and Europe. More important, the financial community began seeing the emergence of new markets around the world in countries with no established exchanges. And many of these markets came under the spotlight as they saw a significant surge in their trading volumes.
As shown in Table 11.3, the ranks of the global derivatives exchanges have plenty of new players. For example, China and India have seen tremendous growth in their markets. The National Stock Exchange of India ranked ninth on the top exchange list. Similarly, markets in Hong Kong saw their volumes double in 2007. Technology also helped bring smaller markets such as Johannesburg and Dubai into the global financial spotlight, with Johannesburg taking 10th place in the top exchange list with an astonishing increase of 214% in its exchange volume. 22 Whether it is the 263% increase in the Turkish Derivatives Exchange or Brazil's BM&F posting a gain of 28% or Rosario Exchange of Argentina logging an increase of 40%, the world of derivatives exchanges has seen astonishing growth in recent years.
Innovative Products Increasing Growth
The electronic trading model has also helped exchanges launch new products. 23 It is far easier to list a new product today than it was in the floor-trading days. The exchange no longer has to worry about the physical space needed for the new product nor find market makers and/or specialists to encourage liquidity. Technology has allowed exchanges to experiment with innovative products and see what works without adding significant cost. And the innovations in new products have certainly paid off. Exchanges in recent years have launched a number of new products that have helped them capture market share around the globe. Exchanges have listed new products such as a 10-year interest rate swap or E-Mini S&P contracts that are small enough in size24 to allow a greater number of market participants to trade them. These products have helped exchanges increase their volume in the new competitive landscape. For example, the Mexican Derivatives Exchange (MexDer) increased its volumes when it listed a 10-year interest rate swap that offered better hedging opportunity for traders; however, the TIIF 28, a short-term interest futures contract, saw a decline in volume in 2007. So, even though MexDer saw declining volumes on one product, it was offset by the increase in volume on the new product. Similarly, exchanges around the world have seen a significant increase in new product launches, such as CBOE's Volatility Option (VIX) and ETFs on equities exchanges. The exchanges have certainly listed some products that have failed, but with the low cost of launching new products, they can easily afford to experiment. Overall, the increase in product choices has helped exchanges grow their overall volume tremendously in the last few years.
Data, Data, and More Data
Trading is a numbers game. Whether trading on the floor or electronically, traders always make their decisions based on numbers. Traders base their decisions on numerous criteria, such as the exchange volume, price of the product, volume of a particular product they are looking to trade, and the last price at which a product was traded. They also look at external data describing the market fundamentals, such as unemployment numbers, interest rates, and productivity numbers. The list goes on and on. With more information about the market and other events at hand, traders can make better decisions. As the markets moved toward electronic trading, the financial community saw the availability of financial data increase tremendously. More important, the traders were able to access this data in real time, allowing them to adjust their trading strategies or positions instantaneously.
Computers allow the financial markets to store and process tremendous amounts of information that would have been impossible before. In the floor-trading days, these tasks were manual. In a frantic trading day it would be impossible for any trader on the floor to capture all the information that is available through a trading screen today. The technology advancements have provided financial markets significant amounts of storage capacity. The storage capacity allows exchanges to store detailed information about trades. Every trade today has information such as details about the traders, their account information, purchase price, trade quantity, and time of trade. Exchanges have also taken advantage of improvements in telecommunications. The connection between the exchange and the trading firm can be large enough for the market data to flow between the two parties in real time. Established vendors such as Bloomberg and Reuters provide real-time market data to the trading community. Software vendors such as Trading Technologies built their reputations not only by providing innovative tools such as MD Trader but also by building high-speed exchange gateways that allow traders to access market data from multiple exchanges in milliseconds.
One Screen: So Much Data
Figure 11.1 shows a screen shot of Trading Technologies’ MD Trader. It illustrates the amount of information a trader has at hand to analyze the markets. It is an order-entry screen that allows traders to view an array of market data information for that particular product. In Figure 11.1, MD Trader allows you to view the depth of the market, which is a list of all pending bid and ask orders at different prices. The depth of the market could range from five to over 20 levels deep. Traders use this information to judge how prices might move. The screen also displays other basic information:
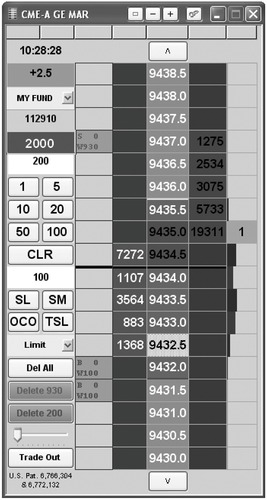
• Last traded price: Price at which the last trade occurred
• Last traded quantity: The trade size of the last transaction
• Total volume traded: Volume for the day for the contract
• Total volume traded in the market: Total volume for the exchange
• Volume at price: Total volume traded for the day at a specific price
In the MD Trader screen, the left column allows the trader to select and change the order size and allows the trader to cancel orders already sent to the markets, all with just one click. A trader using trading screens or tools similar to MD Trader has a tremendous amount of information available about a specific product and the exchange, which can help him make a better trading decision. With the ability to enter the order directly from the screen that displays the market information, traders can monitor market movements in real time and quickly move in and out of positions throughout the day.
Trading on the floor was primarily conducted through gut feeling. Traders would have to remember past trades or the last price at which a trade was bought or sold. Electronic trading, on the other hand, provides all that information and much more instantaneously. The information is updated on the screen at all times. Today, traders need to be computer savvy. They need to understand how to use the many features available in complex trading applications to effectively act on the information available at their fingertips. They must analyze the information to find new trading styles or strategies or order type to get an edge in the market.
Similarly, ECNs in equities markets began disseminating market data, which was once accessible to a select few in the wider trading community. ECNs began providing Level 2 quotes in real time. Similar to market depth, Level 2 allowed users to view all public quotes for buys and sells. It also provides information on recently executed orders—for example, the last order size that was executed and the price at which the order was executed.
Transparency
The financial markets are much more transparent than ever before. Exchanges provided an open application programming interface (API), which allowed the trading community and technology firms to directly connect to the exchanges. Anyone with a computer and Internet connection can access real-time market data from exchanges around the world. Technology has brought transparency to a financial market that was once opaque in the floor-trading days. It has also leveled the playing field. Market information today is disseminated to computers around the world in real time. In floor-trading days, the closer you were to the pit, the better your chances of getting your order executed. People stood next to each other and traded. It was not uncommon for people to not trade with someone simply because of a grudge, or to trade with someone else because they were friends. In electronic trading, the computers simply enqueue the orders and match them using a matching algorithm. Similarly, all the prices are published on the computer screen. Trading firms, ISVs and other technology players in the market build innovative applications using the wealth of information available, arming the trading community with tools to create new strategies, allowing traders to react to market events faster, and providing risk managers with better monitoring tools. And the information is available in real time to the global financial community. There is no longer an advantage for a market maker or a trader on the floor.
Greater Oversight of Trading Activity
The regulators, risk managers, and exchanges prefer the electronic trading model because they rely on accurate and timely information on trading activity. More information on each trader allows for better monitoring and risk controls. In the electronic trading model, there is an audit trail of virtually every mouse or keyboard click a trader makes. Every trade today captures myriad information about the trade and the trader. Whether it is the time the order was submitted, the account information, the fill time, or the number of changes made to the order, every single event is recorded and stored. Trading platforms are flexible, and any new rules or required information simply need to be programmed once and the trading tools will capture, store, and disseminate that information.
Regulators
Regulators can now track all trading activities to analyze trading patterns and discover any violations of rules. Regulatory mandates such as those established by MiFID25 would not have been possible to capture in the floor-trading era. Regulation existed for floor-trading as well, but it was hard to monitor and capture trading violations, especially in real time. There were floor managers who tried to enforce major rules, but on a chaotic, crowded trading floor, monitoring for violations would always be challenging. For example, there were no audit trails to help resolve disputes. The trading activity was captured manually, with very little information stored for historical review. To capture a larger trade violation, one had to actively monitor trading activity for days, weeks, and sometimes months to uncover violations. In electronic trading, every trade, along with the details, is captured and stored. For example, many front-end applications provide tools to display audit trails with built-in alerts to notify the compliance officer. This data can be stored and analyzed further to identify suspicious trading trends and violations. The rules can simply be programmed to ensure that trades are executed correctly.
The electronic trading model has allowed regulators to react to market conditions much faster and implement or modify rules at a pace unimaginable in the floor-trading days. Recently on Wall Street, short selling and its potential impact on financial firms came under the spotlight. Regulators had to implement a short selling ban overnight. In floor-trading days, they would simply rely on the floor managers and specialists to ensure that short sales were not conducted. With electronic trading, the short sales features were disabled on the trading screens so that no new short sales could be executed. Furthermore, if the feature accidentally remained on, further controls in different components of the trade cycle could catch and prevent the execution of short sales. Overnight rule mandates were implemented quickly.
Regulatory bodies around the world have worked on revamping the requirements for trade oversight to keep up with changes in financial markets. Similar to MiFID, the SEC in the United States passed Regulation NMS, which included an updated list of requirements to ensure transparency and fairness in the equities markets. Technology has allowed the financial markets to enhance and modify their trading systems to meet these new requirements. For example, firms must comply with numerous mandates for storing trade data. Fortunately, technology allows firms to store this data with ease. Applications are developed to capture, store, and archive the required information. Today, a majority of firms store trade-related data between 5 and 10 years. Electronic storage also allows firms to analyze the data or search for specific information. It would be almost impossible to sift through five years worth of data to find a particular trade(s) in floor-trading, but it is very quick to accomplish that task with electronic trading.
Markets in Financial Instruments Directive (MiFID) 26
MiFID is the regulatory directive created by the European Union (EU) to cover markets across all 30 EU countries. Launched on November 1, 2007, it was created to foster competition and protect consumers. Some of the highlights of MiFID are:
• Client category. MiFID requires firms to categorize clients as counterparties, professional clients, or retail clients, to ensure that proper procedures are implemented based on the client category. These categories must be verified before investment authority is given to clients.
• Client orders. Regulation requires firms to collect information that would ensure a client's best interest takes priority.
• Transparency. Both pre- and post-trade transparency rules were enhanced significantly to foster competition. For example:
• All order-matching systems (exchanges and nonexchange) are required to display five best price levels for bid and offer.
• Firms are required to publish price, volume, and time of all trades in listed products, even if executed outside a regulated market.
• All internal systems are treated as mini-exchanges and are subjected to rules similar to those for established exchanges. Internal systems are used by firms to match clients’ orders against their internal liquidity pool.
Risk Management
Trading is a risky business, and it is a common saying that the higher the risk, the higher the reward. Every day trillions of dollars in securities change hands. Exchanges, brokers, and risk managers within the trading firms spend a significant amount of time and money building risk models to manage trading activity and control risk. Risk management plays a significant role in the trade cycle. It allows exchanges and brokers to control the trading activity, to limit a trader's exposure to risk. The risk management landscape has changed significantly in the electronic trading world. Just like other tasks in floor-trading, risk management was also a manual task seldom followed actively. Manually managing risk for daily trading activity is not ideal. It is difficult to manage traders’ risks in real time on the floor. Transparency in the electronic trading model has changed all that. The abundance of data available for trading provides risk managers better visibility into the daily dealings by their traders. Just as traders can view multiple products across asset classes on one screen, risk managers can view the entire portfolio for a trader or the entire firm on one screen. The availability of detailed information on trading activity has allowed firms to build sophisticated risk management models. Firms such as Rolfe & Nolan and AIM-TO have built sophisticated applications for risk management. For example, Rolfe & Nolan's Alerts Direct application allows risk managers to monitor margin exposure throughout the day to control the firm's exposure to risk. Their Margin Direct application allows risk managers to revalue portfolios throughout the day to adjust for volatility in the markets. 27 Similarly, AIM-TO's VerusHedge product allows firms to analyze their entire portfolios using risk models such as Value at Risk (VaR). 28
In addition, risk management tools can be integrated with the trading systems to proactively prevent trades from reaching the exchange for execution. Almost all the front-end applications support basic risk management parameters. The front-end technology providers such as Trading Technologies (TT), RTS, and ORC all have pre-risk capabilities built into their applications. These applications allow risk managers to view real-time P&L (profit and loss) and view all orders from traders in the firm. The firms can customize the application to alert risk managers whenever the risk parameters are triggered. For example, a risk manager can set up limits on the size of an order a trader can trade at once or in one day. Let's say that the risk manager limits the trader's maximum trade size per contract to 500. This means that if the trader submits an order for 501 or higher, the risk management system will automatically reject the order and alert the risk manager. These pretrade rules can be configured to meet specific needs for the firm and its risk tolerance.
Competition
The electronic trading model brought flexibility and speed to financial markets. Technology players allowed financial markets to adopt electronic markets with creative new applications at rapid speed. Competition flourished for every component of the trade cycle. As the floor-based exchanges faced tough competition from electronic exchanges, the struggle for survival became the top priority. Gone were the days when exchanges were mostly regional. Today exchanges are competing across asset classes around the world. Similarly, the trading community in the past relied on brokers for execution, clearing, and settlement of their trades. The physical boundaries and manual trading limited the number of products a trader could trade. Market information was opaque, and the majority of trading was conducted over the phone. Things are very different today. Exchanges are competing with each other. There is a growing amount of product innovation. Trading screens with access to global markets have allowed firms, such as hedge funds, pension funds, day traders, and large proprietary traders, to trade more markets and more volume.
As the adoption of electronic trading increased, the number of players offering electronic trading components and tools for the financial community increased tremendously. Numerous independent software vendors (ISVs) emerged to provide services such as trading screens, market data, news feeds, risk management tools, and analytical tools. Software firms have become a major player in the financial markets. They grew their business by providing technology for exchanges and trading tools for the financial community. Financial markets today have numerous choices in every component of the trade cycle to build a low-cost, fast, reliable trading infrastructure.
Direct Market Access (DMA)
In the floor-trading days, direct access to the markets was limited to the privileged few who owned or leased exchange memberships to trade on the floor. The rest of the financial market users relied on middlemen—brokers—to trade. These middlemen were the “gateway” connecting the exchanges to the financial customers. They provided information, such as the bids and offers for products, submitted the buy and sell orders to the exchanges on behalf of their clients, provided market-related information, and often served as advisors to help clients make decisions to buy or sell a product. The market data available through these brokers was generally limited and certainly delayed. Clients relied mostly on the relationship with the broker to get a good deal on their trades. The users outside the floor were essentially missing the pulse of the market.
Electronic trading brought a level playing field for all users in the marketplace. As the exchanges moved toward electronic trading, connectivity to exchanges was accomplished through their APIs. These APIs allowed users to receive market information and send their orders to the exchange. They served as a gateway to the virtual trading floor. For the first time, access to exchanges was not limited to the privileged few on the trading floor. An open API allowed third-party vendors and trading firms to connect directly to the exchange. Users were no longer dependent on their brokers to provide them with trading information. In the new world of electronic trading, one did not need to have a membership to gain access to the pulse of the marketplace. For the first time traders could directly access the exchanges they wanted to trade without brokers as their middlemen.
It is always good to have the upper hand in negotiations. In electronic trading, direct market access (DMA) has given the upper hand to trading firms. Buy-side firms that generally relied on brokers for their trade execution can now directly connect to the exchanges. As we discussed in the previous chapter, the exchange API introduced DMA, which gives firms the flexibility to pick their trading infrastructure instead of relying solely on their brokers. DMA allows firms to reduce their trading costs and provides better control over their trades and the speed with which they can trade. More importantly, it allows trading firms to take control of their execution flow.
DMA takes the modular exchange model to the next level. Trading firms today have many more choices for exchange connectivity. Trading firms can choose the connectivity options based on cost and trading features. They can customize their trading infrastructure by picking the best option available to suit their trading style. They can build connectivity on their own. They can use one of the ISVs to provide them with exchange connectivity. They can lease the technology from brokers. All three options are widely used by trading firms today. For example, a trading firm can use an ISV for both trading screens and connectivity. Firms such as GL Trade, Trading Technologies, Pats Systems, Portware, and Lava Trading all offer trading services and exchange connectivity for trading firms. These software companies compete with each other based on trading applications and services. GL Trade, for example, offers its customers connectivity to over 150 exchanges worldwide. 29 The exchange connectivity and the innovative features offered by these software companies allow trading firms, large and small, to focus on trading and let the ISVs maintain the technical infrastructure.
Using DMA through ISVs, trading firms can also maintain their anonymity. They can use customized tools to build trading strategies to suit their trading style. They no longer have to depend on their brokers for execution. To keep trading firms as their clients, brokers in the last decade have spent significant amounts of time and money to build their technical infrastructure and electronic exchange connectivity. To compete, a number of brokers have acquired ISVs that already had the technical infrastructure for exchange connectivity. For example, Bank of America, Bank of New York, and Citigroup bought Direct Access Trading, Sonic Trading Management, and Lava Trading, respectively. 30 Other banks, such as Barclays, chose to build their own technology. Large banks acquired ISVs to instantly capture ISVs clients. Through acquisitions they could now have the buy-side firms as their clients and continue to offer DMA for the exchanges. Buy-side firms can maintain control over their execution flow. Sell-side firms can no longer rely on revenue from execution flow alone. They must offer new services and trading features to gain clients’ execution business.
Shifting the Balance of Power
In the past, trading firms generally relied on a single broker for their execution needs. As proven by DMA, the exchange API allowed the financial community to connect to exchanges directly without going through middlemen. It brought flexibility and innovation to the electronic trading model and has changed the landscape of financial markets. ISVs took the opportunity to build single screens connecting to multiple exchanges. As electronic trading grew, trading firms began using electronic platforms through ISVs; however, brokers rushed to acquire these ISVs to capture the execution business, and the trading firms once again were limited to using closed platforms offered by brokers. The remaining ISVs fighting to gain market share developed the multi-broker platform. Buy-side firms can now set up their trading infrastructures to allow them to access the same market through multiple brokers. The ability to pick their broker(s) has allowed these firms to take control of their order flow. The multi-broker platform has changed the relationship between brokers and trading firms. A broker-agnostic platform shifted power back to the trading firms.
Brokers are not entirely out of the picture in the world of execution. As the big players in the markets, they have the capital to build infrastructure to connect to multiple markets around the globe. With DMA, trading firms can now execute their business through different brokers, yet still maintain control of their order execution. A single trading screen can access exchanges through multiple brokers.
Figure 11.2 shows a sample multi-broker setup. As shown, through the multi-broker setup the trader can access the CME exchange through the different brokers. The front-end screen displays the market information through each of the brokers. Front-end screens are designed to recognize the connection from each broker so that when the trader submits the order for CME, the order is routed to CME based on the broker picked by the trader at the time of order submission. The multi-broker model provides traders with access to pick brokers for order routing based on the fees or trading features offered. Brokers today must compete with each other to capture the execution business by providing added services that attract trading firms. They must provide services that are unique and that enable traders to trade faster and better. Brokers have spent significant amounts of time and money to build services such as automated trading, smart order routing, new order types, alerts for market events, and the flexibility of reaching multiple exchanges. For trading firms the choices today are endless.

Automated Trading: Replacing Humans
The electronic trading model dramatically changed the landscape of trading. The migration from floor to electronic trading caused the disappearance of many jobs unique to floor-trading. Computers replaced or eliminated jobs such as runners, clerks, and manual order matching. Traders today use computers instead of “trade cards” to submit their trades. Throughout financial markets, technology now plays a vital role in keeping markets running. Traders today face tough competition. They have access to markets around the globe and a much larger selection of products than they ever had on the floor.
Traders today can trade more products across more asset classes around the globe through a single screen. To succeed in electronic trading, traders have to be fast and creative. Traders increasingly rely on technology and innovative tools offered by new players. These tools help them move beyond simple market and limit orders. They help them analyze market events and historical trends to make better trading decisions. In recent years, traders have relied on technology to actually trade for them. The use of computers as trading tools has moved from simple point-and-click to automated program trading.
Black boxes are another phenomenon of electronic trading that has further transformed financial markets. Black boxes are automated trading tools programmed to submit trades to exchange(s). Financial market users have increased the use of computers for trading. As the product choices and exchange access increased competition, trading manually became more difficult. It would be difficult for humans to watch hundreds of products around the globe. Computers, on the other hand, make it look easy. To watch additional markets, all one needs is a bigger machine. However, these black boxes will not necessarily lead to the total extinction of human traders.
Computers are good at following orders, but these orders must still be given by traders. Computers provide the trading data, but it is still the trader's responsibility to analyze the data and determine the right strategies to follow. These automated trading tools allow traders to focus their attention on analyzing and developing these new strategies, reducing the time wasted manually submitting these orders.
Every ISV and broker today spends significant amounts of time and money building these automated trading applications. Brokers and ISVs in recent years have focused on developing algorithmic engines to attract execution business. These automated trading tools are a crucial part of decision making for trading firms when picking their electronic trading platforms. Brokers and ISVs develop these automated tools to provide the flexibility and creativity needed in the world of electronic trading.
Abundant Choices of Order Types
In floor-trading, traders were limited to just a few order types such as market, limit, stop, stop limit, and a few other simple orders. The world of electronic trading is no longer limited to a world of just a few simple order types. Instead, there are countless order types that traders use. Order types are constructed to time the market, to hide the order size, and to execute orders at a better average price. Simple order types such as limit or stop orders are still used by traders, but the list of sophisticated orders has grown significantly in recent years. Software vendors and sell-side firms have designed new innovative order types to gain traders’ business.
In the world of electronic trading, where screens are becoming a commodity and exchange connectivity is becoming easier to acquire, trading firms are looking for an edge. Sophisticated order types with names such as Trailing Stop, OCO, Sniper, Iceberg, and Growlers are created by software vendors and sell-side firms to provide traders with an edge. Table 11.4 provides a brief overview of the types of orders that are available to trading firms today. For example, traders interested in preserving the anonymity of their orders are more likely to use order types such as Iceberg or Growlers, whereas a trading firm that is trying to improve the prices of its orders is more likely to use Limit or Pegged-to-Midpoint.
| Objective | Sample Order Types and Algorithms31. and 32. |
|---|---|
| Limit risk | Bracket, Market-to-Limit, Market-with Protection, Stop, Stop Limit, Trailing Stop, Trailing Stop Limit, OCO |
| Speed of execution | At Auction, Discretionary, Market, Market-if-Touched, Market-on-Close, Market-on-Open, Midpoint Match, Pegged-to-Market, Pegged-to-stock, Relative/Pegged-to-Primary, Sweep-to-Fill |
| Price improvement | Auction, Block, Box-Top, Limit, Limit-on-Close, Limit-on-Open, Limit-if-Touched, Pegged-to-Midpoint |
| Privacy | Arrival Price, Balance Impact and Risk, Hidden, Iceberg/Reserve, Minimize Impact, Percent of/Growler, Scale, Guaranteed VWAP, Best Efforts VWAP |
| Time to market | All-or-None, Fill-or-Kill, GAT (Good after date/time), GTD (Good till Date/Time), GTC (Good till canceled), Immediate-or-Cancel |
| Advanced trading | Basket, Conditional, OCA, Spreads, Volatility |
The variety of order types allows traders to submit multiple orders for various products. It also allows them to better control the price and order size while maintaining anonymity in the marketplace. ISVs such as Portware, FlexTrade, and Strategy Runner, as well as sell-side firms, have constructed creative order types to support new trading strategies and styles used by traders. Trading firms have many choices available in both order types and vendors that can implement them.
New Trading Styles
The single-screen access provided traders a much broader view of the markets. Through one screen they can view market information on multiple exchanges as well other market fundamentals. A trader on the floor could probably trade three or four products33 at once because the trading process was entirely manual. Traders had to be in a pit for that particular product. It would be difficult for a single trader to go from pit to pit to trade in different products; it would be unmanageable for traders to keep up with the market activity on more products and trade effectively. As we have seen, in electronic trading product information is available on trading screens. An average trader today has three or more computer screens blasting market information for hundreds of products. It is now realistic for one trader to monitor and trade 20 to 30 products at a time.
Access to products across exchanges, automated trading tools, and new creative order types have allowed traders to create new trading strategies. In equities markets, for example, firms such as Lava Trading and Portware allow traders to use basket trading. Basket trading allows traders to construct a portfolio of multiple stocks that can be traded as one stock. Traders select a set of stocks based on a particular industry, investment style, or market capitalization. They define the number of shares for each stock that they want to purchase and the prices for each of these stocks they want to pay. Trader can create these baskets and let the system trade all the stocks within the basket automatically based on the predefined rules.
Similarly, options markets benefited from the growing innovation in electronic trading. Options markets have seen tremendous growth in their short history. With fully electronic markets, such as ISE and BOX, electronic options execution has grown significantly. Today over 70% of options are executed off the floor. Options trading has always been known for its complex strategies. Words such as strangles, straddles, and butterflies are common vocabulary in the world of options trading. Although options traders used these strategies on the floor, the number of strategies used by traders was limited. Firms such as RTS, Brass MicroHedge, 34 and Actant specializing in options trading have brought a new level of sophistication to an already complex trading environment. These new players built tools that today allow traders to create countless numbers of strategies. These vendors provide a portfolio of over 30 to 40 trading strategies already constructed. Traders can simply select the strategy, define the number of contracts they want to purchase, and submit them to the exchange. The system automatically submits the strategy if it is natively supported by the exchange or the put and call orders to synthetically implement the strategy. 35
Finally, the futures world is no different. The exchanges once known for trading pigs, cattle, corn, and other physical commodities have transformed themselves to become a crucial part of the global financial markets. The migration of futures exchanges toward electronic trading significantly increased the number of users. Today, growing numbers of traders from other asset classes have entered the world of futures trading. The front-end trading systems, such as Trading Technologies, Ecco Trade, and Pats, were specialized for futures trading. Trading Technologies, for example, focused on exchange connectivity to futures exchanges around the world. Its initial focus was on the “big four”: CME, CBOT, Eurex, and LIFFE. These firms provided innovative tools to allow futures traders to analyze products across exchanges. Firms such as TT and Ecco brought automation to strategies such as spread trading. TT screens, for example, allowed traders to create intramarket and intermarket spreads and have the system automatically trade spreads. For proprietary trading firms, spread trading became one of the most common techniques used to hedge risk, especially in derivatives markets. Spread trading allows traders to reduce their risk by trading long and short contracts. A common strategy used by traders in derivatives markets got a facelift in the world of electronic trading. The intramarket spread trade is constructed with contracts combining two or more products on the same exchange, whereas intermarket spread trades are constructed with contracts combining two or more products on different exchanges. Traders using front-end systems could now construct spreads on any product available to them on the screen. The trading applications allowed them to synthetically create spread strategies. This means that a trader can construct a spread between two products by defining parameters on the trading screen. The trading application then automatically submits each leg of the contract individually to the exchange. These trading applications allow traders to use automated trading tools to create multilegged spreads on futures products.
Smart Order Routing
Electronic trading is all about flexibility. As we discussed, the exchanges today offer DMA access. Exchanges have been competing with each other to capture market share by listing new products and cross-listing products. Over the last decade, many exchanges have cross-listed products to expand market share. EurexUS entered the U.S. market by listing Treasuries, a flagship product on CBOT. ICE listed crude oil contracts, a popular product on NYMEX. LIFFE listed sugar contracts to compete against the NYBOT. These cross-listings have also brought fragmentation in the liquidity of these products. The cross-listing product may not always succeed, but during the competition, there is the issue of which liquidity pool an order should be directed to. To ensure that traders continue to receive the best price in the midst of competition and fragmentation, software vendors and sell-side firms offer specialized services to gain client business. TT Navigator, for example, was built when EurexUS launched U.S. Treasuries to compete with the CBOT. TT Navigator offered traders smart order routing to ensure that traders get the best execution for the same product listed in multiple markets.
Smart order routing allows traders to make intelligent decisions to route their orders to markets that have the best prices or to a broker that offers the lowest execution cost. Smart order routing has been a growing phenomenon in the financial markets. Smart order routers provide a consolidated view of the markets and allow traders to execute orders through a single screen across exchanges and brokers. Smart order routers serve as the bridge that consolidates and distributes data between exchanges. Traders can use the smart order routers with their multibroker platform to pick brokers and to route their orders based on a number of factors, such as speed, execution cost, and exchange availability.
Conclusion
Electronic trading allows more traders to get more data on more products in more markets. A click of the mouse from anywhere in the world can instantly send a variety of exotic order types to multiple brokers and exchanges around the world. Risk managers and regulators can monitor the flow of market information and orders in real time for violations or undue risk taking. The constant pressure of competition forces prices down and inspires improvements in every component of the trade cycle, from automated trading applications to matching engines to clearing services. Every aspect of the century-old floor-trading model has been transformed, unrecognizable even to those who have spent a lifetime in the business. The loud and chaotic fraternity of floor traders has been replaced by the cold efficiency of computers humming softly in a data center.
1. Finneran, John, “Technology Takes over NYSE,” July 31, 2006; www.fool.com/investing/high-growth/2006/07/31/technology-takes-over-the-nyse.aspx.
2.
3. Finneran, John, “Technology Takes over NYSE,” July 31, 2006; www.fool.com/investing/high-growth/2006/07/31/technology-takes-over-the-nyse.aspx.
4.
5. “History of CME Globex,”; www.cme.com/trading/get/abt/welcome/history.html.
6. “History of CME Globex,”; www.cme.com/trading/get/abt/welcome/history.html.
7. “Reuters and Forex to Launch the Global FX Marketplace,” 4 May 2006; www.finextra.com/fullstory.asp?id=15267.
8.
9. Salcedo, Yesenia, “Can You Handle It.” Futures, May 2004; http://findarticles.com/p/articles/mi_qa5282/is_/ai_n24278530.
10.
11.
12.
13.
14. Salcedo, Yesenia, “Can You Handle It?” Futures, May 2004; http://findarticles.com/p/articles/mi_qa5282/is_/ai_n24278530.
16. Leising, Matthew. “NYMEX Spent up to $20 Mln on London Trading Floor,”; www.bauer.uh.edu/spirrong/ATT00359.txt; (March 8, 2006d).
17.
18.
19.
20. “U.S. Equity Options Volume to Double by 2010-Study,”; http://uk.reuters.com/article/marketsNewsUS/idUKN212562012008022; (Feb. 21, 2008).
21. “U.S. Equity Options—Exchange Update,”; www.futuresindustry.org/fi-magazine-home.asp?a=1077.
22.
23.
24. E-mini S&P 500 is 1/5th the size of CME's S&P 500 futures contract. It closely tracks the price movement of the S&P 500 Index. “CME Expands Quarterly Month Listings of Equity Index Futures Products,”; www.cme.com/trading/prd/equity/emini-sp500.html; (June 24, 2007).
25.
27. Innovators in Automatic trading; www.rolfeandnolan.com.
28. Alternative Investment Management–Technology Outsourcing; www.aim-to.com.
29. “Trading on Emerging and Frontier Markets.,”; www.gltrade.com.
30. Safarik Dan. “Direct Market Access—The Next Frontier,”; www.wallstreetandtech.com/advancedtrading/showArticle.jhtml?articleID=60404150(Feb. 28, 2005) .
31. “Order Types and Algos,” Interactive Brokers; www.interactivebrokers.com/en/p.php?f=orderTypes&ib_entity=llc.
32. “Futures Algorithms Directory,” Advanced Trading; http://advancedtrading.thewallstreetwiki.com/directories/directory-futures-algorithms.php.
33.
34.
35.
..................Content has been hidden....................
You can't read the all page of ebook, please click here login for view all page.