

Resource Measurement Facility
In this appendix, we show you how to use the IBM Resource Measurement Facility™ (RMF) tool to display information about Coupling Facility (CF) performance. We also discuss how to calculate the utilization of subchannels used to communicate with the CF.
The following topics are covered:
•Introduction to performance monitoring
•Introduction to RMF
•RMF Postprocessor reporting
Resource Measurement Facility overview
RMF is a powerful tool for monitoring and analyzing the performance of many aspects of z/OS. This appendix provides a brief overview of RMF and performance measurements and techniques for analyzing the CF, and the related calculations for CF subchannel utilization.
For more information about using RMF, see Effective zSeries Performance Monitoring Using Resource Measurement Facility, SG24-6645.
Introduction to performance monitoring
Before doing any performance measurements or analysis, it is imperative to establish your performance objectives. The goal of performance management is to make the best use of your current resources and to meet your objectives without excessive tuning efforts.
You will probably use RMF for a number of purposes:
•To determine a baseline - what are the expected response times based on the current configuration.
•To investigate performance problems that might be related to the CF.
•To gather data for a CF capacity planning exercise.
Our focus for performance monitoring in relation to this document is the PSIFB coupling links. Because the hardware and the software do not provide information about coupling link bandwidth utilization, we discuss options that are available to help you determine if additional link capacity is required.
Introduction to RMF
RMF provides an interface to your System z environment that facilitates gathering and reporting on detailed measurements of your critical resources.
RMF consists of several components:
•Monitor I, Monitor II, Monitor III
•Postprocessor
•RMF Performance Monitoring
•Client/Server support
•Spreadsheet Reporter
•Sysplex Data Server
•Distributed Data Server
These components complement each other to provide the infrastructure for performance management:
•Gathering data
•Reporting data
•Accessing data across the sysplex
Data gathering
RMF gathers data using three monitors:
•Short-term data collection with Monitor III
•Snapshot monitoring with Monitor II
•Long-term data gathering with Monitor I and Monitor III
The system operator starts all monitors as non-interactive (background) sessions with various options that determine what type of data is collected and where it is stored. The data gathering functions run independently on each system, but each monitor can be started sysplex-wide by one operator command.
RMF reporting
RMF has three monitors and a postprocessor for reporting performance statistics:
•RMF Monitor I produces interval reports that are created at the end of a measurement interval, for example, 30 minutes. You can obtain Monitor I session reports during or at the end of RMF processing, or they can be generated later by the postprocessor.
•RMF Monitor II is a snapshot reporting tool that quickly provides information about how specific address spaces or system resources (processor, DASD, volumes, storage) are performing. Monitor II has two modes for reporting on system performance:
– A Monitor II display session, which can be invoked from either an ISPF dialog or directly with a TSO command (RMFMON).
– A Monitor II background session, which is a non-interactive session to create a report for printing.
•The RMF Monitor III data gather runs as a started task to gather information about aspects of the system that are not covered by the Monitor I gatherer. It also provides an ISPF interface to allow you to access sysplex or system performance reports interactively:
– Displaying real-time information about your current system status
– Showing previously collected data that is still available in either storage buffers or allocated VSAM data sets
Monitor III offers a wide spectrum of reports answering questions that arise during the various performance management tasks. The ISPF interface is able to present information from any system in the sysplex, so there is no need to log on to different systems in the sysplex to get all performance data.
•The postprocessor is invoked through a batch job and offers the following types of reports:
– Interval reports reflect a picture of performance for each interval for which the data has been gathered.
– Duration reports summarize data over longer periods of time with a maximum value of 100 hours.
– Summary and exception/overview reports.
In addition, the postprocessor can create overview records that are ideal for further processing with a spreadsheet application.
Interactive reporting with RMF Monitor III
This section summarizes the CF performance information that is available through the Monitor III ISPF interface. Historical reporting is typically performed using the RMF postprocessor, as described in “RMF Postprocessor reporting” on page 240.
RMF Monitor III usage tips
There are a few tips to help a new user around the usage of Monitor III.
Coupling Facility reports
The following Monitor III reports will help you investigate CF performance:
•Option S.5 - CFOVER - Coupling Facility Overview. A fast path to this report is available by typing CO on the command line.
•Option S.6 - CFSYS - Coupling Facility Systems. A fast path to this report is available by typing CS on the command line.
•Option S.7 - CFACT - Coupling Facility Activity report. A fast path to this report is available by typing CA on the command line.
Report Options
You access the Options panel by entering the letter O from the RMF Monitor III primary menu. From here, you can select “Session options” to tailor defaults (such as refresh period and time range).
Additionally, typing RO from any CF report panel provides useful filtering criteria for your CF reports. The following filters apply to the Coupling Facility reports:
•NAME - restrict the displays to a specific Coupling Facility.
•TYPE - restrict the display to a specific structure type (for example, LOCK).
•DETAIL - lets you control the level of granularity of the reports; a sysplex view, or information for each system in the sysplex.
Scrolling forward and backwards through different intervals
Moving between different intervals is both interactive and straightforward. Use PF10 to move back one interval and PF11 to move forward one interval. It is also possible to jump to a specific time by typing this into the time field. And you can enter CURRENT to be brought to the most recent interval.
You can also control the length of the interval you are looking at by changing the number of seconds in the Range field. If investigating a problem, you might want to use an interval as low as 10 seconds. If you are comparing performance, it is probably better to use longer intervals, like 900 seconds, to reduce the impact of intermittent spikes in activity.
Creating hardcopy data
The RMF session options have a Hardcopy option. When turned ON, this will save your RMF Monitor III screens to a dynamically allocated RMF sysout DDNAME within your TSO session. Using SDSF, you can then save this in a data set for later reference.
RMF Monitor III Screens
Figure A-1 on page 237 shows the Sysplex Report Selection menu. From here you can access reports to analyze your Coupling Facility performance.
|
Note: We have filtered our Coupling Facility report options to display only LOCK structures in our examples.
|

Figure A-1 RMF Monitor III: Sysplex reports
The sysplex reports of interest for Coupling Facility performance are options 5, 6, and 7 from the Selection menu shown in Figure A-1.
The Coupling Facility overview panel (option 5) is shown in Figure A-2.

Figure A-2 Coupling Facility Overview panel
Figure A-2 shows an overview of the available Coupling Facilities with performance details such as:
•Coupling Facility type and model
•CFLEVEL (Lvl column)
•Dynamic Dispatching settings (Dyn column)
•CF Processor information
•The total request rate to each CF
•The total and the unused amount of storage in each CF
Moving the cursor over CF FACIL03 and pressing Enter displays detailed information about the structures in that CF; see Figure A-3.
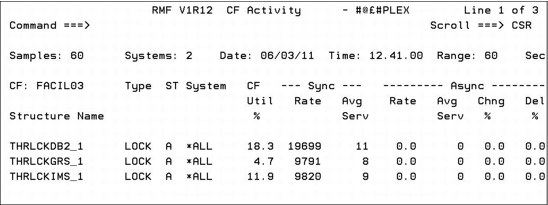
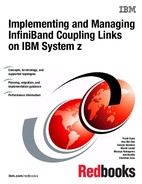
Figure A-3 CF FACIL03: Activity report
Figure A-3 shows structure detail for the lock structures (filtered) in FACIL03.
•The percentage of total used CF CPU that was used by each structure. For example, if the total CF CPU utilization (from the CFOVER panel) was 50%, and the CF Util % for structure THRLCKDB2_1 is 18.3, that means the operations against structure THRLCKDB2_1 accounted for 9.2% of the capacity in FACIL03.
•Synchronous and asynchronous request rates.
•Average service time, in microseconds, for each type of request.
•The percentage of requests that were delayed.
Selecting the Coupling Facility Systems report displays detailed information; see Figure A-4.
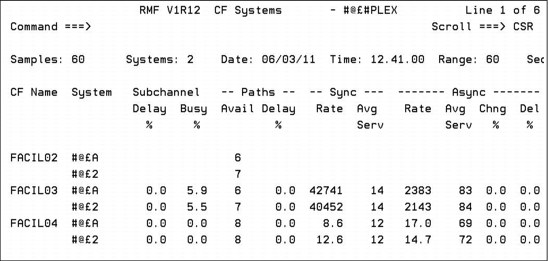
Figure A-4 Coupling Facility systems report
Figure A-4 shows a summary of performance, broken out by connected system, for these CFs. Various details are listed here:
•The systems that are connected to each CF.
•Subchannel usage and contention information.
•Number of available paths (CHPIDs) from each system to the CF.
•Percentage of requests that were delayed because all link buffers were in use.
•Synchronous and asynchronous request rates and average service times for each CF for each connected z/OS system.
Moving the cursor over one of the system names and pressing Enter displays more detailed information about the available paths between the named system and the selected CF; see Figure A-5.
Figure A-5 Coupling Facility FACIL03, System #@£2 subchannels and paths
Figure A-5 shows the available subchannels, CHPIDs, and CHPID types for this system. Note that if CHPIDs are taken offline from the z/OS end, they will be removed from the list of CHPIDs for the CF. However, if the CHPIDs are taken offline from the CF end, they will not be removed from the list (because they are available for use again if the CF end is configured back online). In either case, the In Use number of subchannels is designed to accurately reflect the number of subchannels that are currently available for communication with the CF.
If your z/OS is running on a zEC12 or later, more detailed information about each CF link CHPID is provided in the Subchannels and Paths report in Monitor III. An example is shown in Figure A-6.
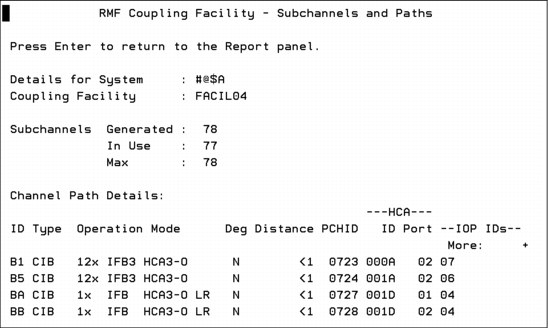
Figure A-6 RMF Subchannels and Paths display for zEC12
As you can see in Figure A-6, much more information is provided about each CF link CHPID when z/OS is running on a zEC12 or later. In addition to the CHPID and the fact that it is an InfiniBand (CIB) CHPID, the speed (1X or 12X), adapter type (HCA2 or HCA3), and the mode (IFB or IFB3) is also shown. There is also a flag to indicate if the link is running in degraded mode (“Deg”), and the approximate distance to the CF is shown. The Adapter ID and Port for each CHPID is also provided.
RMF Monitor III is especially powerful for helping you understand performance and workload changes over small periods of time; the minimum reporting interval is 10 seconds. This allows you to investigate problems and determine if something in the CF configuration is causing the problem. For example, was there a spike in the number of requests? Did the CF response times change dramatically? Was there a change in the split between synchronous and asynchronous requests? Was the distribution of requests across the allocated structures in line with normal activity, or did a particular structure experience an abnormally high load? This information can be invaluable in helping you narrow what you want to look at in the RMF postprocessor report.
RMF Postprocessor reporting
The RMF postprocessor can be used to produce reports over intervals of variable intervals. This section provides examples of using the report to analyze the performance of your CF resources.
Coupling Facility Activity report
To investigate potential InfiniBand performance issues, you need to understand the utilization of the subchannels and link buffers that are associated with those links1. Figure A-7 shows the Subchannel Activity part of the Coupling Facility Activity section of the postprocessor report. We discuss this part of the postprocessor report in detail because it provides the necessary information to calculate the subchannel and link buffer utilization. Although this report provides information from all systems in the sysplex, here we only focus on the links used by one system, namely SC80.
|
C O U P L I N G F A C I L I T Y A C T I V I T Y
z/OS V1R10 SYSPLEX WTSCPLX8 DATE 10/15/2008 INTERVAL 010.00.000 1
RPT VERSION V1R10 RMF TIME 15.40.00 CYCLE 01.000 SECONDS
------------------------------------------------------------------------------------------------------------------------------
COUPLING FACILITY NAME = CF8C 2
------------------------------------------------------------------------------------------------------------------------------
SUBCHANNEL ACTIVITY
------------------------------------------------------------------------------------------------------------------------------
# REQ ----------- REQUESTS ----------------------------- DELAYED REQUESTS -----------------
SYSTEM 3 TOTAL -- CF LINKS --4 PTH 5 # -SERVICE TIME(MIC)- 6 # % OF ------ AVG TIME(MIC) ------
NAME AVG/SEC TYPE GEN USE BUSY REQ AVG STD_DEV REQ REQ /DEL STD_DEV /ALL
SC80 1958K CBP 2 2 0 SYNC 50150 63.9 303.7 LIST/CACHE 42 0.0 5.5 5.6 0.0
3262.9 CIB 4 4 ASYNC 1760K 176.0 737.2 LOCK 0 0.0 0.0 0.0 0.0
SUBCH 42 42 CHANGED 146 INCLUDED IN ASYNC TOTAL 42 0.0
UNSUCC 0 0.0 0.0
SC81 1963K ICP 2 2 0 SYNC 1589K 48.1 460.7 LIST/CACHE 0 0.0 0.0 0.0 0.0
3271.7 SUBCH 14 14 ASYNC 101394 429.3 2269 LOCK 0 0.0 0.0 0.0 0.0
CHANGED 0 INCLUDED IN ASYNC TOTAL 0 0.0
UNSUCC 0 0.0 0.0
|
Figure A-7 Extract of a postprocessor report
The relevant fields in the Subchannel Activity report are listed here:
1 INTERVAL - The time interval that was defined for the length of the report. It is 10 minutes in our example.
2 COUPLING FACILITY NAME - The defined name of the CF. The name is CF8C in our example.
3 SYSTEM NAME - All information here is provided for each system that is part of the sysplex. The systems SC80 and SC81 are part of the WTSCPLX8 sysplex in our example.
4 CF LINKS - The type of coupling links, and the number of each type defined and currently in use, are shown here. System SC80 has two types defined, namely ICB-4 links and PSIFB coupling links. Two ICB-4 links are defined and in use and four PSIFB coupling links are defined and in use. Because each link provides seven subchannels, we can see the total of 42 defined subchannels, and that all 42 are in use.
An important field in this part of the report is the PTH BUSY (Path Busy) column, which contains a count of the number of requests that found that all link buffers were in use when the system tried to send the request to the CF. If this number exceeds 10% of the total number of requests, that is an indicator that additional coupling CHPIDs might be required. Another possible indicator of link buffer contention is if the number of subchannels in the USE column is less than the number in the GEN column.
5 REQUESTS - The number of synchronous and asynchronous requests, along with the average response time for each, is shown in this section.
6 DELAYED REQUESTS - A high number of delayed requests provides an indication of performance problems. In our example, the percentage of delayed requests lies below 0.1% and can therefore be disregarded.
Channel Path Details report
If z/OS is running on a zEC12 or later, the Subchannel Activity Report is followed by an additional report that provides detailed information about each coupling CHPID for that CF. A sample report is shown in Figure A-8.
|
----------------------------------------------------------------------------------------------------------------
CHANNEL PATH DETAILS
----------------------------------------------------------------------------------------------------------------
SYSTEM NAME ID TYPE OPERATION MODE DEGRADED DISTANCE PCHID HCA ID HCA PORT ------- IOP IDS ---
#@$A B1 CIB 12X IFB3 HCA3-O N <1 723 000A 02 07
B5 CIB 12X IFB3 HCA3-O N <1 724 001A 02 06
BA CIB 1X IFB HCA3-O LR N <1 727 001D 01 04
BB CIB 1X IFB HCA3-O LR N <1 728 001D 02 04
#@$2 88 CIB 725
8A CIB 726
A4 CFP 199
A6 CFP 190
A8 CFP 111
D0 ICP
D1 ICP
#@$3 BB CIB 1X IFB HCA3-O LR N <1 728 001D 02 04
|
Figure A-8 RMF Channel Path Details report
As you can see in Figure A-8, information is provided about each CF link CHPID in each z/OS that is connected to the CF. However, detailed information is only provided for systems that are running on a zEC12 or later (systems #@$A and #@$3 in this example). In addition to the CHPID and the fact that it is an InfiniBand (CIB) CHPID (which is also shown for the system that is running on a CPC prior to zEC12), the speed (1X or 12X), adapter type (HCA2 or HCA3), and the mode (IFB or IFB3) are also shown. There is also a flag to indicate if the link is running in degraded mode (“Deg”), and the approximate distance to the CF is shown. The Adapter ID and Port for each CHPID is also provided. Apart from the fact that so much information is provided, the other nice thing about this is that all of this information is recorded in the RMF SMF records. So you can use RMF reports to determine the precise coupling link configuration at some time in the past.
Calculating coupling link utilization
To calculate the usage of an InfiniBand link, there are a number of points you must consider:
•The RMF Subchannel Activity Report does not provide information at the individual CHPID level. Instead, information is provided for the set of CHPIDs that are used by the named system to communicate with the CF. As a result, you can only calculate average utilization across the set of CHPIDs.
•If multiple systems are sharing that set of CHPIDs, RMF does not know that. Therefore, you need to calculate the average subchannel utilization for each system, and then manually sum the utilization for all the systems that are sharing that set of CHPIDs.
•Because InfiniBand links support the ability to have multiple CHPIDs on a single link, you can (and probably will) have multiple sysplexes sharing a single physical link. The scope of an RMF Subchannel Activity Report is a single sysplex.
Therefore, to derive a comprehensive view of the use of the links, you must perform this set of calculations for each sysplex that is sharing the links you are interested in.
Although the RMF postprocessor Subchannel Activity report provides all the data necessary to calculate the utilization of the coupling links, it does not actually provide the subchannel utilization information. You need to perform the calculation that is shown in Example A-1 to calculate the utilization of that set of CHPIDs by that system.
Example: A-1 Coupling link utilization formula
Link Utilization % = (((Sync #Req * Sync service time) + (Async #Req * Async service time)) / Interval time in microseconds * #Subchannels in use) * 100
Example A-2 shows the formula filled in with all necessary values and the calculation process.
Example: A-2 Example calculation
Utilization % = (((50150 * 63.9 mic) + (1760000 * 176 mic)) / 10 min * 42) * 100
Utilization % = ((3204585 mic + 309760000 mic) / 600000000 mic * 42) * 100
Utilization % = (312964585 mic / 25200000000 mic) * 100
Utilization % = 1.24
We see that the link utilization is 1.24% for all active coupling links. Because there are two types of coupling links active, and the request numbers are not broken out to that level of detail, we cannot calculate the exact utilization for each coupling link.
Then perform the calculation again for each system that you know is using the same CHPIDs as SC80. Summing the result for that set of LPARs shows the utilization for the subchannels (and link buffers) associated with that set of CHPIDs.
Finally, to see the total usage of the shared InfiniBand links, perform this set of calculations for each sysplex and sum the sysplexes.
Although this is not a trivial process, it is the only way to obtain a clear picture of the total utilization of the subchannels and link buffers.
After completing the calculations, compare the results to the following guidelines:
•Subchannel utilization should not exceed 30%.
•Link buffer utilization should not exceed 30%.
•Utilization of the underlying InfiniBand link should not exceed 30%.
•The number of Path Busy events should not exceed 10% of the total number of requests.
Because of the large bandwidth of PSIFB 12X links, and the fact that each 12X CHPID supports only seven link buffers, it is likely that all link buffers will be used before the available bandwidth is fully utilized, so the subchannel and link buffer utilization is an important metric to monitor.
However, because the PSIFB 1X links have less bandwidth, but significantly more link buffers, it is possible that the bandwidth can be fully utilized before all link buffers are used. This means that subchannel and link buffer utilization might not provide a complete picture of the utilization of the underlying InfiniBand 1X links. For more information about the considerations for PSIFB 1X links, refer to 3.7.3, “Capacity and performance” on page 55.
1 For more information about the relationship between subchannels and link buffers, refer to Appendix C, “Link buffers and subchannels” on page 247.
..................Content has been hidden....................
You can't read the all page of ebook, please click here login for view all page.