
Cleanliness Verification on Large Surfaces
Instilling Confidence in Contact Angle Techniques
Darren L. Williams and Trisha M. O’Bryon, Sam Houston State University, Department of Chemistry, Huntsville, TX, USA
Chapter Outline
1.2. Surface Cleanliness and Surface Energy
2.1. Traditional and Newly Digitized Contact Angle Methods
2.1.1. Side-on Methods (Half-angle, Drop Shape Analysis, and Snake)
2.1.2. A Newly Digitized Top–Down Method (Bikerman)
2.1.3. Reflected-Angle Methods (Langmuir)
2.2. Suggested SRO in the Literature or in Industry
3. Advantages and Disadvantages
4.1. Examples of Imaging Choices
4.2. Example of Performance Comparison
4.3. Example of Personnel Training
1 Background
1.1 Scope
Cleanliness verification is growing in its importance in many industries, e.g. aerospace, biomedical engineering, and semiconductor fabrication [1], and the sessile drop technique stands out as an inexpensive, versatile, and portable way to probe the wettability of a surface [2], which is correlated with the cleanliness of hydrophilic (i.e. metallic and metallic oxide) surfaces. This chapter addresses the underserved community of users who clean surfaces that are too large to be placed in a small instrument or for whatever reason are not amenable to offline study. Hydrophobic oils, greases, and soils are their most common contaminants. This chapter may be less relevant to the user who is able to analyze small parts, wafers, and coupons using a commercial goniometer with subdegree accuracy and precision.
The ultimate goal is to facilitate the confident use of the sessile drop technique on large surfaces for contamination control and cleanliness verification. By “confident use,” we mean techniques and procedures that possess verifiable accuracy and precision suitable for incorporation into a company’s quality management infrastructure. By “cleanliness verification,” we mean verification that the surface is suitably prepared for the next production step or end use. This is not necessarily the same as a contamination-free or pristine surface. Rather, knowledge of the surface energy required for optimum performance will be useful in writing specifications for cleanliness, and this chapter should assist in the verification that the desired surface energy specification has been achieved.
This chapter examines the utility of sessile drop contact angle measurement for surface energy determination and cleanliness verification. A review is given on the available methods, commercial instruments, patents, and literature describing the state of the art in contact angle measurement. Then, a description is given on contact angle measurement techniques that have been modified for use on large surfaces. The negative effects of these changes on accuracy and precision are discussed, and remedies are given including the use of standard reference objects (SROs) [3,4] that mimic the size and shape of sessile drops.
1.2 Surface Cleanliness and Surface Energy
Surface energy (free energy per unit area) and surface tension (force per unit length) are essential concepts for describing the characteristics of solid–liquid interactions [5]. A clean metal or metal oxide surface will typically have a high surface energy. Liquids, adhesives, and polymer melts will spontaneously coat a high-energy surface as long as the surface tension of the liquid is lower than the surface energy of the solid. Contamination, especially hydrocarbon soils, will lower the surface energy of the substrate leading to incomplete coating, adhesion failure, delamination, etc. Therefore, knowing the surface energy, types of soils, and surface tension characteristics of coatings and adhesives is essential for confident and functional cleanliness verification.
The surface tension of a liquid is typically measured directly using tensiometry, while the surface energy of a solid is determined indirectly using the wetting behavior of test liquids with known surface tensions [6]. The wetting behavior is easily measured using the contact angle θ of a sessile drop. The interplay of surface energy, surface tension, and contact angle has been described in great detail since the 1960s by Zisman [7] and many others.
Zisman developed a standard technique to determine the surface energy of a smooth, planar surface by studying the contact angle behavior of probe liquids of varying surface tension [7]. Although examples are given in Zisman’s work of polar liquids and polar surfaces, the Zisman Plot uses a one-parameter approach to the surface tension of the liquid phase and surface energy of the solid substrate. Owens and Wendt [8], Rabel [9], and Kaelble [10] added a polar parameter, and eventually a hydrogen-bonding parameter to form a system similar to that of Hansen [11]. Alternatively, a description can be made in terms of dispersion and Lewis acid–base interactions as developed by van Oss, Chaudhury, and Good [12]. To save time in reviewing the above developments, the interested reader will find the review of these theories concisely delivered on the Krüss web site [13].
But for those new to surface energy determinations, an example of a simple Zisman analysis is given. In a Zisman plot, the cosine of the contact angle, cos θ, of each liquid is plotted against the surface tension of each liquid (γlv—the liquid–vapor interfacial tension). A line is fitted to the contact angle measurements and extrapolated to find the critical surface tension (γc) where spontaneous wetting occurs (i.e. cos θ = 1). Any liquid with a surface tension less than γc will completely wet the surface. Figure 5.1 is a Zisman plot generated using aqueous solutions of sodium dodecyl sulfate on an aluminum surface.
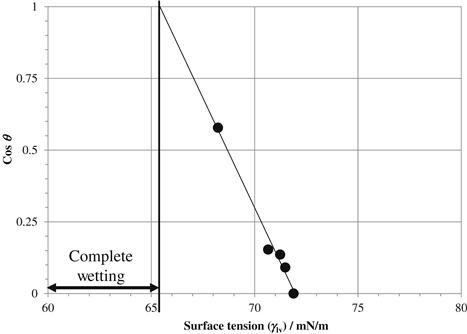
Although the Zisman plot is simple enough to analyze, we have found that a slight modification of the plot speeds the analysis considerably. In the modified Zisman plot (Fig. 5.2), the surface tension of each probe liquid is plotted versus “1 − cos θ”. Almost all plotting packages are capable of displaying a trend line with a linear or polynomial fitting equation. The critical surface tension is the y-intercept in this modified plot. An analysis of variance routine on γlv vs 1 − cos θ yields the critical surface tension (65.5 mN/m) with an estimate of the standard error (0.4 mN/m). The modified plotting technique’s ability to estimate the uncertainty in the critical surface tension is a distinct advantage over the traditional plotting technique.

FIGURE 5.2 A modified Zisman plot of γlv versus 1 − cos θ allows the critical surface tension to be calculated directly from the y-intercept of a least squares fitting line.
If one is using very pure liquids, then the literature values of surface tension may be used. But if solutions are used as probe liquids, then one must measure the surface tension. The DuNouy tensiometer [14,15] uses a platinum–iridium ring that is pulled out of the vapor–liquid interface, and the force pulling on the ring is used to calculate γlv.
The authors have shown how a digital version of this tensiometer may be constructed from an analytical balance and a hydraulic press [16]. The balance must have a hook for weighing objects below the balance and must be able to communicate with a computer. The top platen of a Carver-type press typically has a hole in it. A ball chain may be allowed to hang through this hole from an analytical balance that is resting on the top platen. The other end of the ball chain holds the platinum–iridium ring. The lower platen holding the test solution is raised until the ring is submerged. Then, the hydraulic fluid in the press is released to slowly lower the liquid while the balance is recording the force on the ring as it passes through the liquid–air interface.
The ring tensiometry technique is easily checked against pure liquids to ensure that the instrumentation and the technician are producing accurate results. The weakness of all the surface energy analyses of Zisman et al. for cleanliness specification and verification lies in the uncertainty of the contact angle measurement. The contact angle is affected by surface contamination, roughness changes, surface tilt, liquid purity, liquid viscosity, surface reactivity, etc. Kumar and Prabhu review many of these factors in detail [17]. This strong dependence on the state of the surface illustrates the excellent sensitivity displayed by the sessile drop contact angle.
2 Description of the Method
2.1 Traditional and Newly Digitized Contact Angle Methods
Before discussing contact angle measurement validation, it is appropriate to describe some of the contact angle measurement techniques and analysis methods. By far the most common commercially available instruments view the drop profile with back illumination (Fig. 5.3). The analysis has been automated using computerized image analysis algorithms. These instrument vendors provide their own method validation procedures, and some supply validation slides (SROs) [3,4]. One drawback, however, is the inability of most of these commercial instruments to travel outside of the laboratory to the production floor, paint bay, or field.

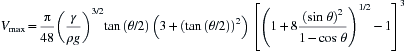
Since most of the contact angle analysis methods are based on the geometry of a perfect sphere, one must use small drops on a level planar surface, although nonlevel and curved surfaces [18,19] have been addressed. According to Extrand and Moon [20] based on Eqn (5.1), a 10 µL water droplet will be spherical if it adopts a shape with a contact angle between 10° and 140°. Equation (5.1) describes the maximum spherical volume (Vmax in µL) in general terms suitable for any liquid where g is the acceleration due to gravity (9.81 m/s2), γ is the liquid surface tension in mN/m, and ρ is the liquid density in g/cm3.
 (5.1)
(5.1)
For models that depend on drop volume (e.g. Bikerman [21]), the uncertainty in drop volume is a large source of uncertainty in the resulting contact angle measurement. Some models (half-angle and Brugnara [22]) are insensitive to volume as long as the drop is spherical. Some drop shape analysis (DSA) routines (LB-ADSA [23]) model the gravity-induced shape, and still others (DropSnake [24]) do not depend on the shape of the drop at all. Each of these methods and their freely available software packages are described below.
2.1.1 Side-on Methods (Half-angle, Drop Shape Analysis, and Snake)
Measurement. For the most accurate view of the three-phase point, the camera should be placed perpendicular to the side of the drop (Fig. 5.4), which is elevated on a pedestal to bring it near the optical axis. In general, these goniometers consist of a light source (A), a mask, screen, or collimator (B), a high-resolution digital camera (C), and the sessile drop on a pedestal (D).
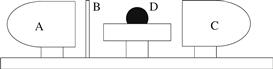
FIGURE 5.4 The apparatus for side-on contact angle measurement in most commercial instruments consists of a light source (A), a screen, mask, or collimator (B), an imaging device (C), and the sessile drop (D) on a pedestal that is elevated to the optical axis of the camera.
The use of a pedestal is not possible if the surface is very large. This side-on method has been modified using portable light sources and USB microscopes [25]. Figure 5.5 is a schematic of the side-on method using a digital microscope on a large surface. The light source (A) is behind a screen, mask, or collimator (B) that reduces the amount of light reflecting off the apex of the drop into the camera (C). The angle of elevation (ε) should be small. However, small elevations require the camera distance to increase, which has the detrimental effect of reducing the pixel density across the drop image. The camera distance from the drop can be reduced through the use of a prism or mirror [25–27] (Fig. 5.6).
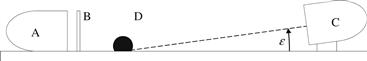
FIGURE 5.5 The apparatus for side-on contact angle measurement on a large surface consists of a light source (A), a screen, mask, or collimator (B), the sessile drop (D), and the imaging device (C) that is elevated above the surface a minimal amount.
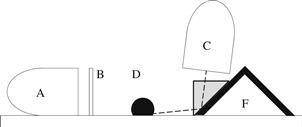
FIGURE 5.6 The apparatus for side-on contact angle measurement on a large surface using a mirror or prism (F), a light source (A), a screen, mask, or collimator (B), the sessile drop (D), and the imaging device (C).
Analysis. Of all the image analysis methods, the half-angle method requires the least amount of effort. The contact angle of a drop, θ, on a surface is determined by Eqn (5.2) using the base, b, and the height of the drop, h, as seen in Fig. 5.7.
![]() (5.2)
(5.2)
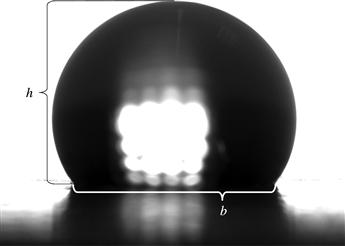
FIGURE 5.7 The measured parameters (h, b) needed for the half-angle contact angle determination method.
Almost any image processing software can be used to measure h and b, but the authors prefer to use ImageJ [28]—a freely available image processing platform that also contains plug-ins for contact angle determination [22–24].
The major sources of uncertainty in the half-angle method arise from an inability to accurately identify the three-phase points and the apex of the drop. Often, one is unable to view the drop directly from the side, and is forced to look at the drop from a slightly elevated position above the surface (Figs 5.5 and 5.6). This introduces two biases into the analysis. For nonwetting drops, the base width (b) will appear to approach the drop diameter (d) as the camera is elevated. The height will appear to decrease sometimes, as the light reflecting off the top of the drop makes the identification of the drop apex uncertain. The net result of camera elevation is a contact angle biased toward 90°. This bias is mitigated by keeping the viewing elevation to a minimum and by using collimated light or a screen to prevent light from shining down onto the top of the drop. Likewise, for wetting drops, the contact angle will be biased toward 90° because the “sharpness” of the three-phase point is lost as the camera is elevated.
Despite its ease of use, the half-angle method described above depends on only three points to define the shape of the drop and the contact angle. There are more sophisticated methods for side-on image analysis that are freely available. These suffer from the same biases as the half-angle method with respect to view elevation, but their strengths are based on their ability to utilize more points along the drop edge. Their use and evaluation have been reported [25].
2.1.2 A Newly Digitized Top–Down Method (Bikerman)
Measurement. Bikerman postulated the idea of computing the contact angle of a sessile drop by measuring the diameter of the drop from above. This method for cleanliness testing was found to be useful on airplane fuselages—a perfect example of a surface that does not fit into a commercial goniometer [29–31].
He used a microscope fitted with a micrometer eyepiece to measure his drop diameters, but one can replace the traditional microscope with a digital microscope [32]. The digital microscope does not have a calibrated magnification, and thus, requires a calibration object to be placed in the field of view near the sessile drop. Figure 5.8 is a schematic of the top–down apparatus containing the illumination beam (A) from the digital microscope (C), the sessile drop (D), and the calibration object—a metal washer (G).
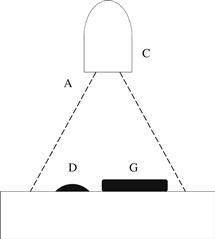
FIGURE 5.8 The top–down apparatus consists of an illumination beam (A) from the digital microscope (C), the sessile drop (D), and the calibration object (G).
The calibration object may be dimensioned using a caliper. The image may be analyzed using any image measurement software, but some are ideal for measuring the diameter of circular objects in an image (e.g. Meazure [33]). A spreadsheet is useful for calibrating the image and computing the contact angle. A typical data image for top–down contact angle analysis is shown in Fig. 5.9.

FIGURE 5.9 An example of top–down image showing the calibration object (washer), a 10 µL drop of deionized water (top), and a 10 µL drop of 104 ppm SDS in water.
Analysis. Bikerman derived the relationship between the contact angle θ, the base contact diameter b, and the volume v for a spherical drop (Eqn (5.3)). The base contact diameter is not visible from above if the contact angle is >90°. When the contact angle is >90°, Eqn (5.4) must be used because only the diameter of the drop d is visible from above [26]. Once b or d is measured, the ratio with v is computed and the contact angle, θ, is found numerically using a lookup table of Eqn (5.3) (or Eqn (5.4)) in a spreadsheet.
![]() (5.3)
(5.3)
![]() (5.4)
(5.4)
The top–down method decreases the size of the contact angle measurement apparatus, but requires an investment in a microsyringe or micropipette for accurate volume dispensing. Numerical analysis of Eqns (5.3) and (5.4) was used to determine that a 1% uncertainty in a 10 µL drop volume yields approximately a 1% uncertainty in contact angle in the spherically valid range of 10°–140°. A 1% uncertainty in drop diameter yields a slightly larger 1.5% uncertainty in contact angle over the same range. This method could be validated with a circular calibration object and a validated micropipette.
2.1.3 Reflected-Angle Methods (Langmuir)
Measurement and Analysis. The final method described here is the reflected-angle method first described by Irving Langmuir in 1937 [34]. Reflected-angle techniques have been used by a few instrument manufacturers as alternatives to the traditional side-on techniques. The Contact-θ-Meter [35] very closely matches the technique of Langmuir and is limited to a practical range of 10°–80°. A more recent and portable device (TVA100) uses reflected-angle analysis to measure the radius of curvature of the sessile drop. This radius and the drop volume may be used to calculate the contact angle in the range of 3.5°–75° [36].
The strength of the reflected-angle method is the direct computation of the contact angle (θ = 90° − 0.5 ϕ) by the measurement of the reflected angle ϕ of a small beam of light from a fiber optic source (A) shining very close and parallel to the surface (Fig. 5.10).

FIGURE 5.10 The reflected-angle technique utilizes the angle ϕ of the illumination source’s (A) reflection (R) off the drop near the three-phase point. This reflection is symmetric about the normal from the drop surface (nd), which is orthogonal to the contact-angle-defining tangent (T).
The downside of the Contact-θ-Meter is the same as the lab-based goniometers, namely, they only accept small coupons as sample surfaces. However, we have successfully used cell phone cameras for the Bikerman method [29] and, with the internal accelerometers of “smart phones,” one can measure the angle of the reflected beam (R) in Fig. 5.10 [26].
Validation of Langmuir’s reflected-angle methods presents a problem. The two-dimensional standard reference objects (2D SROs) are not suitable because they are merely profile images of sessile drops. A high-fidelity three-dimensional sessile drop standard reference object—a 3D SRO—is needed so that the reflective geometry can be used to validate method and technician performance.
2.2 Suggested SRO in the Literature or in Industry
The concept for a >90° 3D contact angle standard has been mentioned, for instance in ASTM D 5725-99 [37]. But this and other mentions in the literature did not contain enough detail to instill confidence in the production and use of such an SRO. Some instrument manufacturers provide [3,4] high-quality contact angle images imprinted on glass slides which are placed on the goniometer stage in place of an actual sessile drop (Fig. 5.11). These slides are examples of a 2D SRO, and they work well in situations where the illumination, sample pedestal, and camera have a stable, side-on geometry. But these slides are less useful if one is adapting the illumination and camera positions to enhance the contrast and focus of an actual sessile drop on a large surface that cannot be brought to the lab. These slides cannot be used for top–down or reflected-angle methods, either. In general, it is the best when the calibration object closely mimics the size, shape, and reflective characteristics of an actual sessile drop.

2.3 SRO Materials
A >90° contact angle standard can be constructed using a 3.18 mm chromium steel ball (MSC Industrial Supply Co. #72660) mounted in various drill gage card (Grainger #5C732) holes to mimic a series of contact angles (Fig. 5.12). Less than 90° contact angle standards can be constructed using 6.35 mm and 9.53 mm diameter balls (MSC Industrial Supply Co. #72702 and #72744) mounted under small sheets of punched aluminum (Fig. 5.13). The ball diameters and holes were chosen to produce faux sessile drops with volumes near 15 µL.

FIGURE 5.12 A nominal 119° SRO constructed using a 3.18 mm chromium steel ball in a 2.77 mm drilled gauge hole viewed from above and from the side using a prism.
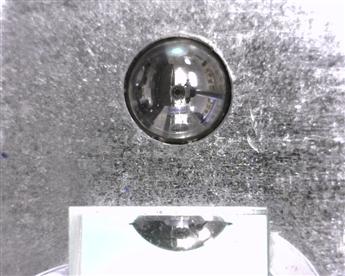
FIGURE 5.13 A nominal 54.3° SRO constructed using a 6.35 mm chromium steel ball in a 5.16 mm hole drilled in galvanized metal sheeting viewed from above and from the side using a prism.
These types of standards have proven to be useful in comparing four different side-on methods and multiple student technicians [25]. The main advantages of these standards are the fact that they are rigid, nonevaporating, very spherical in shape, portable, and resistant to damage.
The <90° SROs exhibit one drawback. Since the ball is protruding through a cylindrical hole, there is a gap near the three-phase point. A machined hole with a matching spherical contour along the walls of the hole would eliminate this gap almost completely.
The possibility of printing a 3D SRO was explored using a uPrintSE (Stratasys, Inc) [38]. It was found that the extrusion nozzle of our 3D printer was too large for a high-fidelity reproduction of a 10 µL sessile drop. It was apparent to the naked eye, and under microscopic inspection, the drops were very rough and resembled bee hives.
3 Advantages and Disadvantages
3.1 Personnel Training
A select set of sessile drop images can be used to test the operator’s competence with the software. This is a technique used at our university to ensure that new research students are able to precisely and accurately analyze the sessile drop image data. But there is more to contact angle analysis than image analysis.
A realistic 3D SRO allows the evaluation of an operator’s ability to align, illuminate, and capture high-quality images of sessile drops. We have found that drop illumination and camera elevation angle are the two skills with the steepest learning curve. The SRO provides an objective target to this seemingly subjective category of image quality. A quality image produces an accurate contact angle, and accurate contact angles instill confidence in surface cleanliness decisions.
3.2 Method Comparisons
Strength of the 3D SRO is the ability to compare methods. The ball in a hole allows the comparison of all the side-on methods. But this SRO is not appropriate for the top–down and reflected-angle methods. The ball protruding through a hole allows the comparison of all the methods described in this chapter.
4 Results
4.1 Examples of Imaging Choices
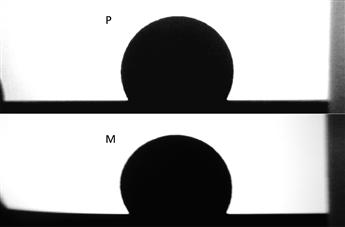
The choice between a glass prism (Edmund Optics) and a bent electropolished metal mirror (Rimex Inc, Edison, NJ) was evaluated against the Ramé-Hart 2D SRO. The metal mirror is preferred for cost and durability factors. As an example, the results are shown for the 119.5° drop image in Table 5.1. It is important to note that the uncertainty with the mirror is only slightly more than the prism. However, the accuracy is compromised by the slightly distorted image of the bent metal mirror (Fig. 5.14). This judgment is impossible unless one can use an SRO to calculate the accuracy values, and therein lies the whole motivation for using an SRO in a cleanliness verification quality management plan.

4.2 Example of Performance Comparison
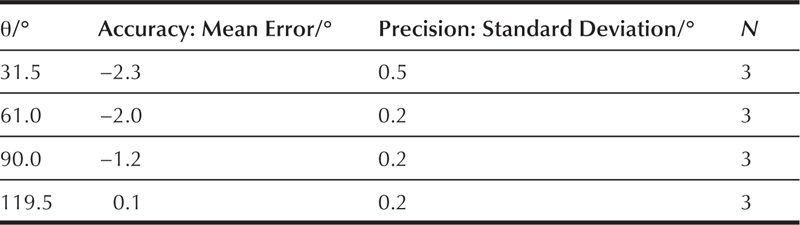
The prism was used in the arrangement shown in Fig. 5.6 where the sessile drop was replaced by the 2D SRO (Fig. 5.11). Three images of each drop profile were analyzed in ImageJ using the half-angle method. The absolute error was calculated by subtracting the accepted value from the experimental value. Table 5.2 shows the accuracy of this imaging method in terms of the mean absolute error and the precision of this imaging method in terms of the standard deviation of each set of three observations. The pooled standard deviation for this imaging method is 0.3°.
4.3 Example of Personnel Training
The 3D SROs were used to evaluate the performance of three operators (DP, DW, and EN). The operators varied in their experience from over 1 year (DW) to 1 week (EN) to 1 day (DP). The contact angle measurement methods were the Circle and Ellipse methods of Brugnara and the DSA and Snake methods of Sage [25]. The accepted value for the SRO was determined using the calibrated half-angle method. Figure 5.15 shows the accuracy and the precision of the operators and methods.
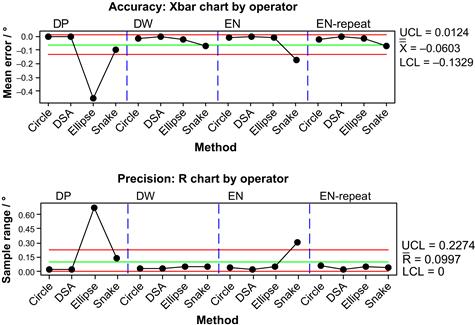
FIGURE 5.15 The use of a 3D SRO to evaluate the results obtained by four operators (DP, DW, EN, and EN-repeat) using four contact angle measurement procedures (Circle, DSA, Ellipse, and Snake). The horizontal reference lines in each chart are the 95% upper confidence limit (UCL), the mean of all measurements in the study (X), the 95% lower confidence limit (LCL), and the mean of all ranges in the study (R). A color version of this figure appears in the color plate section.
Clearly, DP had accuracy and precision problems with the Ellipse method and should be retrained. The operator NE initially had difficulty with the Snake method, but self-corrected when the analyses were repeated. The ability to evaluate accuracy objectively using an SRO instills confidence that new operators are performing within acceptable limits.
4.4 Examples of Method Comparisons
The Langmuir method described herein has been evaluated against two 3D SROs constructed to exhibit contact angles of 48.1° and 61.0°. The half-angle analysis of these SROs gives the accepted values of 45.8 ± 0.2° and 61.6 ± 0.3° (N = 6 each). Figure 5.16 shows the comparison of the accuracy and precision of the Langmuir (L) method to the half-angle (H) method against these standards.

FIGURE 5.16 The half-angle method (H) was used to determine the accuracy and precision of the Langmuir method (L) against two 3D SROs (45.8° and 61.6°). The horizontal reference lines in each chart are the upper 95% confidence limit (UCL), the mean of all measurements in the study (X), the lower 95% confidence limit (LCL), and the mean of all ranges in the study (R). A color version of this figure appears in the color plate section.
The Langmuir (L) method matched the half-angle (H) method to within a degree (Fig. 5.16). The mean error of this method was slightly below zero at −0.6 ± 0.5° (N = 12). The standard deviation of this method (0.5°) is acceptable for many operations, and is comparable to the standard deviation of the half-angle method (s = 0.2°).
5 Applications
The uncertainty in cleanliness verification is tied to the uncertainties in surface energy determination. There are several methods for determining surface energy, and all of them use test liquids of known (or measured) surface tensions along with the contact angles these liquids make with the surface. These contact angle measurements are the largest source of uncertainty in the surface energy determination. Additionally, measurements of contact angles on large surfaces present even more challenges. We have endeavored to review three newly modified techniques suitable for large surface contact angle measurement. And we have presented, demonstrated, and evaluated several options for producing 3D SROs that are suitable for use in industrial cleanliness verification activities.
The use of steel plates, gauge cards, and bearing balls as robust standards shows promise. The ball resting in or protruding through a hole is the best approach. We have found that drilled holes exhibit rough edges and slight noncircularity. Punched holes are preferred for the >90° 3D SROs, although these punched holes show indentation near the edge of the hole. This defect seems more manageable in side-on techniques. Machined holes are necessary for the protruding ball (<90°) SROs.
These SROs are suitable for validating the illumination, sample, and imaging setup in field applications or on the large-part manufacturing floor where true-profile, side-on imaging is impossible. An SRO also gives the user the ability to check accuracy and not merely precision, which has been a long-time difficulty of contact angle method comparisons. Performance can also be monitored across multiple facilities and across long periods of time with proceduralized SRO checks.
The combination of these validation tools and the modified contact angle measuring techniques fills a need for robust, production-line capable of cleanliness verification methods.
6 Future Developments
The connection between cleanliness and surface energy is well established. Ironically, the strength and weakness in this analysis is the sensitivity of the sessile drop contact angle. A 3D SRO that mimics a sessile drop is an effective quality assurance tool for eliminating non-process-related variation in the contact angle results.
Admittedly, the 3D SROs shown here are at a very primitive level of development. Now that the proof of concept is complete, high-precision machined base plates with permanently mounted bearing balls may be produced. It is likely that certified 3D SROs may become available in the near future.
Acknowledgments
The Welch Foundation Departmental Development Grant is acknowledged for funding much of this work. Many students who have been supported by this grant to do contact angle work are acknowledged for their efforts throughout the years. They are Mark Amann, Jennifer Bradley, Madison Hausinger, James Huskey, Megan Konarik, Elizabeth Nesselrode, Dustin Palm, and Angela Rippley. Our colleague Anselm Kuhn is acknowledged for supplying the prisms and the bent-metal mirrors from Rimex Metals.
References
1. Kanegsberg B, Kanegsberg E. Handbook for Critical Cleaning. Applications, Processes, and Controls. vol. II second ed. Boca Raton, FL: CRC Press, Taylor and Francis Group; 2011.
2. Birch W, Carré A, Mittal KL. Wettability techniques to monitor the cleanliness of surfaces. In: Kohli R, Mittal KL, eds. Developments in Surface Contamination and Cleaning. Norwich, NY: William Andrew Publishing; 2008;693–723.
3. Krüss GmbH, Hamburg, Germany List of Accessories (Contact Angle Measuring Instruments). (accessed 11.12.12) http://www.kruss.de/en/products/contact-angle/accessories/dsa100.html.
4. Ramé-Hart Instrument Co, Succasunna, NJ Calibration Tools. (accessed 11.12.12) http://ramehart.com/calibration_tools.htm.
5. Adamson AW, Gast AP. Physical Chemistry of Surfaces. sixth ed. New York, NY: Wiley Interscience; 1997.
6. Etzler FM. Characterization of surface free energies and surface chemistry of solids. In: Mittal KL, ed. Contact Angle, Wettability and Adhesion. Utrecht, The Netherlands: VSP; 2003;219–264. Contact Angle, Wettability and Adhesion vol. 3.
7. Zisman WA. Relation of the equilibrium contact angle to liquid and solid constitution. In: Contact Angle, Wettability and Adhesion. Washington, D.C: American Chemical Society; 1964;1–51. Advances in Chemistry Series No. 43.
8. Owens DK, Wendt RC. Estimation of the surface free energy of polymers. J Appl Polym Sci. 1969;13:1741.
9. Rabel W. Wetting theory and its application to the study and use of the surface properties of polymers. Farbe + Lack. 1972;77:997.
10. Kaelble DH. Dispersion-polar surface tension properties of organic solid. J Adhes. 1970;2:66.
11. Hansen CM. Hansen Solubility Parameters: A User’s Handbook. second ed. Boca Raton, FL: CRC Press; 2006.
12. van Oss CJ, Chaudhury MK, Good RJ. Interfacial Lifshitz-van der Waals and polar interactions in macroscopic systems. Chem Rev. 1988;88:927.
13. Krüss GmbH, Hamburg, Germany Contact Angle and Surface Energy. (accessed 11.12.12) http://www.kruss.de/en/theory/measurements/contact-angle.html.
14. Harkins WD, Jordan HF. A method for the determination of surface and interfacial tension from the maximum pull on a ring. J Am Chem Soc. 1930;52:1751.
15. Huh C, Mason SG. A rigorous theory of ring tensiometry. Colloid Polym Sci. 1975;253:566.
16. Williams DL, Jupe CL, Kuklenz KD, Flaherty TJ. An inexpensive, digital instrument for surface tension, interfacial tension, and density determination. Ind Eng Chem Res. 2008;47:4286.
17. Kumar G, Prabhu KN. Review of non-reactive and reactive wetting of liquids on surfaces. Adv Colloid Interface Sci. 2007;133:61.
18. Blitshteyn M, Hansen J, Shaw RK. Method and apparatus for determining the contact angle of liquid droplets on curved substrate surfaces. U.S. Patent 5,137,352 1991.
19. Guilizzoni M. Drop shape visualization and contact angle measurement on curved surfaces. J Colloid Interface Sci. 2011;364:230.
20. Extrand CW, Moon SI. When sessile drops are no longer small: transitions from spherical to fully flattened. Langmuir. 2010;26:11815.
21. Bikerman JJ. A method of measuring contact angles. Ind Eng Chem. 1941;13:443.
22. Brugnara M. Contact Angle Plugin for ImageJ Software. Trento, Italy: University of Trento; 2010.
23. Stalder AF, Mechior T, Müller M, Sage D, Blu T, Unser M. Low-bond axisymmetric drop shape analysis for surface tension and contact angle measurements of sessile drops. Colloids Surf A. 2010;364:72.
24. Stalder AF, Kulik G, Sage D, Barbieri L, Hoffmann P. A snake-based approach to accurate determination of both contact points and contact angles. Colloids Surf A. 2006;286:92.
25. Williams DL, Kuhn AT, Amann MA, Hausinger MB, Konarik MM, Nesselrode EI. Computerised measurement of contact angle. Galvanotechnik. 2010;108:2502.
26. O’Bryon TM. Preparation of a Non-Evaporating Contact Angle Standard Reference Material, M.S Thesis. Huntsville, TX: Sam Houston State University; 2012.
27. Wallström E, Svenningsen I. Surface Tension Measurements of Corrosion Resistant Paints – Method Study. Report T10–81M Horsholm, Denmark: Scandinavian Paint and Printing Ink Research Institute; 1981.
28. Rasband WS. ImageJ Software. Bethesda, MD: U. S. National Institute of Mental Health; 2010.
29. Miller RN. Rapid method for determining the degree of cleanliness of metal surfaces. Mater Protect Perform. 1973;12:31.
30. Miller RN. Method for measuring surface cleanliness. U.S. Patent 3,618,374 1971.
31. Durkee JB, Kuhn AT. Wettability measurements and cleanliness evaluation without Substantial cost. In: Mittal KL, ed. Contact Angle, Wettability and Adhesion. Leiden, The Netherlands: VSP/Brill; 2008;115–138. Contact Angle, Wettability and Adhesion vol. 5.
32. Williams DL, Kuhn AT, O’Bryon TM, Konarik MM, Huskey JE. Contact angle measurements using cell phone cameras to implement the Bikerman method. Galvanotechnik. 2011;109:1718.
33. Roberts B. Meazure Ver 2.0 Build 158 Software. CA: C-Thing Software, Mountain View; 2004.
34. Langmuir I, Schaefer VJ. The effect of dissolved salts on insoluble monolayers. J Am Chem Soc. 1937;59:2400.
35. Livereel Contact-θ-meter, Pearson Panke Equipment Ltd., London, UK.
36. Krüss GmbH, Hamburg, Germany TVA100 Contact Angle Measuring Module. (accessed 11.12.12) http://www.kruss.de/en/products/contact-angle/top-view-contact-angle-analyzer-module-tva100.html.
37. ASTM D5725-99(2008), Standard Test Method for Surface Wettability and Absorbency of Sheeted Materials Using an Automated Contact Angle Tester, (Withdrawn 2010), American Society for Testing and Materials, Conshohocken, PA, 2008. Replaced by TAPPI T 558 Om-10, Surface Wettability Absorbency Sheeted Mater. Using Automated Contact Angle Tester, Tech. Assoc. Pulp Paper Ind., Norcross, GA, 2010.
38. Specification Sheet uPrintSE, Stratasys Inc., Eden Prairie, MN. (accessed 11.12.12) URL http://www.uprint3dprinting.com/pdfs/specs/uPrintSE_SEPlus_3DPrintPack.pdf.