
4
Essentials of Data Wrangling
Menal Dahiya, Nikita Malik* and Sakshi Rana
Dept. of Computer Applications, Maharaja Surajmal Institute, Janakpuri, New Delhi, India
Abstract
Fundamentally, data wrangling is an elaborate process of transforming, enriching, and mapping data from one raw data form into another, to make it more valuable for analysis and enhancing its quality. It is considered as a core task within every action that is performed in the workflow framework of data projects. Wrangling of data begins from accessing the data, followed by transforming it and profiling the transformed data. These wrangling tasks differ according to the types of transformations used. Sometimes, data wrangling can resemble traditional extraction, transformation, and loading (ETL) processes. Through this chapter, various kinds of data wrangling and how data wrangling actions differ across the workflow are described. The dynamics of data wrangling, core transformation and profiling tasks are also explored. This is followed by a case study based on a dataset on forest fires, modified using Excel or Python language, performing the desired transformation and profiling, and presenting statistical and visualization analyses.
Keywords: Data wrangling, workflow framework, data transformation, profiling, core profiling
4.1 Introduction
Data wrangling, which is also known as data munging, is a term that involves mapping data fields in a dataset starting from the source (its original raw form) to destination (more digestible format). Basically, it consists of variety of tasks that are involved in preparing the data for further analysis. The methods that you will apply for wrangling the data totally depends on the data that you are working on and the goal you want to achieve. These methods may differ from project to project. A data wrangling example could be targeting a field, row, or column in a dataset and implementing an action like cleaning, joining, consolidating, parsing or filtering to generate the required output. It can be a manual or machine-driven process. In cases where datasets are exceptionally big, automated data cleaning is required.
Data wrangling term is derived and defined as a process to prepare the data for analysis with data visualization aids that accelerates the faster process [1]. If the data is accurately wrangled then it ensures that we have entered quality data into analytics process. Data wrangling leads to effective decision making. Sometimes, for making any kind of required manipulation in the data infrastructure, it is necessary to have appropriate permission.
During the past 20 years, processing on data and the urbanity of tools has progressed, which makes it more necessary to determine a common set of techniques. The increased availability of data (both structured and unstructured) and the utter volume of it that can be stored and analyzed has changed the possibilities for data analysis—many difficult questions are now easier to answer, and some previously impossible ones are within reach [2]. There is a need for glue that helps to tie together the various parts of the data ecosystem, from JSON APIs (JavaScript Object Notation Application Programming Interface) to filtering and cleaning data to creating understandable charts. In addition to classic typical data, quality criteria such as accuracy, completeness, correctness, reliability, consistency, timeliness, precision, and conciseness are also an important aspect [3].
Some tasks of data wrangling include:
- Creating a dataset by getting data from various data sources and merging them for drawing the insights from the data.
- Identifying the outliers in the given dataset and eliminating them by imputing or deleting them.
- Removal of data that is either unnecessary or irrelevant to the project.
- Plotting graphs to study the relationship between the variables and to identify the trend and patterns across.
4.2 Holistic Workflow Framework for Data Projects
This section presents a framework that shows how to work with data. As one moves through the process of accessing, transforming, and using the data, there are certain common sequences of actions that are performed. The goal is to cover each of these processes. Data wrangling also constitutes a promising direction for visual analytics research, as it requires combining automated techniques (example, discrepancy detection, entity resolution, and semantic data type inference) with interactive visual interfaces [4].
Before deriving direct, automated value we practice to derive indirect, human-mediated value from the given data. For getting the expected valuable result by an automated system, we need to assess whether the core quality of our data is sufficient or not. Report generation and then analyzing it is a good practice to understand the wider potential of the data. Automated systems can be designed to use this data.
This is how the data projects progress: starting from short-term answering of familiar questions, to long-term analyses that assess the quality and potential applications of a dataset and at last to designing the systems that will use the dataset in an automated way. Undergoing this complete process our data moves through three main stages of data wrangling: raw, refined, and production, as shown in Table 4.1.
4.2.1 Raw Stage
Discovering is the first step to data wrangling. Therefore, in the raw stage, the primary goal is to understand the data and getting an overview of your data. To discover what kinds of records are in the data, how are the record fields encoded and how does the data relate to your organization, to the kinds of operations you have, and to the other existing data you are using. Get familiar with your data.
Table 4.1 Movement of data through various stages.
| Primary objectives | Data stage | ||
| Raw | Refined | Production | |
|
|
| |
4.2.2 Refined Stage
After seeing the trends and patterns that will be helpful to conceptualize what kind of analysis you may want to do and being armed with an understanding of the data, you can then refine the data for intense exploration. When you collect raw data, initially are in different sizes and shapes, and do not have any definite structure. We can remove parts of the data that are not being used, reshaping the elements that are poorly formatted, and establishing relationships between multiple datasets. Data cleaning tools are used to remove errors that could influence your downstream analysis in a negative manner.
4.2.3 Production Stage
Once the data to be worked with is properly transformed and cleaned for analysis after completely understanding it, it is time to decide if all the data needed for the task at hand is there. Once the quality of data and its potential applications in automated systems are understood, the data can be moved to the next stage, that is, the production stage. On reaching this point, the final output is pushed downstream for the analytical needs.
Only a minority of data projects ends up in the raw or production stages, and the majority end up in the refined stage. Projects ending in the refined stage will add indirect value by delivering insights and models that drive better decisions. In some cases, these projects might last multiple years [2].
4.3 The Actions in Holistic Workflow Framework
4.3.1 Raw Data Stage Actions
There are mainly three actions that we perform in the raw data stage as shown in Figure 4.1.
- Focused on outputting data, there are two ingestion actions:
- Ingestion of data
- Focused on outputting insights and information derived from the data:
- Creating the generic metadata
- Creating the propriety metadata.

Figure 4.1 Actions performed in the raw data stage.
4.3.1.1 Data Ingestion
Data ingestion is the shipment of data from variegated sources to a storage medium where it can be retrieved, utilized, and analyzed to a data warehouse, data mart or database. This is the key step for analytics. Because of the various kinds of spectrum, the process of ingestion can be complex in some areas. In less complex areas many persons get their data as files through channels like FTP websites, emails. Other more complex areas include modern open-source tools which permit more comminuted and real-time transfer of data. In between these, more complex and less complex spectrum are propriety platforms, which support a variety of data transfer. These include Informatica Cloud, Talend, which is easy to maintain even for the people who does not belong to technical areas.
In the traditional enterprise data warehouses, some initial data transformation operations are involved in ingestion process. After the transformation when it is totally matched to the syntaxes that are defined by the warehouse, the data is stored in locations which are predefined. In some cases, we have to add on new data to the previous data. This process of appending newly arrived data can be complex if the new data contains edit to the previous data. This leads to ingest new data into separate locations, where certain rules can be applied for merging during the process of refining. In some areas, it can be simple where we just add new records at the end of the prior records.
4.3.1.2 Creating Metadata
This stage occurs when the data that you are ingesting is unknown. In this case, you do not how to work with your data and what results can you expect from it. This leads to the actions that are related to the creation of metadata. One action is known as creating generic metadata, which focuses on understanding the characteristics of your data. Other action is of making a determination about the data’s value by using the characteristics of your data. In this action, custom metadata is created. Dataset contains records and fields, which means rows and columns. You should focus on understanding the following things while describing your data:
- Structure
- Accuracy
- Temporality
- Granularity
- Scope of your data
Based on the potential of your present data, sometimes, it is required to create custom metadata in the discovery process. Generic metadata is useful to know how to properly work with the dataset, whereas custom metadata is required to perform specific analysis.
4.3.2 Refined Data Stage Actions
After the ingestion and complete understanding of your raw data, the next essential step includes the refining of data and exploring the data through analyses. Figure 4.2 shows the actions performed in this stage. The primary actions involve in this stage are:
- Responsible for generating refined data which allows quick application to a wide range of analyses:
- Generate Ad-Hoc Reports
- Responsible for generating insights and information that are generated from the present data, which ranges from general reporting to further complex structures and forecasts:
- Prototype modeling
The all-embracing motive in designing and creating the refined data is to simplify the predicted analyses that have to perform. As we will not foresee all of the analyses that have to be performed; therefore, we look at the patterns that are derived from the initial analyses, draw insights and get inspired from them to create new analysis directions that we had not considered previously. After refining the datasets, we compile them or modify them. Very often, it is required to repeat the actions in refining stage.

Figure 4.2 Actions performed in refined data stage.
In this stage, our data is transformed the most in the process of designing and preparing the refined data. While creating the metadata in the raw stage if there we any errors in the dataset’s accuracy, time, granularity, structure or scope, those issues must be resolved here during this stage.
4.3.3 Production Data Stage Actions
After refining the data, we reach at a stage where we start getting valuable insights from the dataset, its time separating the analyses (Figure 4.3). By separating, it means that you will be able to detect which analyses you have to do on a regular basis and which ones were enough for one-time analyses.
- Even after refining the data, when creating the production data, it is required to optimize your data. After that monitoring and scheduling the flow of this ideal data after optimization and maintaining regular reports and data-driven products and services.

Figure 4.3 Actions performed in production data stage.
4.4 Transformation Tasks Involved in Data Wrangling
Data wrangling is a core iterative process that throws up the cleanest, most useful data possible before you start your actual analysis [5]. Transformation is one of the core actions that are involved in data wrangling. Another task is profiling, and we need to quick iterate between these two actions. Now we will explore the transformation tasks that are present in the process of data wrangling.
These are the core transformation actions that we need to apply on the data:
- Structuring
- Enriching
- Cleansing
4.4.1 Structuring
These are the actions that are used to change the schema and form of the data. Structuring mainly involves shifting records around and organizing the data. It is a very simple kind of transformation; sometimes it can be just changing the order of columns within a table. It also includes summarizing record field values. In some cases, it is required to break record fields into subcomponents or combining fields together which results in a complex transformation.
The most complex kind of transformation is the inter-record structuring which includes aggregations and pivots of the data:
Aggregation—It allows switching in the granularity of the dataset. For example, switching from individual person to segment of persons.
Pivoting—It includes shifting entries (records) into columns (fields) and vice-versa.
4.4.2 Enriching
These are the actions that are used to add elementary new records from multiple datasets to the dataset and strategize about how this new additional data might raise it. The typical structuring transformations are:
- Join: It combines data from various tables based on a matching condition between the linking records.
- Union: It combines the data into new rows by blending multiple datasets together. It concatenates rows from different datasets by matching up rows It returns distinct rows.
Besides joins and unions, insertion of metadata and computing new data entries from the existing data in your dataset which results in the generation of generic metadata is another common task. This inserted metadata can be of two types:
- Independent of the dataset
- Specific to the dataset
4.4.3 Cleansing
These are the actions that are used to resolve the errors or to fix any kind of irregularities if present in your dataset. It fixes the quality and consistency issues and makes the dataset clean. High data quality is not just desirable, but one of the main criteria that determine whether the project is successful, and the resulting information is correct [6]. It basically includes manipulating single column values within the rows. The most common type is to fix the missing or the NULL values in the dataset, implementing formatting and hence increasing the quality of data.
4.5 Description of Two Types of Core Profiling
In order to understand your data before you start transforming or analyzing it, the first step is profiling. Profiling leads to data transformations. This helps in reviewing source data for content and better quality [7].
One challenge of data wrangling is that reformatting and validating data require transforms that can be difficult to specify and evaluate. For instance, splitting data into meaningful records and attributes often involves regular expressions that are error-prone and tedious to interpret [8, 9].
Profiling can be divided on the basis of unit of data they work on. There are two kinds of profiling:
- Individual values profiling
- Set-based profiling
4.5.1 Individual Values Profiling
There are two kinds of constraints in individual values profiling. These are:
- Syntactic
- Semantic
4.5.1.1 Syntactic
It focuses on the formats, for example, the format of date is MM-DD-YYYY. Therefore, date value should be in this format only.
4.5.1.2 Semantic
Semantic constraints are built in context or exclusive business logic; for example, your company is closed for business on a festival so no transactions should exist on that particular day. This helps us to determine if the individual record field value or entire record is valid or not.
4.5.2 Set-Based Profiling
This kind of profiling mainly focuses on the shape of values and how the data is distributed within a single record field or in the range of relationships between more than one record field.
For example, there might be higher retail sales in holidays than a non-holiday. Thus, you could build a set-based profile to ensure that sales are distributed across the month as it was expected.
4.6 Case Study
Wrangle the data into a dataset that provides meaningful insights to carryout cleansing process; it requires writing codes in idiosyncratic characters in languages of Perl, R and editing manually with tools like MS-Excel [10].
- In this case study, we have a Brazilian Fire Dataset, as shown in Figure 4.4 (https://product2.s3-ap-southeast-2.amazonaws.com/Activity_files/MC_DAP01/Brazilian-fire-dataset.csv).
The goal is to perform the following tasks:
- Interpretation of the imported data through a dataset
- Descriptive statistics of the dataset
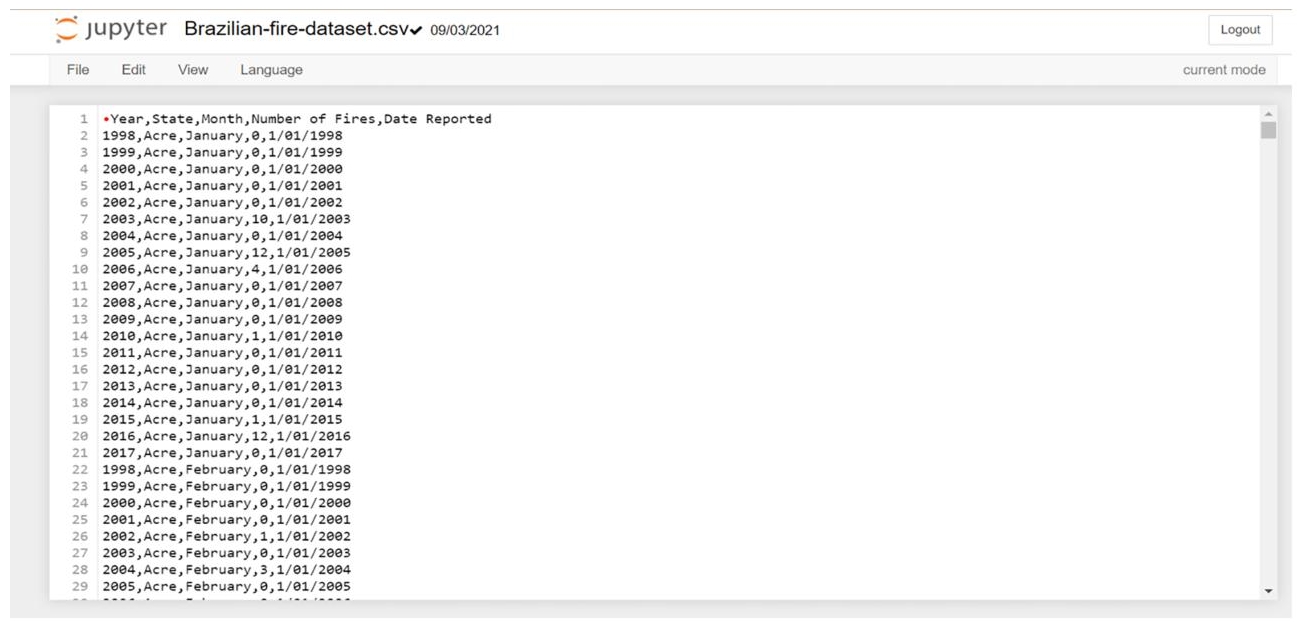
Figure 4.4 This is how the dataset looks like. It consists of number of records in it.
- Plotting graphs
- Creating a Data Frame and working on certain activities using Python
Kandel et al. [11] have discussed a wide range of topics and problems in the field of data wrangling, especially with regard to visualization. For example, graphs and charts can help identify data quality issues, such as missing values.
4.6.1 Importing Required Libraries
- Pandas, NumPy, and Matplotlib
- Pandas is a Python library for data analysis. Padas is built on top of two core Python libraries—matplotlib for data visualization and NumPy for mathematical operations.
- How we import these libraries can be seen in Figure 4.5 below
In this above code, we created a DataFrame by the name of df_fire and in this DataFrame we have loaded a csv file using Pandas read_csv( ) function. Full Path and Name of the file is ‘brazilian-fire-dataset.csv’. The result is shown in Figure 4.6.

Figure 4.5 Snippet of libraries included in the code.

Figure 4.6 Snippet of dataset used.
Here we can see that the total number of records is 6454 rows and there are five columns. The column “Number of Fires” is having float datatype.
4.6.2 Changing the Order of the Columns in the Dataset
In the first line of code, we are specifying the order of the column. In second line we have changed the datatype of column “Number of Fires” to Integer type. Then we will rearrange the columns in the dataset and print it. The result is shown in Figure 4.7 and Figure 4.8.
4.6.3 To Display the DataFrame (Top 10 Rows) and Verify that the Columns are in Order
For displaying top 10 records of the dataset the .head() function is used as follows (Figure 4.9).

Figure 4.7 Snippet of manipulations on dataset.

Figure 4.8 The order of the columns has been changed and the datatype of “Number of fires” has been changed from float to int.

Figure 4.9 Top 10 records of the dataset.
4.6.4 To Display the DataFrame (Bottom 10 rows) and Verify that the Columns Are in Order
For displaying top 10 records of the dataset, we use .tail( ) function as follows (Figure 4.10).
4.6.5 Generate the Statistical Summary of the DataFrame for All the Columns
To get the statistical summary of the data frame for all the columns we use the .describe() function. The result is shown in Figure 4.11.

Figure 4.10 Result—Bottom 10 records of the dataset.

Figure 4.11 Here we can get the count, unique, top, freq, mean, std, min, quartiles & percentiles, max etc. of all the respected columns.
4.7 Quantitative Analysis
4.7.1 Maximum Number of Fires on Any Given Day
Here, first we will get the maximum number of fires on any given day in the dataset by using the .max( ) function. Then we will display the record that is having this number of fires. The result is shown in Figure 4.12.

Figure 4.12 Maximum number of fires is 998 and was reported in the month of September 2000 in the state of Amazonas.
4.7.2 Total Number of Fires for the Entire Duration for Every State
- Pandas group by is used for grouping the data according to the categories and apply a function to the categories. It also helps to aggregate data efficiently. Pandas dataframe. groupby() function is used to split the data into groups based on some criteria. Pandas objects can be split on any of their axes. The abstract definition of grouping is to provide a mapping of labels to group names [12].
- .agg( ) Dataframe.aggregate() function is used to apply some aggregation across one or more column. Aggregate using callable, string, dict, or list of string/callables. Most frequently used aggregations are: sum, min and max [13, 14].
The result is shown in Figure 4.13 below.
For example, Acre-18452, Bahia-44718 etc. Here because of the .head() function we are able to see only top 10 values.

Figure 4.13 The data if grouped by state and we can get the total number of fires in a particular state.

Figure 4.14 Maximum of total fires recorded were 51118, and this was for State—Sao Paulo Minimum of total fires recorded were 3237, and this was for State—Sergipe.
4.7.3 Summary Statistics
- By using .describe() we can get the statistical summary of the dataset (Figure 4.14).
4.8 Graphical Representation
4.8.1 Line Graph
Following in Figure 4.15 code is given. Here Plot function in matplotlib is used.
In Figure 4.16, the line plots depict the values on the series of data points that are connected with straight lines.
4.8.2 Pie Chart
For getting the values of total numbers of fires in a particular month, we will again use the GroupBy and aggregate function and get the month fires.

Figure 4.15 Code snippet for line graph.

Figure 4.16 Line graph.

After getting the required data, we will plot the pie chart as given in Figure 4.18.
In Figure 4.18, we can see that the months of July, October, and November are having the highest numbers of fires. It is showing percentages of a whole, and it represents percentages at a set point in time. Pie charts do not show changes over time.
4.8.3 Bar Graph
For plotting the bar graph, we have to get the values for the total number of fires in a particular year (Figure 4.19).

Figure 4.18 Pie chart.
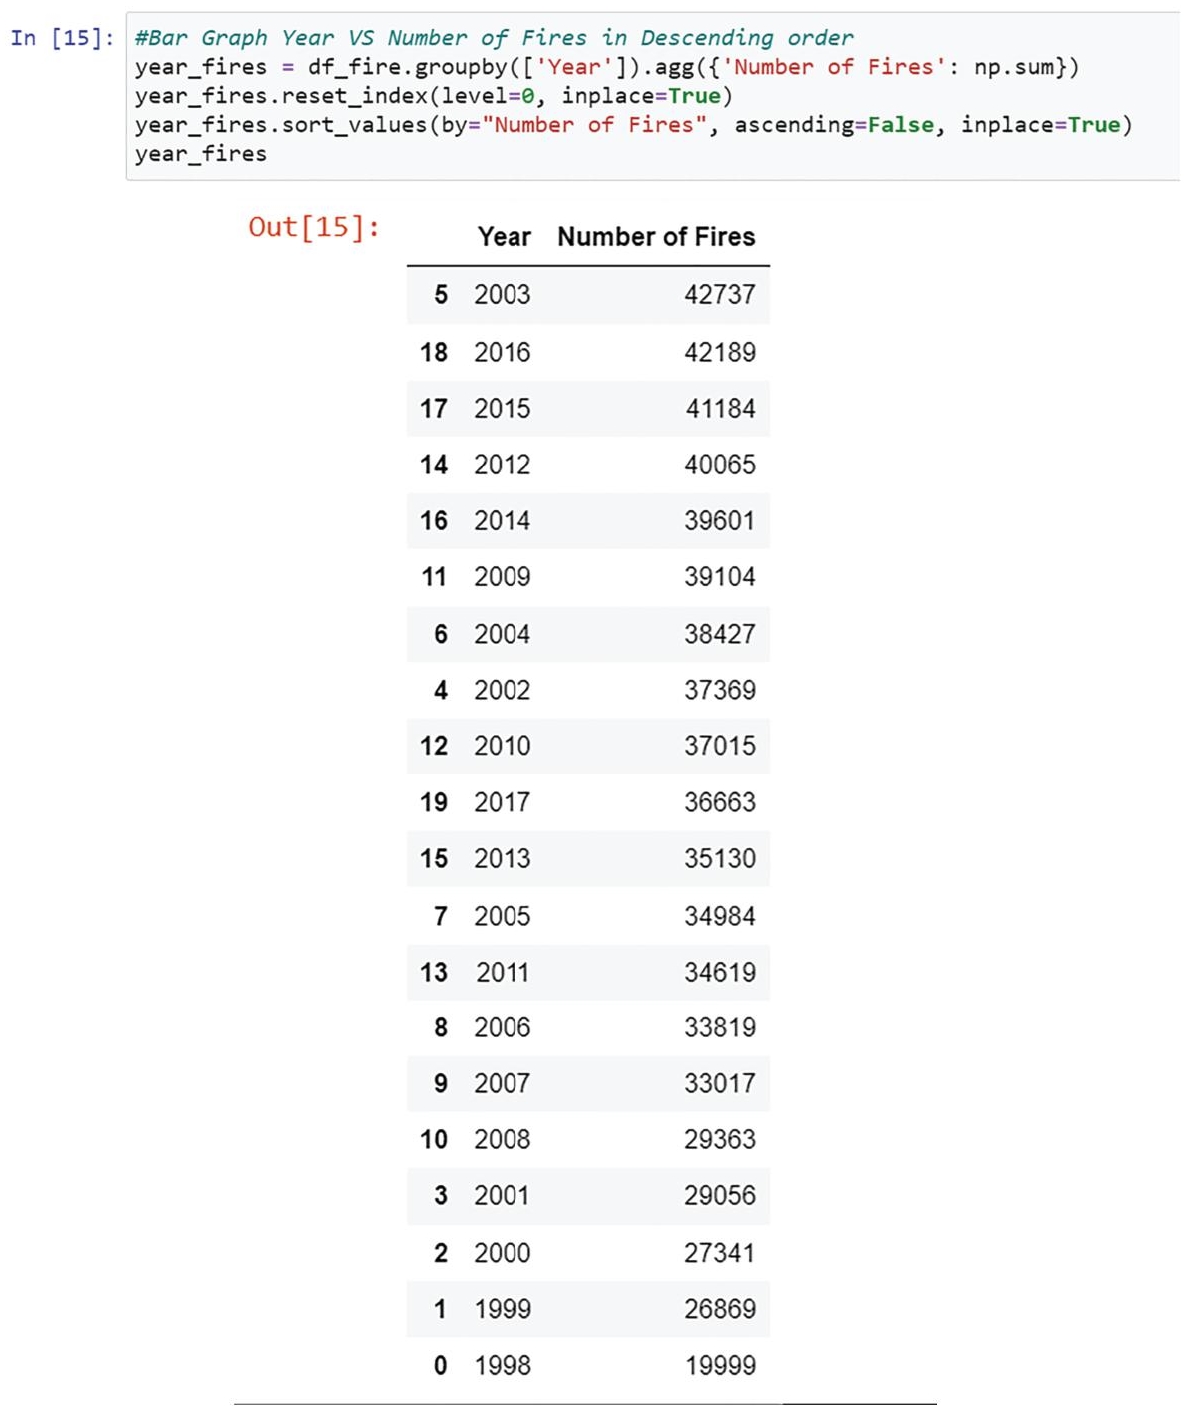
Figure 4.19 Code snippet for creating bar graph.

Figure 4.20 Bar graph.
After getting the values of the year and the number of fires in descending order, we will plot the bar graph. We use bar function from Matplotlib to achieve it (Figure 4.20).
In Figure 4.20, it can be observed that the highest number of fires is in the year 2003 and the lowest is in 1998. The graph shows the number of fires in decreasing order.
4.9 Conclusion
With the increasing rate of data amount and vast quantities of diverse data sources providing this data, many issues are faced by organizations. They are being compelled to use the available data and to produce competitive benefits for pulling through in the long run. For this, data wrangling offers an apt solution, of which, data quality is a significant aspect. Actions in data wrangling can further be divided into three parts which describe how the data is progressed through different stages. Transformation and profiling are the core processes which help us to iterate through records, add new values and, to detect errors and eliminate them. Data wrangling tools also help us to discover the problems present in data such as outliers, if any. Many quality problems can be recognized by inspecting the raw data; others can be detected by diagrams or other various kinds of representations. Missing values, for instance, are indicated by gaps in the graphs, wherein the type of representation plays a crucial role as it has great influence.
References
- 1. Cline, D., Yueh, S., Chapman, B., Stankov, B., Gasiewski, A., Masters, D., Mahrt, L., NASA cold land processes experiment (CLPX 2002/03): Airborne remote sensing. J. Hydrometeorol., United States of America, 10, 1, 338–346, 2009.
- 2. Rattenbury, T., Hellerstein, J.M., Heer, J., Kandel, S., Carreras, C., Principles of Data Wrangling: Practical Techniques for Data Preparation, O’Reilly Media, Inc, 2017. ISBN: 9781491938928
- 3. Wang, R.Y. and Strong, D.M., Beyond accuracy: What data quality means to data consumers. J. Manage. Inf. Syst., 12, 4, 5–33, 1996.
- 4. Cook, K.A. and Thomas, J.J., Illuminating the Path: The Research and Development Agenda for Visual Analytics (No. PNNL-SA-45230), Pacific Northwest National Lab (PNNL), Richland, WA, United States, 2005.
- 5. https://www.expressanalytics.com/blog/what-is-data-wrangling-what-are-the-steps-in-data-wrangling/ [Date: 2/4/2022]
- 6. Rud, O.P., Data Mining Cookbook: Modeling Data for Marketing, Risk, and Customer Relationship Management, John Wiley & Sons, United States of America and Canada, 2001. ISBN-10 0471385646
- 7. https://panoply.io/analytics-stack-guide/ [Date: 2/5/2022]
- 8. Blackwell, A.F., XIII SWYN: A visual representation for regular expressions, in: Your Wish is My Command, pp. 245–270, Morgan Kaufmann, Massachusetts, United States of America, 2001. ISBN: 9780080521459
- 9. Scaffidi, C., Myers, B., Shaw, M., Intelligently creating and recommending reusable reformatting rules, in: Proceedings of the 14th International Conference on Intelligent User Interfaces, pp. 297–306, February 2009.
- 10. Kandel, S., Heer, J., Plaisant, C., Kennedy, J., Van Ham, F., Riche, N.H., Buono, P., Research directions in data wrangling: Visualizations and transformations for usable and credible data. Inf. Vis., 10, 4, 271–288, 2011.
- 11. Kandel, S., Heer, J., Plaisant, C., Kennedy, J., Van Ham, F., Riche, N.H., Buono, P., Research directions in data wrangling: Visualizations and transformations for usable and credible data. Inf. Vis., 10, 4, 271–288, 2011.
- 12. https://www.geeksforgeeks.org/python-pandas-dataframe-groupby/ Date: 03/05/2022]
- 13. https://www.geeksforgeeks.org/python-pandas-dataframe-aggregate/ [Date: 12/11/2021].
- 14. Swetha, K.R., Niranjanamurthy, M., Amulya, M.P., Manu, Y.M., Prediction of pneumonia using big data, deep learning and machine learning techniques. 2021 6th International Conference on Communication and Electronics Systems (ICCES), pp. 1697–1700, 2021, doi: 10.1109/ICCES51350.2021.9489188.
Note
- *Corresponding author: [email protected]