
1
Basic Principles of Data Wrangling
Akshay Singh*, Surender Singh and Jyotsna Rathee
Department of Information Technology, Maharaja Surajmal Institute of Technology, Janakpuri, New Delhi, India
Abstract
Data wrangling is considered to be a crucial step of data science lifecycle. The quality of data analysis directly depends on the quality of data itself. As the data sources are increasing with a fast pace, it is more than essential to organize the data for analysis. The process of cleaning, structuring, and enriching raw data into the required data format in order to make better judgments in less time is known as data wrangling. It entails the manual conversion and mapping of data from one raw form to another in order to facilitate data consumption and organization. It is also known as data munging, meaning “digestible” data. The iterative process of gathering, filtering, converting, exploring, and integrating data come under the data wrangling pipeline. The foundation of data wrangling is data gathering. The data is extracted, parsed, and scraped before the process of removing unnecessary information from raw data. Data filtering or scrubbing includes removing corrupt and invalid data, thus keeping only the needful data. The data is transformed from unstructured to a bit structured form. Then, the data is converted from one format to another format. To name a few, some common formats are CSV, JSON, XML, SQL, etc. The preanalysis of data is to be done in data exploration step. Some preliminary queries are applied on the data to get the sense of the available data. The hypothesis and statistical analysis can be formed after basic exploration. After exploring the data, the process of integrating data begins in which the smaller pieces of data are added up to form big data. After that, validation rules are applied on data to verify its quality, consistency, and security. In the end, analysts prepare and publish the wrangled data for further analysis. Various platforms available for publishing the wrangled data are GitHub, Kaggle, Data Studio, personal blogs, websites, etc.
Keywords: Data wrangling, big data, data analysis, cleaning, structuring, validating, optimization
1.1 Introduction
Meaningless raw facts and figures are termed as data which are of no use. Data are analyzed so that it provides certain meaning to raw facts, which is known as information. In current scenario, we have ample amount of data that is increasing many folds day by day which is to be managed and examined for better performance for meaningful analysis of data. To answer such inquiries, we must first wrangle our data into the appropriate format. The most time-consuming part and essential part is wrangling of data [1].
Definition 1—“Data wrangling is the process by which the data required by an application is identified, extracted, cleaned and integrated, to yield a data set that is suitable for exploration and analysis.” [2]
Definition 2—“Data wrangling/data munging/data cleaning can be defined as the process of cleaning, organizing, and transforming raw data into the desired format for analysts to use for prompt decision making.”
Definition 3—“Data wrangling is defined as an art of data transformation or data preparation.” [3]
Definition 4—“Data wrangling term is derived and defined as a process to prepare the data for analysis with data visualization aids that accelerates the faster process.” [4]
Definition 5—“Data wrangling is defined as a process of iterative data exploration and transformation that enables analysis.” [1]
Although data wrangling is sometimes misunderstood as ETL techniques, these two are totally different with each other. Extract, transform, and load ETL techniques require handiwork from professionals and professionals at different levels of the process. Volume, velocity, variety, and veracity, i.e., 4 V’s of big data becomes exorbitant in ETL technology [2].
We can categorize values into two sorts along a temporal dimension in any phase of life where we have to deal with data: near-term value and long-term value. We probably have a long list of questions we want to address with our data in the near future. Some of these inquiries may be ambiguous, such as “Are consumers actually changing toward communicating with us via their mobile devices?” Other, more precise inquiries can include: “When will our clients’ interactions largely originate from mobile devices rather than desktops or laptops?” Various research work, different projects, product sale, company’s new product to be launched, different businesses etc. can be tackled in less time with more efficiency using data wrangling.
- Aim of Data Wrangling: Data wrangling aims are as follows:
- Improves data usage.
- Makes data compatible for end users.
- Makes analysis of data easy.
- Integrates data from different sources, different file formats.
- Better audience/customer coverage.
- Takes less time to organize raw data.
- Clear visualization of data.
In the first section, we demonstrate the workflow framework of all the activities that fit into the process of data wrangling by providing a workflow structure that integrates actions focused on both sorts of values. The key building pieces for the same are introduced: data flow, data wrangling activities, roles, and responsibilities [10]. When commencing on a project that involves data wrangling, we will consider all of these factors at a high level.
The main aim is to ensure that our efforts are constructive rather than redundant or conflicting, as well as within a single project by leveraging formal language as well as processes to boost efficiency and continuity. Effective data wrangling necessitates more than just well-defined workflows and processes.
Another aspect of value to think about is how it will be provided within an organization. Will organizations use the exact values provided to them and analyze the data using some automated tools? Will organizations use the values provided to them in an indirect manner, such as by allowing employees in your company to pursue a different path than the usual?
- Indirect Value: By influencing the decisions of others and motivating process adjustments. In the insurance industry, for example, risk modeling is used.
- Direct Value: By feeding automated processes, data adds value to a company. Consider Netflix’s recommendation engine [6].
Data has a long history of providing indirect value. Accounting, insurance risk modeling, medical research experimental design, and intelligence analytics are all based on it. The data used to generate reports and visualizations come under the category of indirect value. This can be accomplished when people read our report or visualization, assimilate the information into their existing world knowledge, and then apply that knowledge to improve their behaviors. The data here has an indirect influence on other people’s judgments. The majority of our data’s known potential value will be given indirectly in the near future.
Giving data-driven systems decisions for speed, accuracy, or customization provides direct value from data. The most common example is resource distribution and routing that is automated. This resource is primarily money in the field of high-frequency trading and modern finance. Physical goods are routed automatically in some industries, such as Amazon or Flipkart. Hotstar and Netflix, for example, employ automated processes to optimize the distribution of digital content to their customers. For example, antilock brakes in automobiles employ sensor data to channel energy to individual wheels on a smaller scale. Modern testing systems, such as the GRE graduate school admission exam, dynamically order questions based on the tester’s progress. A considerable percentage of operational choices is directly handled by data-driven systems in all of these situations, with no human input.
1.2 Data Workflow Structure
In order to derive direct, automated value from our data, we must first derive indirect, human-mediated value. To begin, human monitoring is essential to determine what is “in” our data and whether the data’s quality is high enough to be used in direct and automated methods. We cannot anticipate valuable outcomes from sending data into an automated system blindly. To fully comprehend the possibilities of the data, reports must be written and studied. As the potential of the data becomes clearer, automated methods can be built to utilize it directly. This is the logical evolution of information sets: from immediate solutions to identified problems to longer-term analyses of a dataset’s fundamental quality and potential applications, and finally to automated data creation systems. The passage of data through three primary data stages:
- raw,
- refined,
- produced,
is at the heart of this progression.
1.3 Raw Data Stage
In the raw data stage, there are three main actions: data input, generic metadata creation, and proprietary metadata creation. As illustrated in

Figure 1.1 Actions in the raw data stage.
Figure 1.1, based on their production, we can classify these actions into two groups. The two ingestion actions are split into two categories, one of which is dedicated to data output. The second group of tasks is metadata production, which is responsible for extracting information and insights from the dataset.
The major purpose of the raw stage is to uncover the data. We ask questions to understand what our data looks like when we examine raw data. Consider the following scenario:
- What are the different types of records in the data?
- How are the fields in the records encoded?
- What is the relationship between the data and our organization, the kind of processes we have, and the other data we already have?
1.3.1 Data Input
The ingestion procedure in traditional enterprise data warehouses includes certain early data transformation processes. The primary goal of these transformations is to transfer inbound components to their standard representations in the data warehouse.
Consider the case when you are ingesting a comma separated file. The data in the CSV file is saved in predetermined locations after it has been modified to fit the warehouse’s syntactic criteria. This frequently entails adding additional data to already collected data. In certain cases, appends might be as simple as putting new records to the “end” of a dataset. The add procedure gets more complicated when the incoming data contains both changes to old data and new data. In many of these instances, you will need to ingest fresh data into a separate place, where you can apply more intricate merging criteria during the refined data stage. It is important to highlight, however, that a separate refined data stage will be required throughout the entire spectrum of ingestion infrastructures. This is due to the fact that refined data has been wrangled even further to coincide with anticipated analysis.
Data from multiple partners is frequently ingested into separate datasets, in addition to being stored in time-versioned partitions. The ingestion logic is substantially simplified as a result of this. As the data progresses through the refinement stage, the individual partner data is harmonized to a uniform data format, enabling for quick cross-partner analytics.
1.3.2 Output Actions at Raw Data Stage
In most circumstances, the data you are consuming in first stage is predefined, i.e., what you will obtain and how to use it are known to you. What will when some new data is added to the database by the company? To put it another way, what can be done when the data is unknown in part or in whole? When unknown data is consumed, two additional events are triggered, both of which are linked to metadata production. This process is referred to as “generic metadata creation.” A second activity focuses on determining the value of your data based on the qualities of your data. This process is referred to as “custom metadata creation.”
Let us go over some fundamentals before we get into the two metadata-generating activities. Records are the building blocks of datasets. Fields are what make up records. People, items, relationships, and events are frequently represented or corresponded to in records. The fields of a record describe the measurable characteristics of an individual, item, connection, or incident. In a dataset of retail transactions, for example, every entry could represent a particular transaction, with fields denoting the purchase’s monetary amount, the purchase time, the specific commodities purchased, etc.
In relational database, you are probably familiar with the terms “rows” and “columns.” Rows contain records and columns contain fields. Representational consistency is defined by structure, granularity, accuracy, temporality, and scope. As a result, there are also features of a dataset that your wrangling efforts must tune or improve. The data discovery process frequently necessitates inferring and developing specific information linked to the potential value of your data, in addition to basic metadata descriptions.
1.3.3 Structure
The format and encoding of a dataset’s records and fields are referred to as the dataset’s structure. We can place datasets on a scale based on how homogeneous their records and fields are. The dataset is “rectangular” at one end of the spectrum and can be represented as a table. The table’s rows contain records and columns contain fields in this format. You may be dealing with a “jagged” table when the data is inconsistent. A table like this is not completely rectangular any longer. Data formats like XML and JSON can handle data like this with inconsistent values.
Datasets containing a diverse set of records are further along the range. A heterogeneous dataset from a retail firm, for example, can include both customer information and customer transactions. When considering the tabs in a complex Excel spreadsheet, this is a regular occurrence. The majority of analysis and visualization software will need that these various types of records be separated and separate files are formed.
1.3.4 Granularity
A dataset’s granularity relates to the different types of things that represents the data. Data entries represent information about a large number of different instances of the same type of item. The roughness and refinement of granularity are often used phrases. This refers to the depth of your dataset’s records, or the number of unique entities associated with a single entry, in the context of data. A data with fine granularity might contain an entry indicating one transaction by only one consumer.
You might have a dataset with even finer granularity, with each record representing weekly combined revenue by location. The granularity of the dataset may be coarse or fine, depending on your intended purpose. Assessing the granularity of a dataset is a delicate process that necessitates the use of organizational expertise. These are some examples of granularity-related custom metadata.
1.3.5 Accuracy
The quality of a data is measured by the accuracy. The records used to populate the dataset’s fields should be consistent and correct. Consider the case of a customer activities dataset. This collection of records includes information on when clients purchased goods. The record’s identification may be erroneous in some cases; for example, a UPC number can have missing digits or it can be expired. Any analysis of the dataset would be limited by inaccuracies, of course. Spelling mistakes, unavailability of the variables, numerical floating value mistakes, are all examples of common inaccuracies.
Some values can appear more frequently and some can appear less frequently in a database. This condition is called frequency outliers which can also be assessed with accuracy. Because such assessments are based on the knowledge of an individual organization and making frequency assessments is essentially a custom metadata matter.
1.3.6 Temporality
A record present in the table is a snapshot of a commodity at a specific point of time. As a result, even if a dataset had a consistent representation at the development phase and later some changes may cause it to become inaccurate or inconsistent. You could, for example, utilize a dataset of consumer actions to figure out how many goods people own. However, some of these things may be returned weeks or months after the initial transaction. The initial dataset is not the accurate depiction of objects purchased by a customer, despite being an exact record of the original sales transaction.
The time-sensitive character of representations, and thus datasets, is a crucial consideration that should be mentioned explicitly. Even if time is not clearly recorded, then also it is very crucial to know the influence of time on the data.
1.3.7 Scope
A dataset’s scope has two major aspects. The number of distinct properties represented in a dataset is the first dimension. For example, we might know when a customer action occurred and some details about it. The second dimension is population coverage by attribute. Let us start with the number of distinct attributes in a dataset before moving on to the importance of scope. In most datasets, each individual attribute is represented by a separate field. There exists a variety of fields in a dataset with broad scope and in case of datasets with narrow scope, there exists a few fields.
The scope of a dataset can be expanded by including extra field attributes. Depending on your analytics methodology, the level of detail necessary may vary. Some procedures, such as deep learning, demand for keeping a large number of redundant attributes and using statistical methods to reduce them to a smaller number. Other approaches work effectively with a small number of qualities. It is critical to recognize the systematic bias-ness in a dataset since any analytical inferences generated from the biased dataset would be incorrect. Drug trial datasets are usually detailed to the patient level. If, on the other hand, the scope of the dataset has been deliberately changed by tampering the records of patients due to their death during trial or due to abnormalities shown by the machine, the analysis of the used medical dataset is shown misrepresented.
1.4 Refined Stage
We can next modify the data for some better analysis by deleting the parts of the data which have not used, by rearranging elements with bad structure, and building linkages across numerous datasets once we have a good knowledge of it. The next significant part is to refine the data and execute a variety of analysis after ingesting the raw data and thoroughly comprehending its metadata components. The refined stage, Figure 1.2, is defined by three main activities: data design and preparation, ad hoc reporting analysis, and exploratory modelling and forecasting. The first group focuses on the production of refined data that can be used in a variety of studies right away. The second group is responsible for delivering data-driven insights and information.

Figure 1.2 Actions in the refined stage.
1.4.1 Data Design and Preparation
The main purpose of creating and developing the refined data is to analyze the data in a better manner. Insights and trends discovered from a first set of studies are likely to stimulate other studies. In the refined data stage, we can iterate between operations, and we do so frequently.
Ingestion of raw data includes minimum data transformation—just enough to comply with the data storage system’s syntactic limitations. Designing and creating “refined” data, on the other hand, frequently necessitates a large change. We should resolve any concerns with the dataset’s structure, granularity, correctness, timing, or scope that you noticed earlier during the refined data stage.
1.4.2 Structure Issues
Most visualization and analysis tools are designed to work with tabular data, which means that each record has similar fields in the given order. Converting data into tabular representation can necessitate considerable adjustments depending on the structure of the underlying data.
1.4.3 Granularity Issues
It is best to create refined datasets with the highest granularity resolution of records you want to assess. We should figure out what distinguishes the customers that have larger purchases from the rest of customers: Is it true that they are spending more money on more expensive items? Do you have a greater quantity of stuff than the average person? For answering such questions, keeping a version of the dataset at this resolution may be helpful. Keeping numerous copies of the same data with different levels of granularity can make subsequent analysis based on groups of records easier.
1.4.4 Accuracy Issues
Another important goal in developing and refining databases is to address recognized accuracy difficulties. The main strategies for dealing with accuracy issues by removing records with incorrect values and Imputation, which replaces erroneous values with default or estimated values.
In certain cases, eliminating impacted records is the best course of action, particularly when number of records with incorrect values is minimal and unlikely to be significant. In many circumstances, removing these data will have little influence on the outcomes. In other cases, addressing inconsistencies in data, such as recalculating a client’s age using their date of birth and current date, may be the best option (or the dates of the events you want to analyze).
Making an explicit reference to time is often the most effective technique to resolve conflicting or incorrect data fields in your refined data. Consider the case of a client database with several addresses. Perhaps each address is (or was) correct, indicating a person’s several residences during her life. By giving date ranges to the addresses, the inconsistencies may be rectified. A transaction amount that defies current business logic may have happened before the logic was implemented, in which case the transaction should be preserved in the dataset to ensure historical analysis integrity.
In general, the most usable understanding of “time” involves a great deal of care. For example, there may be a time when an activity happened and a time when it was acknowledged. When it comes to financial transactions, this is especially true. In certain cases, rather than a timestamp, an abstract version number is preferable. When documenting data generated by software, for example, it may be more important to record the software version rather than the time it was launched. Similarly, knowing the version of a data file that was inspected rather than the time that the analysis was run may be more relevant in scientific study. In general, the optimum time or version to employ depends on the study’s characteristics; as a result, it is important to keep a record of all timestamps and version numbers.
1.4.5 Scope Issues
Taking a step back from individual record field values, it is also important to make sure your refined datasets include the full collection of records and record fields. Assume that your client data is split into many datasets (one containing contact information, another including transaction summaries, and so on), but that the bulk of your research incorporate all of these variables. You could wish to create a totally blended dataset with all of these fields to make your analysis easier.
Ensure that the population coverage in your altered datasets is understood, since this is likely the most important scope-related issue. This means that a dataset should explain the relationship between the collection of items represented by the dataset’s records (people, objects, and so on) and the greater population of those things in an acceptable manner (for example, all people and all objects) [6].
1.4.6 Output Actions at Refined Stage
Finally, we will go through the two primary analytical operations of the refined data stage: ad hoc reporting analyses and exploratory modelling and forecasting. The most critical step in using your data to answer specific questions is reporting. Dash boarding and business intelligence analytics are two separate sorts of reporting.
The majority of these studies are retrospective, which means they depend on historical data to answer questions about the past or present. The answer to such queries might be as simple as a single figure or statistic, or as complicated as a whole report with further discussion and explanation of the findings.
Because of the nature of the first question, an automated system capable of consuming the data and taking quick action is doubtful. The consequences, on the other hand, will be of indirect value since they will inform and affect others. Perhaps sales grew faster than expected, or perhaps transactions from a single product line or retail region fell short of expectations. If the aberration was wholly unexpected, it must be assessed from several perspectives. Is there an issue with data quality or reporting? If the data is authentic (i.e., the anomaly represents a change in the world, not just in the dataset’s portrayal of the world), can an anomaly be limited to a subpopulation? What additional alterations have you seen as a result of the anomaly? Is there a common root change to which all of these changes are linked through causal dependencies?
Modeling and forecasting analyses are often prospective, as opposed to ad hoc assessments, which are mostly retrospective. “Based on what we’ve observed in the past, what do we expect to happen?” these studies ask. Forecasting aims to anticipate future events such as total sales in the next quarter, customer turnover percentages next month, and the likelihood of each client renewing their contracts, among other things. These forecasts are usually based on models that show how other measurable elements of your dataset impact and relate to the objective prediction. The underlying model itself, rather than a forecast, is the most helpful conclusion for some analyses. Modeling is, in most cases, an attempt to comprehend the important factors that drive the behavior that you are interested in.
1.5 Produced Stage
After you have polished your data and begun to derive useful insights from it, you will naturally begin to distinguish between analyses that need to be repeated on a regular basis and those that can be completed once. Experimenting and prototyping (which is the focus of activities in the refined data stage) is one thing; wrapping those early outputs in a dependable, maintainable framework that can automatically direct people and resources is quite another. This places us in the data-gathering stage. Following a good set of early discoveries, popular comments include, “We should watch that statistic all the time,” and “We can use those forecasts to speed up shipping of specific orders.” Each of these statements has a solution using “production systems,” which are systems that are largely automated and have a well-defined level of robustness. At the absolute least, creating production data needs further modification of your model. The action steps included in the produced stage are shown in Figure 1.3.

Figure 1.3 Actions in the produced stage.
1.5.1 Data Optimization
Data refinement is comparable to data optimization. The optimum form of your data is optimized data, which is meant to make any further downstream effort to use the data as simple as feasible.
There are also specifications for the processing and storage resources that will be used on a regular basis to work with the data. The shape of the data, as well as how it is made available to the production system, will frequently be influenced by these constraints. To put it another way, while the goal of data refinement is to enable as many studies as possible as quickly as possible, the goal of data optimization is to facilitate a relatively small number of analysis as consistently and effectively as possible.
1.5.2 Output Actions at Produced Stage
More than merely plugging the data into the report production logic or the service providing logic is required for creating regular reports and data-driven products and services. Monitoring the flow of data and ensuring that the required structural, temporal, scope, and accuracy criteria are met over time is a substantial source of additional effort. Because data is flowing via these systems, new (or updated) data will be processed on a regular basis. New data will ultimately differ from its historical counterparts (maybe you have updated customer interaction events or sales data from the previous week). The border around allowable variation is defined by structural, temporal, scope, and accuracy constraints (e.g., minimum and maximum sales amounts or coordination between record variables like billing address and transaction currency). The reporting and product/ service logic must handle the variation within the restrictions [6].
This differs from exploratory analytics, which might use reasoning specific to the dataset being studied for speed or simplicity. The reasoning must be generalized for production reporting and products/services. Of course, you may narrow the allowable variations boundary to eliminate duplicate records and missing subsets of records. If that is the case, the logic for detecting and correcting these inconsistencies will most likely reside in the data optimization process.
Let us take a step back and look at the fundamentals of data use to assist motivate the organizational changes. Production uses, such as automated reports or data-driven services and products, will be the most valuable uses of your data. However, hundreds, if not thousands, of exploratory, ad hoc analyses are required for every production usage of your data. In other words, there is an effort funnel that starts with exploratory analytics and leads to direct, production value. Your conversation rate will not be 100%, as it is with any funnel. In order to identify a very limited number of meaningful applications of your data, you will need as many individuals as possible to explore it and derive insights. A vast number of raw data sources and exploratory analysis are necessary to develop a single useful application of your data, as shown in Figure 1.4.
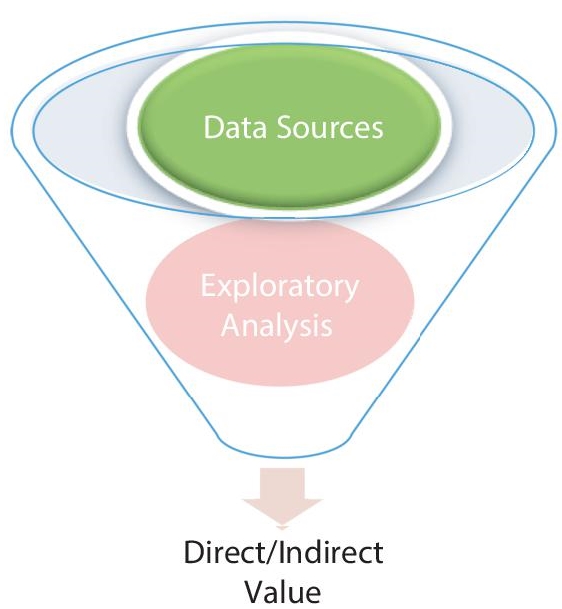
Figure 1.4 Data value funnel.
When it comes to extracting production value from your data, there are two key considerations. For starters, data might provide you and your firm with useless information. These insights may not be actionable, or their potential impact may be too little to warrant a change in current practices. Empowering the people who know your business priorities to analyze your data is a smart strategy for mitigating this risk. Second, you should maximize the efficiency of your exploratory analytics activities. Now we are back to data manipulation. The more data you can wrangle in a shorter amount of time, the more data explorations you can do and the more analyses you can put into production.
1.6 Steps of Data Wrangling
We have six steps, as shown in Figure 1.5, for data wrangling to convert raw data to usable data.
- Discovering data—Data that is to be used is to be understood carefully and is collected from different sources in different range of formats and sizes to find patterns and trends. Data collected from different sources and in different format are well acknowledged [7].

Figure 1.5 Steps for data wrangling process.
- Structuring data—Data is in unstructured format or disorganized while collecting data from different sources, so data is organized and structured according to Analytical Model of the business or according to requirement. Relevant information is extracted from data and is organized in structured format. For Example certain columns should be added and certain columns in the data should be removed according to our requirement.
- Cleaning data—Cleaning data means to clean data so that it is optimum for analysis [8]. As certain outliers are always present in data which reduces analysis consequences. This step includes removing outliers from dataset changes null or empty data with standardized values, removes structural errors [5].
- Enriching data—The data must be enriched after it has been cleaned, which is done in the enrichment process. The goal is to enrich existing data by adding more data from either internal or external data sources, or by generating new columns from existing data using calculation methods, such as folding probability measurements or transforming a time stamp into a day of the week to improve accuracy of analysis [8].
- Validating data—In validation step we check quality, accuracy, consistency, security and authenticity of data. The validation process will either uncover any data quality issues or certify that an appropriate transformation has been performed. Validations should be carried out on a number of different dimensions or rules. In any case, it is a good idea to double-check that attribute or field values are proper and meet the syntactic and distribution criteria. For example, instead of 1/0 or [True, False], a Boolean field should be coded as true or false.
- Publishing data—This is the final publication stage, which addresses how the updated data are delivered to subject analysts and for which applications, so that they can be utilized for other purposes afterward. Analysis of data is done in this step i.e. data is placed where it is accessed and used. Data are placed in a new architecture or database. Final output received is of high quality and more accurate which brings new insights to business. The process of preparing and transferring data wrangling output for use in downstream or future projects, such as loading into specific analysis software or documenting and preserving the transformation logic, is referred to as publishing. When the input data is properly formatted, several analytic tools operate substantially faster. Good data wrangler software understands this and formats the processed data in such a way that the target system can make the most of it. It makes sense to reproduce a project’s data wrangling stages and methods for usage on other databases in many circumstances.
1.7 Do’s for Data Wrangling
Things to be kept in mind in data wrangling are as follows:
- Nature of Audience—Nature of audience is to kept in mind before starting data wrangling process.
- Right data—Right data should be picked so that analysis process is more accurate and of high quality.
- Understanding of data is a must to wrangle data.
- Reevaluation of work should be done to find flaws in the process.
1.8 Tools for Data Wrangling
Different tools used for data wrangling process that you will study in this book in detail are as follows [9]:
- MS Excel
- Python and R
- KNIME
- OpenRefine
- Excel Spreadsheets
- Tabula
- PythonPandas
- CSVKit
- Plotly
- Purrr
- Dplyr
- JSOnline
- Splitstackshape
The foundation of data wrangling is data gathering. The data is extracted, parsed and scraped before the process of removing unnecessary information from raw data. Data filtering or scrubbing includes removing corrupt and invalid data, thus keeping only the needful data. The data are transformed from unstructured to a bit structured form. Then, the data is converted from one format to another format. To name a few, some common formats are CSV, JSON, XML, SQL, etc. The preanalysis of data is to be done in data exploration step. Some preliminary queries are applied on the data to get the sense of the available data. The hypothesis and statistical analysis can be formed after basic exploration. After exploring the data, the process of integrating data begins in which the smaller pieces of data are added up to form big data. After that, validation rules are applied on data to verify its quality, consistency and security. In the end, analysts prepare and publish the wrangled data for further analysis.
References
- 1. Kandel, S., Heer, J., Plaisant, C., Kennedy, J., Van Ham, F., Riche, N.H., Weaver, C., Lee, B., Brodbeck, D., Buono, P., Research directions in data wrangling: Visualizations and transformations for usable and credible data. Inf. Vis., 10, 4, 271–288, 2011.
- 2. Furche, T., Gottlob, G., Libkin, L., Orsi, G., Paton, N.W., Data wrangling for big data: Challenges and opportunities, in: EDBT, vol. 16, pp. 473–478, March 2016.
- 3. Patil, M.M. and Hiremath, B.N., A systematic study of data wrangling. Int. J. Inf. Technol. Comput. Sci., 1, 32–39, 2018.
- 4. Cline, D., Yueh, S., Chapman, B., Stankov, B., Gasiewski, A., Masters, D., Elder, K., Kelly, R., Painter, T.H., Miller, S., Katzberg, S., NASA cold land processes experiment (CLPX 2002/03): Airborne remote sensing. J. Hydrometeorol., 10, 1, 338–346, 2009.
- 5. Dasu, T. and Johnson, T., Exploratory Data Mining and Data Cleaning, vol. 479, John Wiley & Sons, Hoboken, New Jersey, United States, 2003.
- 6. Rattenbury, T., Hellerstein, J.M., Heer, J., Kandel, S., Carreras, C., Principles of Data Wrangling: Practical Techniques for Data Preparation, O’Reilly Media, Inc., Sebastopol, California, 2017.
- 7. Kim, W., Choi, B.J., Hong, E.K., Kim, S.K., Lee, D., A taxonomy of dirty data. Data Min. Knowl. Discovery, 7, 1, 81–99, 2003.
- 8. Azeroual, O., Data wrangling in database systems: Purging of dirty data. Data, 5, 2, 50, 2020.
- 9. Kazil, J. and Jarmul, K., Data Wrangling with Python: Tips and Tools to Make Your Life Easier, O’Reilly Media, Inc., Sebastopol, California, 2016.
- 10. Endel, F. and Piringer, H., Data wrangling: Making data useful again. IFAC-PapersOnLine, 48, 1, 111–112, 2015.
Note
- *Corresponding author: [email protected]