
Watching your stocks all day long is amusing up to a point, but income is the thing if you're shopping for anything from pajamas to pastrami sandwiches.
FOR GENERATIONS, STOCKS have gotten top billing over bonds. Stocks, many insist, have outperformed bonds in the past, will outperform bonds in the future, and are not risky if held for ten years or more. We believe these assertions are myths. This chapter makes the case that the stated historical return of 10 percent on stocks is merely theoretical because it does not take into account taxes, expenses, and investors' bad timing. It is uncertain that stocks will outperform bonds in the future, and the risk of a severe stock market decline increases as the investment period increases. Stocks are riskier and less predictable than bonds. Ultimately, they are not as good an investment as bonds.
In the holy name of diversification, investors are told to balance the bulk of their investment portfolio between stocks and bonds. We think that's a mistake. For individual investors, we believe that bonds are a better investment than stocks. Indeed, the ideal portfolio for individual investors would contain only plain-vanilla bonds. That's because after paying fees, expenses, taxes, and factorizing in the risk of bad timing, the return on stocks is not likely to exceed the return on bonds, particularly when the risks associated with stocks are taken into account. The bonds that we recommend are safe. If you can achieve your financial goals without taking a risk, why not do so?
We developed the 100 percent bond portfolio as a strategy that individuals can use to meet their financial goals, taking into account their capabilities and limitations. Individual investors can't use the advanced techniques or participate in big institutional deals, but they can and do invest in stocks and stock funds, and that puts them at risk. The 100 percent bond portfolio doesn't include investments in stock, stock funds, commodities, or real estate. It's a strategy that individuals can use to keep their assets safe and growing.
This chapter examines the historical returns on stocks and bonds—without equity-colored glasses—in a noninstitutional portfolio. The results will show you why we believe that the 100 percent bond portfolio is the best strategy for individual investors.
News stories abound on the outsized gains that certain large institutions, such as the Harvard Endowment, earn on their investment portfolios containing stocks and other investments. Naturally, you would want to emulate the Harvard Endowment and earn those large returns as well. In building a portfolio, an individual investor can't use an institutional model that might be used by the Harvard Endowment. That's because there are many significant differences between individual and institutional investors. Let's take Harvard as an example and consider what some of those differences are.
The Harvard Endowment was worth $29 billion in 2006. That enormous wealth enables the Harvard Endowment to hire the most experienced and competent money managers in the world. These managers can evaluate and get access to the best and most complex investment opportunities available. Individual investors simply don't have enough assets to buy into such deals.
Because of the huge size of the Harvard Endowment, which grows larger each year, it can take significant risks. In addition, the Harvard Endowment has a limitless time horizon for its investments because it will be sustained indefinitely and can adjust the amount of money that is withdrawn each year.
Individual investors have a different time line and pockets that are not nearly as deep. They generally stop accumulating money when they stop working, at which point, they start to take distributions, which ultimately reduce the size of their nest egg. If their investment portfolio does not make a consistent return, they may run out of money. A bull market in one year may not undo the damage the bear market did the year before. What's more, individuals are subject to the inevitable emergencies, illnesses, and bumps in the road that require cash.
Although it is not the usual practice for U.S. pension managers, some now recognize that it is better to match their assets to their liabilities than to rely on hope to fund future liabilities. Instead of betting that stocks will achieve their historical average, the State of Maine Pension Fund,[5] the United Mine Workers of America 1950 Pension Plan, and the Texas Municipal Retirement System,[6] among others, match their assets (bonds) to their liabilities (the liabilities for pensions payable at worker's retirement dates). These pension funds do not want to be left to the mercy of good and bad years in the stock market and the uncertainty that there will be enough resources to pay all their retirees on time.
The Teacher's Retirement System of Texas in contrast, took a different path. The fund invested in stocks and lost its bet in the bear market of 2000 to 2002. Fund assets dropped to $79 billion in 2003 from a high of $90 billion in 2000. To make up the $16 billion budget gap, it decided to put its money into hedge funds and other higher yielding asset classes.[7] Unfortunately, it landed on the losing side of a hedge fund disaster. Amaranth Advisers revealed that in September 2006 it had lost roughly $6 billion, or 65 percent of its assets, on misplaced bets in the natural gas market. When a $10 billion hedge fund drops by 65 percent in one month, its investors, which in this case included major pension funds across the United States, are shaken. What new risky investments will have to be made to make up for this and other shortfalls?
Many companies are shutting down their pension plans in favor of shifting the responsibility for pensions to their employees. Now employees are being asked to do what the pension fund managers, with all their education and expertise, are often unable to do. Although pension funds can receive a cash infusion from their sponsoring company or be terminated for all employees, what can individuals do in the face of underperforming retirement returns? How would you make up the shortfall if your investments did not achieve the expected return?
With all investments, except safe individual bonds, your chips are on the table until you sell. Either you make two right decisions, when to buy and when to sell, or you are just wrong and you lose. Until you close your position by selling, your money is at risk. Although stocks, real estate, and commodities might have performed well in the past during certain periods, there is no way to know whether they will have significant losses or gains in the future. Holding individual bonds, however, helps you to avoid this problem. With individual bonds, you do not need to make two right decisions—when to buy and when to sell. Bonds require only one decision: the decision to buy and hold until they come due. Your principal plus interest is returned to you without another decision.
To compare historical and potential returns from stocks and bonds, some important questions have to be addressed:
Is it accurate to say that stocks had a historical return of 10 percent?
If stocks outperformed bonds in the past, why can't we assume that stocks will outperform bonds in the future?
Does the historical return on bonds compare favorably with the historical return on stocks?
How can a portfolio of bonds provide both income and growth?
Are bonds a better investment than stocks?
The answers to these questions cast doubt on the old assumptions on investing, which the media and most financial advisers accept as gospel. We've developed some new thinking that reflects decades of observing the financial markets. Let's evaluate stocks and bonds in light of the new thinking we propose and see if you're persuaded that bonds are a better investment than stocks. If you are and you're willing to change your approach to investing, the 100 percent bond portfolio can maximize your investment returns with the ultimate degree of safety.
The historical annual return of stocks is around 10 percent.[8]
NEW THINKING
The actual annual historical return on stocks is much less than 10 percent when taxes, transaction costs, and bad timing of the stock market are taken into account.
Ibbotson Associates, in its annually updated book Stocks, Bonds, Bills, and Inflation, 2006 Yearbook, provides one of the staples for obtaining historical data to compare the returns of stocks and bonds. However, the Ibbotson data do not prove that individual shareholders had an approximate annual 10 percent historical return. The Ibbotson data are merely theoretical because they do not take into account the actual frictions of real-life investing. You cannot measure the actual performance of a stock portfolio or stock fund for individual investors without taking into account the burden of income taxes, transaction costs, investment-management fees, and the possibility of an individual investor's poor timing when he buys and sells stock based on emotion. Because of these real life costs, it is impossible for individual investors to have realized the stock market returns reported by Ibbotson.
To find the actual historical performance of stocks, we must reduce the theoretical Ibbotson stock returns by three elements: taxes, transaction costs, and bad timing.
Taxes. Individuals are subject to federal and often state and local taxes on income as well as on dividends and capital gains. If stock is held in a stock fund and the fund trades its stock a great deal, some or all of the reportable gains may be treated as short-term capital gains, which may be taxed at ordinary income rates. The outcome is the same if an individual holds his stock for one year or less before its sale.
Transaction Costs. Individuals must pay transaction costs to buy and sell stocks including commissions on individual stocks, managed account fees, and management fees and other expenses on stock funds. "It's fair to estimate that the all-in annual costs of equity fund ownership now run in the range of 2.5 percent to 3 percent of assets," says John Bogle, founder of the Vanguard Group of mutual funds.[9]
William Bernstein examined fund management fees and reported the following in the April 2001 issue of Financial Planning :[10]
The average actively managed large-cap fund has annual fees and expenses of about 2 percent.
The average small-cap and foreign fund has annual fees and expenses of about 4 percent.
The average microcap and emerging market fund has annual fees and expenses of almost 10 percent.
Bad Timing. The most costly element of all is the buying and selling habits of individual investors. Investors are generally emotional in their investment choices and often have an atrocious sense of timing. They tend to buy into the stock market when it is hot after it has gone up a lot. They often lose their nerve and sell after a severe decline. Making money in stocks requires making two correct decisions: when to buy and when to sell. "From 1983 to 2003 index funds tracking the Standard & Poor's 500 index returned 12.8 percent and the average mutual fund gained 10 percent annually," says Michael J. Mauboussin, a strategist at Legg Mason Capital Management. "Meanwhile, the average investor earned only 6.3 percent annual returns." Mauboussin attributes this seemingly impossible result to poor "market timing" and "the extraordinary proclivity for investors to invest in the wrong place at the wrong time."[11]
The buy-high, sell-low behavior pattern of individual investors observed by Mauboussin has been verified by research undertaken by Dalbar, Inc., in Boston, which tracked investor behavior for twenty years, beginning in 1986. Through all kinds of markets, "investors achieved an average annualized return of just under 4 percent, compared with a return of nearly 12 percent from a buy-and-hold strategy using the Standard & Poor's 500 index."[12]
Why is the actual performance of the dollar-weighted returns so much lower than the traditional reporting methods? "It says something about human nature," says Ilia Dichev, an accounting professor at the University of Michigan. "When things are going up, people get excited. That's when the money pours in."[13]
A buy-and-hold strategy may not solve the market-timing problem. Buying and holding works well for stocks in a bull market like the one from 1982 to 1999. But a buy-and-hold strategy results in serious losses and creates a great deal of wear and tear on individual investors in a bear market, such as the one from 2000 to 2002. The Nasdaq lost 77.9 percent of its value during the collapse of this market bubble. The success of a buy-and-hold strategy depends on the period in which the stock is held.
Consider, for example, the story of Boots, a drugstore chain in the United Kingdom. After making spectacular gains in the 1990s bull market in stocks, it fired its portfolio manager in 2001. Instead of watching its assets decline, the Boots pension plan sold all its stock and purchased high-grade bonds. This action enabled the chain's management to guarantee that there would be enough assets to satisfy its pension liabilities. The Boots pension fund ended up with a surplus, while many other pension funds had big losses as a result of the bear market in stocks.
Because individual investors have limited life spans, the holding period is of more than theoretical interest. For example, in the years 1965 to 1982, the Dow started out at about 1,000 and ended the period at pretty much the same place. If that happened to be the period during which you were saving for retirement, you would have been out of luck. It would be no help to you that the historical return was 10 percent.
By taking a savvy approach to bond buying, you can minimize your taxes, limit your expenses, reduce your risk, and increase your profit. But let's first examine the taxes, costs, and risks of investing in bonds.
Taxes. If you are in the 25 percent tax bracket or higher, the impact of federal and state income taxes is generally large enough to indicate that you should purchase tax-free municipal bonds for your taxable nonpension account. By purchasing municipals, you avoid paying federal income tax and possibly state and local income taxes as well on the interest income. Though the interest rate on municipals is lower than the taxable rates, after taxes you will come out ahead. Tax-free municipal bonds provide the best legal tax shelter available to individual investors.
Many taxpayers are now subject to the alternative minimum tax (AMT), which is pushing more taxpayers into paying higher federal income taxes. Municipal bond interest is not subject to the AMT, except for the interest income from the municipal bonds called AMT bonds. If you are in a lower federal income tax bracket in a high-tax state, consider purchasing Treasuries, home-state taxable munis, and certain agency bonds that are exempt from state and local income taxes, but not from federal income tax.
Transaction costs. The cost to purchase a bond is called the "spread," which is the difference between the price that the broker paid for the bond and the higher price at which he sells it to you. In addition to a spread, discount brokers may charge you a fee for service. Discount brokers don't save you money in the world of bonds. However, if you buy a bond on its initial public offering, you will receive an institutional price—the best possible price. If you hold an individual bond until it comes due, there are no further transaction costs.
Risk. With highly rated bonds, you have no significant loss of principal to worry about as long as you hold the bonds until they come due at their face value. We believe that in a comparison of stocks and bonds, highly rated bonds should be given a significant premium over stocks because these bonds are safe, dependable, and pay a steady rate of interest that can be counted on.
Bad timing. The risk of bad timing is small if you hold your bonds until they come due because every bond comes due at its face value, no matter what the price fluctuations might be before its due date. Keep records of your bond purchases so that they are recorded at face value, rather than adjusting their value every month as valued on your brokerage statement. If you keep your bonds recorded at face value, you will be less likely to sell your bonds before they come due and make a market timing mistake.
If you have a bond ladder (that is, you own bonds coming due each year or so), you may be able to meet your extraordinary financial needs out of your current cash flow and have funds to reinvest in the event of rising interest rates. How much is that worth to you in a comparison with volatile stocks and safe bonds? We'll discuss the strategy of a bond ladder in chapter 19.
stocks will outperform bonds in the future.
NEW THINKING
it is uncertain that stocks will outperform bonds in the future.
There are two main reasons for the assumption that stocks will outperform bonds in the future: First, it's taken for granted that stocks have always outperformed bonds in the past. Therefore, the assumption is that they will continue to outperform bonds in the future. In fact, stocks have not always outperformed bonds. The leader depends on which span of years you choose to look at. More important, as we'll discuss later in this chapter, the actual annual historical performance of stocks by our calculations is more like 6 percent to 7 percent rather than 10 percent.
Second, because stocks are riskier and more volatile than bonds, stocks should have a higher return than bonds to attract investors away from safe government bonds. We readily agree that stocks are riskier. However, that doesn't prove that stocks will outperform bonds in the future.
We are not suggesting that bonds will outperform stocks in the future. No one knows what will happen in the future. An open mind is essential on this important subject. But if you believe that stocks will always outperform bonds, why would you invest in bonds at all? If you're open to other eventualities, you'll understand the advantages of bonds and why we believe that bonds and the 100 percent bond portfolio are a better investment strategy for individual investors.
The present is significantly different from the past, so why should we expect that the past performance of the stock market or the bond market will be repeated in the present or the future? In the past, we had a depression, two world wars and other wars, a massive inflation followed by a deep recession, oil shortages and oil busts, high tax rates and low tax rates, and high unemployment and low unemployment. Which of these events will recur and with what consequences?
Dividends and stock appreciation. Influenced by the media, investors often assume that the major factor in stock appreciation is the increase in the value of the stock shares. Awesome bubbles and minibubbles form as stock prices in a particular sector rise. However, the classic explanation of stock appreciation is that it is principally driven by two factors:
High dividend yields
The growth of the dividends over time
Between 1926 and 1959, the dividend yield paid on large company stocks was higher than the interest paid on long-term Treasury bonds. This is because stocks were rightly considered risky at that time. From 1926 to 1954, the dividend yield on large company stocks was always above 5 percent, and in 1950, it hit its peak at 8.77 percent.[14] From as late as 1975 to 1985, the dividend yield on large company stocks was generally around 5 percent.[15] The dividend yield on large company stocks in 2006, however, was about 1.8 percent, and at least the majority of midsize and small-company stocks paid no dividends at all.
The reinvestment of dividends has been the major driver of large stock appreciation. When stock performance includes the reinvestment of all dividends paid on stocks, $1 invested in 1824 grew to $3.2 million in 2005 (see Figure 1.1). However, if dividends are left out of the calculation and not reinvested, $1 invested in 1824 grew to only $374 in 2005.[16] That's right, $374, not $374,000, or $3.2 million. Since high dividends were the main driver of stock appreciation in the past, why would we expect high appreciation in the future when dividends are much lower?
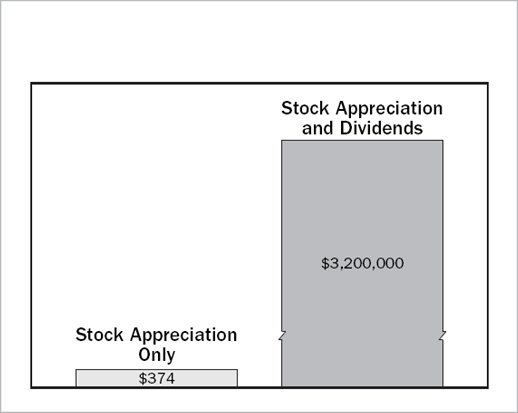
Source: Data from Roger G. Ibbotson, Stocks, Bonds, Bills and Inflation: Historical Returns (1926–1987) (Chicago: Irwin Professional Publishing, (1989), 201.
Consider the following questions:
Without substantial dividends, will stocks appreciate by the historical 10 percent per year?
Are you willing to bet your retirement on the hope that past performance will be repeated without significant dividends?
Is it significant that a great deal of stock appreciation came from the period 1982 to 1999, when the yield on long-term Treasuries declined from a record rate of 13.34 percent on December 31, 1981, to 6.82 percent on December 31, 1999?[17]
Every financial product provides a disclaimer that past performance may not be repeated. Why don't investors believe this? It seems to be a matter of faith for investors that stocks must outperform bonds. We think it's unwise for investors to bet their financial life on this hope. That's because the answer to the question of whether stocks will always outperform bonds is simply not knowable. Our purpose is to call into question the paradigm that stocks will always outperform bonds and to open investors' minds to another way of measuring performance. If investors saw the validity of such measurement, would their asset allocation to bonds increase because of the greater safety, predictability, and cash flow they provide?
stocks are not risky if you hold them for ten years.
NEW THINKING
The risk of a severe stock market decline increases as the investment period increases. stocks are riskier and less predictable than bonds.
Investors love to believe in the possibility of easy gains. Gains, however, must be measured against the risks taken. This concept is known as "risk adjusting" the return on an investment. For example, if you buy a high-tech start-up company, you might make a gain of 20 percent or more over a short time. However, this upside possibility must be balanced against a total loss of your investment since high-tech start-up companies have a high failure rate. In this case the risk-adjusted return would be much less than 20 percent even if the stock appreciated by that much.
Stocks are risky. Over certain periods of time, stock markets declined and even crashed. The crash of 1929, for example, is infamous. Less well known is that on October 19, 1987, the Dow Jones Industrial Average declined 508 points in one day, a 22.6 percent loss.[18] More recent was the bear market of 2000 to 2002, when the Nasdaq lost 77.9 percent of its value. Consider also the huge decline in Japanese stocks from 1989 to 2003, when stocks declined by about 78 percent.[19]
Investors who take on a lot of risk can never be confident that they have succeeded until they sell their investments. In the financial markets, when a trader makes big money for many years and then dramatically loses it all and a lot more, he is considered to have "blown up." Yogi Berra, the famous baseball player and common man's philosopher, summed this up in the expression, "It ain't over till it's over."
The longer investors go without encountering a rare event, the more vulnerable they will be to it. This is how bubbles form in stocks, real estate, and commodities. Investors get comfortable and are very happy with the appreciation of their assets and invest more at or near the top. It looks like a sure thing. Despite the message endlessly repeated by the media that stocks are safe in the long run, stocks have been risky in the past and they will likely be risky in the future.
Risk has two dimensions, explains Zvi Bodie, professor of finance at Boston University School of Management and world-renowned investment consultant. "There's the probability of a bad thing happening. But the other dimension is the severity of the bad thing happening." The risk of a stock market crash happening increases as the investment period increases, says Bodie. To prove his point, he reminds us that the longer the life of a put option, the greater its cost. A put option gives an investor the right, but not the obligation, to sell securities at a fixed price within a specified period of time. If a put option for one year costs about $8,000, the same option for twenty-five years would cost about $40,000. Bodie concludes that if stocks are really less risky the longer you hold them, then the cost of the put option should go down and not up when the option period increases.[20]
In his book Worry-Free Investing,[21] Bodie tells readers that conventional wisdom is wrong. Stocks don't always produce the highest return, diversification doesn't always protect you against loss, and the risk of owning stocks does not always decline the longer you hold them. Stocks are risky and will remain risky, no matter how long you own them.[22]
When a market goes up dramatically, the media quotes the financial services industry, which periodically insists, "This time it's different." The analysts will then backfit the current data to a new theory. This partly explains why investors wind up buying when asset prices are rising, often buying at or near the top. When the market declines, they can't stand the pain and often sell at the bleakest bottom. This predictable behavior is why there are so few investors who actually reap the reported gains from a long-term rising market in stocks, commodities, or real estate.
A review of the actual year-by-year historical returns of stocks shows that they are unpredictable. They are random. Random movements of stock in the past make for highly unreliable predictors of future stock prices. If stock prices are random, it follows that stocks retain substantial risk no matter how long you hold them; and you should not build a financial plan around them.
Bonds are for income and stocks are for growth.
NEW THINKING
Advisers tell investors that stocks should form the major part of their investment portfolio because stocks always provide so much more growth than bonds provide income. Stock appreciation, however, is not predictable, whereas bond income is. When you invest in stocks, you should do so counting on your dividends and hope for stock appreciation only as icing on the cake. But the dividend cake has been below 2 percent since 1998, while bond interest remains more attractive.
Zero-coupon bonds. Investors who hold the old assumption that bonds provide only income have never heard of zero-coupon bonds. A zero-coupon bond pays no interest currently and sells for a price that is significantly below its face value. For example, in 2006, we purchased a U.S. Agency zero-coupon bond that comes due in twelve years. The bond is also noncallable, which means that the agency can't buy the bond back from the investor before its due date. The unit price for the bond was 50, and it will come due at a price of 100 in twelve years. Therefore, in twelve years these bonds will double in value. There is no question that the bonds will double if held to maturity because a U.S. Agency bond is essentially risk free. Is this doubling in value income or growth? Would you be interested in a guaranteed 100 percent return in twelve years without the possibility of a loss? Zero-coupon bonds show the power of compounding, Einstein's eighth wonder of the world. We'll discuss zero-coupon bonds in detail in chapter 6.
Instead of investing in a zero-coupon bond, you might purchase a coupon bond paying current interest and reinvest the interest in additional bonds rather than spending the interest income. In this strategy, you would have the cash flow as well as the growth. Should the gain be considered income or growth?
The media makes finding undervalued assets seem easy. Volatile markets, whether in stocks, commodities, or real estate, always attract a lot of media attention. Investors want to get rich quick, and the media are happy to tell them how.
There is another, more subtle reason why the markets seem to be going up more than they actually are. Consider two examples in which the movement of the markets is described in percentages (see Figure 1.2).
What is happening here? The investment is going up and down by 50 percent, but in both cases you lost 25 percent. If you translate the percentages into cash, you started with $100 and ended up with $75 in both cases. It is not much consolation to know that you are up 50 percent in the second case if you still have an overall loss.

Let's take a real-life example. The Nasdaq hit a high of 5,048 on March 10, 2000, before it declined to 1,114 on October 9, 2002, in the bear market. To get back to its all-time high of about 5,048, from 1,114, the Nasdaq would have to appreciate by almost 400 percent. The media, however, were happy to report that the Nasdaq doubled when it went from 1,114 to over 2,000. That sounds great, except that at around the 2,000 level it is still down almost 60 percent from its high of 5,048. If you had invested $100 at the high point, you would have only $40 after the double. If you had invested in bonds, you would still have your $100 and the accumulated interest paid on that investment. We can learn from these examples that recovering from a stock loss is quite difficult, and some investors will ride their winners down and not recover.
The evaluation of risk and return can be quite elusive. Stock, commodity, and real estate funds can appear to go up more than they actually are because of what's called survivorship bias. For example, many losing funds are no longer visible because they were terminated or merged into other, better-performing funds so that the losing funds don't show up in the databases anymore. Funds may also appear to be doing better than they actually are because there are more than 6,000 mutual funds. At any point in time, some of them will be doing very well. The best performing of these winning funds are the ones advertised heavily to the public.
We value a large and safe cash flow more than the possibility of inflated assets. In the high-tech bull market of the 1990s, some stocks increased dramatically in value only to crash some years later. The increase and decrease in asset values of these stocks looked random to us, and the gains looked to be brought about by luck. We don't depend on the rising asset values produced by a bull market for our success with bonds; we have no fear of a bear market collapse. In fact, bonds generally increase in value when there is a bear market in stocks, commodities, or real estate because of the so-called flight to quality that generally follows a market collapse.
Let's assume for the moment that stocks do outperform bonds over every ten-year period. Let's further assume that when you retire you are depending on withdrawals from your nest egg of stocks to fund your retirement, and you have significant losses in your early retirement years. In this case, you may run out of money even if there are good returns in future years and they average 10 percent per year. Consider what would have happened if you retired in one of the following years:[23]
1973: market loss of 14.6 percent
1974: market loss of 26.5 percent
2000: market loss of 9.1 percent
2001: market loss of 11.9 percent
2002: market loss of 22.1 percent
If you had the misfortune to retire in one of those years, you might have a problem meeting your retirement goals. Let's take a simplified example of what might happen if you had losses in the year or years immediately after your retirement. Bob Goodtiming had $1 million in stocks at the date of his retirement. Bob believed that he would receive the historical return of 10 percent per year on stocks and could withdraw 10 percent, or $100,000 per year, from his $1 million nest egg. In the first year of his retirement, Bob's stocks declined 10 percent, and he withdrew $100,000 to live on. In the next year, stocks also declined 10 percent, and Bob took out another $100,000 with the understanding that there was bound to be a recovery in the third year. However, at the beginning of Bob's third year of retirement, his nest egg was worth only $620,000, and that Wal-Mart job was looking very attractive because he concluded that his retirement fund was now inadequate.
We've seen that Ibbotson data indicate that the historical return is 10 percent on stocks and 5 percent on bonds. But after paying fees, expenses, and taxes, the return on stocks in the real world is more likely to be 6 percent to 7 percent rather than the widely believed figure of 10 percent or 11 percent.[24] Furthermore, when you adjust for the possibility of significant losses on stocks, the risk of bad timing, and the stomach-churning volatility, we conclude that bonds are a better investment vehicle to save for your education expenses, retirement, and other financial goals.
Think about this: if you knew that after taxes and transaction costs you could get only a 6 percent to 7 percent return on stocks, how much of your money would you move from stocks to highly rated bonds? And if the return on stocks before taxes and transaction costs is actually likely to be less than 10 percent, as predicted by many commentators, the return on stocks might be even lower than the return on bonds. How much is it worth to you to know that your nest egg is not at risk and will be there if and when you need it?
What risks are you prepared to take in the stock market? How much are you willing to lose? Can you afford to sit out a bad stock market? If you have invested in stock, have you gotten the published return or the return you expected? What stories do you tell your friends about your successes in the financial markets? After a loss, what are your "yeah, but" rationalizations that you don't share with friends? Are you playing in someone else's game? How much time do you have to allocate to investment management?
Chapter Notes
[4] Joe Mysak, "How to Make $500,000 a Year and Pay No Taxes," Bloomberg.com, August 31, 2001.
[5] Mary Williams Walsh, "Maine Takes a Cautious Path on Its Pensions," New York Times, April 23, 2004, C1.
[6] Mary Williams Walsh, "The Nation: Undone by Market Risk: A Premature Sunset for Pensions," New York Times, sec. 4, November 28, 2004, 5.
[7] Elizabeth Albanese, "Alternative Assets," Bond Buyer Online, October 27, 2003.
[8] Ibbotson Associates, Stocks, Bonds, Bills, and Inflation, 2006 Yearbook, 61. The precise return with dividends reinvested between 1925 and 2005 was 10.4 percent.
[9] John Bogle, "What Went Wrong in Mutual Fund America?" Journal of Indexes (July/August 2006): 30.
[10] William Bernstein, "Sucker's Bet," Financial Planning (April 2001): 183–184.
[11] Michael J. Mauboussin, as reported in the Legg Mason Capital Management publication, Mauboussin on Strategy, May 18, 2006, 9.
[12] Charles A. Jaffee, "New Way to Gauge Fund Performance," Philadelphia Inquirer, October 15, 2006, E7.
[13] Johnathan Clements, "Curb Your Enthusiasim: Why Investors Often Lag behind the Market Indexes," Wall Street Journal, October 18, 2006, D1.
[14] Ibbotson, 228.
[15] Ibid., 229.
[16] Ibid., 201
[17] Ibid., 39.
[18] Zvi Bodie and Michael J. Clowes, Worry-Free Investing (New York: FT Prentice Hall, 2003), 83.
[19] Ibid., 103.
[20] Raymond Fazzi, "Stocks Not For the Long Run?" Financial Adviser, January 2004, 51.
[21] Bodie and Clowes, 83–103.
[22] Fazzi, 57.
[23] Ibbotson, 39, for each of these dates reflecting the S&P 500.
[24] Bernstein, 184.