
Xcode is the Integrated Development Environment (IDE) that Apple uses for developing Mac OS X and iPhone applications. It is a suite of applications that includes a set of compilers, documentation, and Interface Builder (discussed in Appendix C).
Using Xcode, you can build your iPhone applications from the comfort of an intelligent text editor, coupled with many different tools to help debug your iPhone applications. If you are new to Xcode, this appendix can serve as a useful guide to get you started quickly. Appendix C covers the Interface Builder in more detail.
The easiest way to launch Xcode is to type Xcode in the textbox of Spotlight. Alternatively, you can launch Xcode by navigating to the DeveloperiPhone OS <version_no>Applications folder and double-clicking the Xcode icon.
Note
For convenience, you can also drag the Xcode icon to the Dock so that in future you can launch it directly from the Dock.
At the time of writing, the version of Xcode available is version 3.1.
Xcode supports the building of iPhone and Mac OS X applications. When you create a new project in Xcode (which you do by choosing File
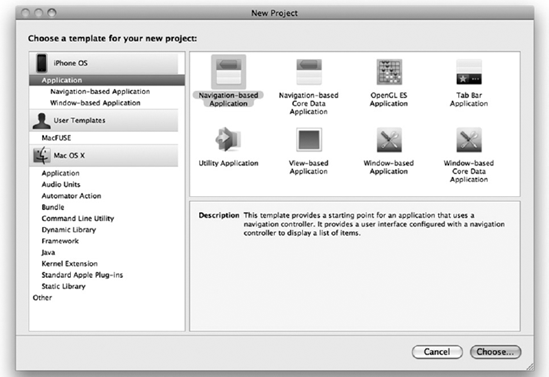
As you can see, you have two main project types to create (iPhone OS and Mac OS X). Under the iPhone OS category, you have the Application item, which is further divided into two categories: Navigation-based Application and Window-based Application. Clicking the Application item displays all the project types you can create, as follows:
Navigation-based Application
Navigation-based Core Data Application
OpenGL ES Application
Tab Bar Application
Utility Application
View-based Application
Window-based Application
Window-based Core Data Application
Select the project type you want to create and click the Choose button. You are then asked to name the project.
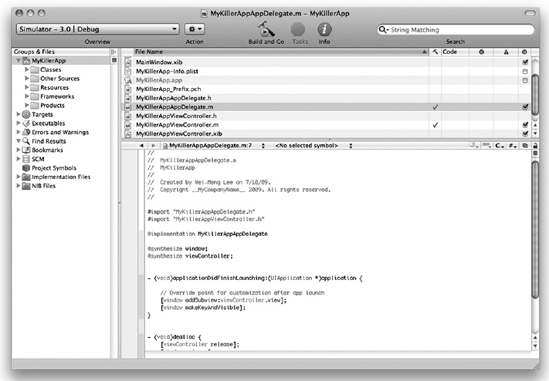
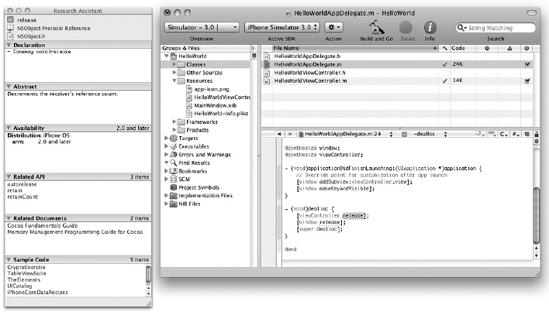
When the project is created, Xcode displays all the files that make up your project (see Figure B-2).

The Xcode window is divided into five sections:
Toolbar: displays the buttons for commonly-performed actions.
Groups and Files List: displays the files in a project. Files are grouped into folders and categories for better management.
Status bar: displays the status information about the current action.
Detail View: displays the files contained in the folders and groups selected in the Groups and Files List section.
Editor: displays the appropriate editor showing the file currently selected.
To edit a code file, click the filename of a file to open the editor. Depending on what you click, the appropriate editor is launched. For example, if you click an .h or .m file, the code editor in which you can edit your source code is displayed (see Figure B-3).
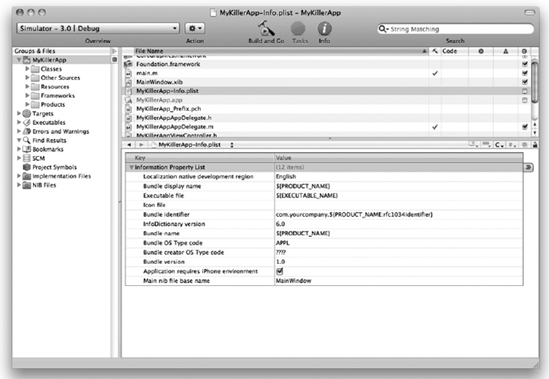
If you click a .plist file, the XML Property List editor is launched (see Figure B-4).
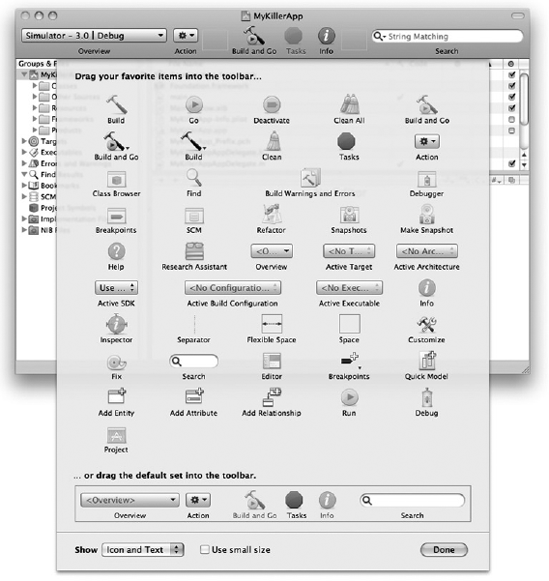
The Xcode window contains the toolbar section, in which you can place your favorite items for quick access. By default, the following items are placed in the toolbar:
Overview: allows you to select target settings such as the active SDK (iPhone OS version and device versus Simulator) as well as active configurations (Debug or Release).
Action: specifies the action you can perform with a selected item.
Build and Go: lets you build and deploy the application.
Tasks: stops any operation in progress.
Info: views the detailed information of a selected item.
Search: filters the items currently displayed in the Detail View section.
You can add items to the toolbar by right-clicking the toolbar and selecting Customize Toolbar. You then see a drop-down pane showing all the items that you can add to the toolbar (see Figure B-5). To add an item to the toolbar, drag the item directly onto the toolbar.
One of the most common features of modern IDE is code completion, which makes the IDE automatically try to complete the statement you are typing based on the current context. In Xcode, this code-completion feature is known as Code Sense. As an example, when you type the letters UIA in a method, such as the viewDidLoad() method, Xcode automatically suggests the UIAlertView class (see Figure B-6; notice that the suggested characters are displayed in gray). If you want to accept the suggested word, simply press the Tab or Enter key.
Besides getting Xcode to complete the word for you, you can also invoke the Code Sense feature by pressing the Esc key (or press F5). Code Sense displays a list of words matching whatever you have typed (see Figure B-7).

As you type in Xcode, Xcode automatically recognizes the code and inserts the relevant parameters" placeholders. For example, if you invoke the methods of an object, Xcode inserts the placeholders of the various parameters. Figure B-8 shows an example of the placeholders inserted for the UIAlertView object after you type ini. To accept the placeholders for the various parameters, press the Tab key.
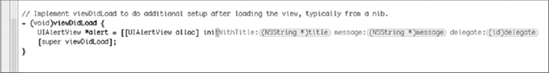
To enter the value for each parameter, press to move to each parameter. Alternatively, click each placeholder and type over it.
To execute an application, you first select the active SDK to use. You also choose whether you want to test it on a real device or use the included iPhone Simulator. You do so by selecting from the Overview list (see Figure B-9).
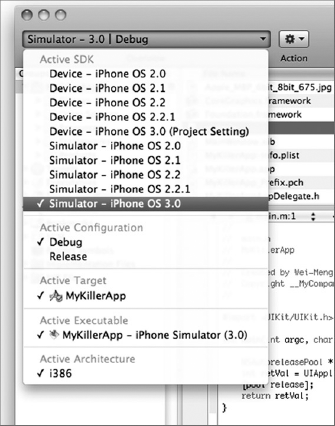
To run the application, press Command-R, and Xcode will build and deploy the application onto the selected device or Simulator.
Debugging your iPhone applications is an essential part of your development journey. Xcode includes debugger utilities that help you trace and examine your code as you execute your application. The following sections show some of the tips and tricks that you can employ when developing your iPhone applications.
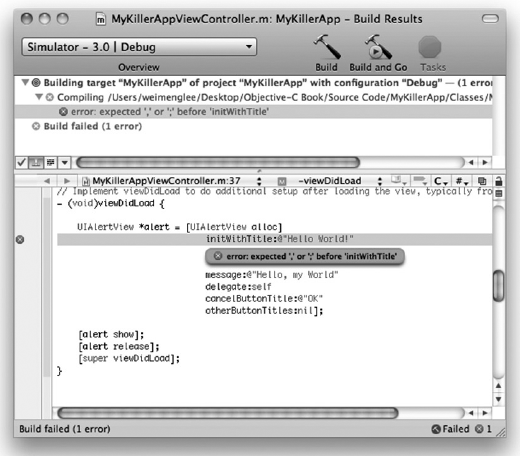
When you try to run your application, Xcode first tries to build the project before it can deploy the application onto the real device or Simulator. Any syntax errors that Xcode detects are immediately highlighted in red. Figure B-10 shows Xcode highlighting a syntax error. The error with the code block is the missing brace symbol ([) for the [[UIAlertView alloc] statement:
UIAlertView *alert = [UIAlertView alloc]
                             initWithTitle:@"Hello World!"
                             message:@"Hello, my World"
                             delegate:self
                             cancelButtonTitle:@"OK"
                             otherButtonTitles:nil];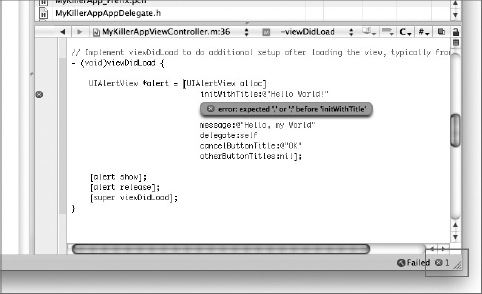
If you have more than one error, you can also click the error icon to view the list of errors (see Figure B-11).
Objective-C is a case-sensitive language, and therefore one of the most common mistakes that beginners make is mixing up the capitalization for some of the method names. Consider the following:
- (void)viewDidLoad {
    UIAlertView *alert = [[UIAlertView alloc]
                             initwithTitle:@"Hello World!"
                             message:@"Hello, my World"
                             delegate:self
cancelButtonTitle:@"OK"
otherButtonTitles:nil];
[alert show];
[alert release];
[super viewDidLoad];
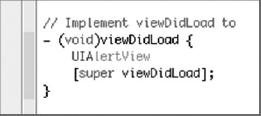
}Can you spot the error? Syntactically, the preceding statements have no problem. However, one of the parameters appears with the wrong capitalization. It turns out that initwithTitle: must be spelled as initWithTitle:. When you compile the program, Xcode will not flag the preceding code as an error; instead, it will issue you with a warning message displayed in yellow (see Figure B-12).

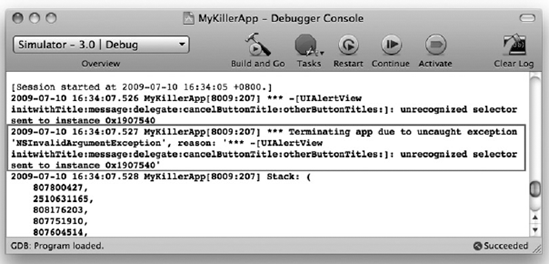
When you see a warning message in Xcode, pay special attention to it and check that the method name is spelled correctly, including the capitalization. Failing to do so may result in a runtime exception. Figure B-13 shows the runtime exception message that Xcode displays when a runtime exception occurs.

When a runtime exception occurs, the best way to troubleshoot the error is to open the Debugger Console window by pressing Shift-Command-R. The Debugger Console window displays all the debugging information that is printed when Xcode debugs your application. This window usually contains the clue that helps you determine exactly what went wrong behind the scenes. Figure B-14 shows the content of the Debugger Console window when the exception occurs. To find out the cause of the crash, scroll to the bottom of the window and look for the section displayed in bold. In this case, note the reason stated. It is quite obvious that the problem is with the UIAlertView object.
Setting breakpoints in your code is a very handy tool to use to debug your application. Breakpoints allow you to execute your code line by line and examine the values of variables so that they perform as expected.
In Xcode, you set a breakpoint by clicking the left column of the code editor (see Figure B-15).
Note
You can toggle the state of a breakpoint by clicking it to disable or disable it. Breakpoints displayed in dark blue are enabled; those displayed in light blue are disabled.
After you have set breakpoints in your application, you need to press Command-Y to debug your application so that your breakpoints will be stopped when they are reached.
Note
Pressing Command-R to run the application will not cause the breakpoints to be stopped.
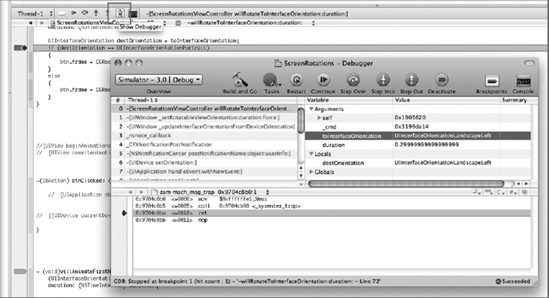
When the application reaches the breakpoint you have set, Xcode displays the current line of execution with a red arrow (see Figure B-16).
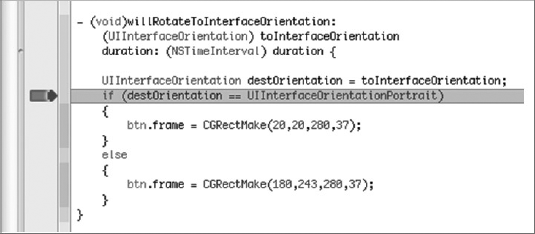
At this juncture, you can do several things:
Step Into (Shift-Command-I) — Step into the statements in a function/method.
Step Over (Shift-Command-O) — Execute all the statements in a function /method and continue to the next statement.
Step Out (Shift-Command-T) — Finish executing all the statements in a function or method and continue to the next statement after the function call.
If you want to resume the execution of your application, press Option-Command-P.
You can also examine the values of variables and objects by clicking the Show Debugger button (see Figure B-17). You can also move your mouse over the objects and variables you are interested in to view their values.
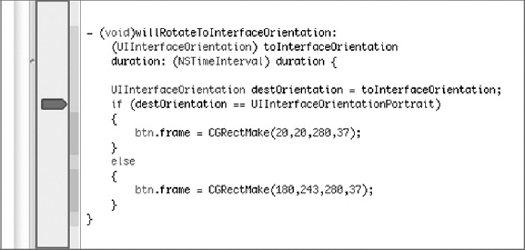
In addition to setting breakpoints to trace the flow of your application, you can use the NSLog() method to print debugging messages to the Debugger Console window. The following NSLog() statement prints a message to the Debugger Console window when the application changes orientation:
- (void)willRotateToInterfaceOrientation:
(UIInterfaceOrientation) toInterfaceOrientation
duration: (NSTimeInterval) duration {
NSLog(@"In the willRotateToInterfaceOrientation: event handler");
UIInterfaceOrientation destOrientation = toInterfaceOrientation;
if (destOrientation == UIInterfaceOrientationPortrait)
{
btn.frame = CGRectMake(20,20,280,37);
}
else
{
btn.frame = CGRectMake(180,243,280,37);
}
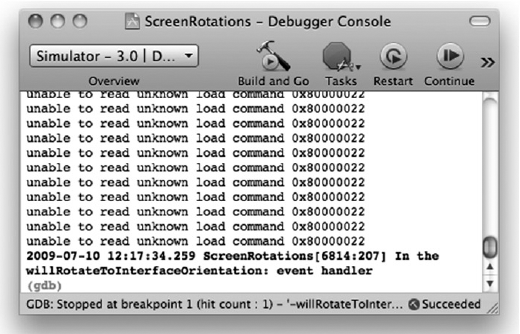
}Figure B-18 shows the output in the Debugger Console window (press Shift-Command-R to display it).
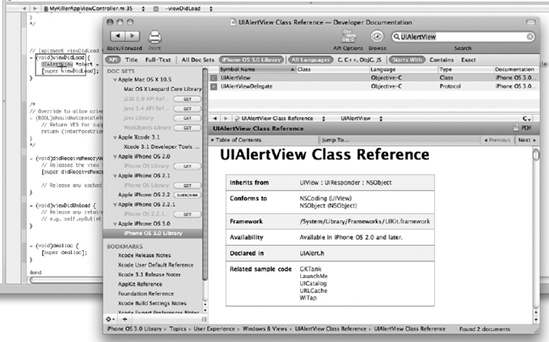
During the course of your development, you often need to check on the various methods, classes, and objects used in the iPhone SDK. The best way to check them out is to refer to the documentation. Xcode allows you to quickly and easily browse the definitions of classes, properties, and methods through the use of the Option key. To view the help documentation of an item, simply press the Option key. The cursor changes to a cross-hair. Double-click the item you want to check out, and the Developer Documentation window appears (see Figure B-19).
In this appendix, you had a quick overview of how to use Xcode to develop your iPhone applications. You saw how to use the Debugger Console window to view outputs generated by Xcode while your application is running, as well as how to set breakpoints in your application so that you can step through your code.