CHAPTER 21
Funds of Hedge Funds
The preceding five chapters have described the universe of hedge funds and its constituent categories of macro and managed futures, event-driven, relative value, and equity strategies. Few investors allocate their entire hedge fund investment to a single hedge fund manager or even a single hedge fund strategy. Investors realize that each manager and each strategy has its own specific risks and cyclicality of returns and that diversification across managers and strategies can reduce the risks of hedge fund investing.
The hedge fund industry includes funds of funds (FoFs) as well as single-manager funds. Funds of funds are hedge funds with an underlying portfolio of other hedge funds. The primary advantages of a fund of funds are diversification, professional manager selection, and portfolio management processes. The primary disadvantage of a fund of funds is a second layer of fees imposed by the fund of funds manager.
Investors may also want to consider multistrategy funds, which manage multiple strategies within a single entity. Multistrategy funds offer strategy diversification without the additional layer of fees, but there are also trade-offs involved when selecting these funds.
21.1 Overview of Funds of Hedge Funds
A fund of hedge funds is a diversified fund run by a single hedge fund manager, in which assets are allocated among other hedge funds. This structure creates two layers of fees: the fees of the fund of funds structure, and the fees of the underlying hedge fund investments. A key goal of investing in a fund of funds is to improve portfolio diversification, as a fund of funds quickly diversifies both the risks of concentrated hedge fund styles and the idiosyncratic risks of investing with single hedge fund managers.
21.1.1 Benefits and Costs of Diversification
The benefits of holding a diversified portfolio of assets result from correlations among asset returns being less than 1, meaning that returns are not perfectly positively correlated. Exhibit 21.1 shows that there have been modest correlations across hedge fund strategies, ranging from 0.344 between macro and relative value to 0.840 between event-driven and equity hedge. Because each hedge fund strategy has its own risks and low-to-moderate correlations to other hedge fund strategies, diversifying across hedge fund strategies reduces the risk of a hedge fund portfolio. As shown in Exhibit 21.1, with a correlation of 0.745 to the MSCI World Index and 0.101 to the JPMorgan Global Aggregate Bond Index, the HFRI Fund Weighted Composite Index also brings diversification and risk reduction to a portfolio of traditional stock and bond investments.
Exhibit 21.1 Correlation of Returns across Investment Strategies, January 1990 to December 2014.
| JPM | HFRI | HFRI | HFRI | HFRI | ||||
| MSCI | Aggregate Global | Fund Weighted | Fund of Funds | HFRIMacro | HFRIEvent−Driven | Relative Value | Equity Hedge | |
| (Jan. 1990−Dec. 2014) | WorldIndex | BondIndex | Composite Index | Composite Index | (Total)Index | (Total)Index | (Total) Index | (Total) Index |
| MSCI World Index | 1.000 | |||||||
| JPM Aggregate Global Bond Index | 0.271 | 1.000 | ||||||
| HFRI Fund Weighted Composite Index | 0.745 | 0.101 | 1.000 | |||||
| HFRI Fund of Funds Composite Index | 0.566 | 0.047 | 0.870 | 1.000 | ||||
| HFRI Macro (Total) Index | 0.358 | 0.198 | 0.646 | 0.670 | 1.000 | |||
| HFRI Event-Driven (Total) Index | 0.691 | 0.059 | 0.904 | 0.760 | 0.507 | 1.000 | ||
| HFRI Relative Value (Total) Index | 0.537 | 0.075 | 0.727 | 0.672 | 0.344 | 0.758 | 1.000 | |
| HFRI Equity Hedge (Total) Hedge | 0.729 | 0.112 | 0.950 | 0.825 | 0.556 | 0.840 | 0.680 | 1.000 |
Source: Bloomberg.
Exhibit 21.2 shows how investors have chosen to allocate their total investment in hedge funds to various strategy types. The largest allocation to single-strategy managers has been to equity hedge, and relative value managers and event-driven funds have earned larger allocations than have macro managers. At the end of 2014, Hedge Fund Research (HFR) estimated that the industry was composed of 8,377 single hedge funds and 1,724 funds of funds. Whereas the number of single-manager hedge funds continues to grow, there has been consolidation in the funds of funds sector, as there were 2,462 funds of funds at the end of 2007.

Exhibit 21.2 Estimated Strategy Composition by Assets under Management, 4Q 2014.
Source: HFR Industry Reports, © HFR, Inc. 2015, www.hedgefundresearch.com.
21.1.2 Four Functions of Fund of Funds Management
Delegated management using a fund of funds (FoF) approach provides investors with professional management to perform the following four important functions:
- STRATEGY AND MANAGER SELECTION: The FoF manager is responsible for selecting the strategies and the managers who will implement those strategies. FoF managers may have access to closed managers as well as insights regarding strategies that are likely to perform better going forward. Many of the largest institutional investors and their investment consultants have teams dedicated to finding, vetting, and investing directly in hedge funds.
- PORTFOLIO CONSTRUCTION: Once the strategies and managers have been selected, the FoF manager has to decide on how much to allocate to each strategy and manager. The allocation will depend on the risk and return characteristics of the individual managers and the expected correlations between funds, as well as other fund features, such as the lockup period, the liquidity of the positions, the size of the fund, and the length of each manager's track record.
- RISK MANAGEMENT AND MONITORING: The FoF manager will monitor each hedge fund to ensure that its ongoing performance profile is consistent with the fund's overall objectives. Some FoFs employ sophisticated risk-management processes to monitor the underlying hedge funds' positions. Other FoFs may employ multifactor sensitivity analysis to gauge the risk exposure to various market factors and to analyze the funds' potential tail risk.
- DUE DILIGENCE: For hedge fund investing, due diligence is the process of monitoring and reviewing the management and operations of a hedge fund manager. This is perhaps one of the more important functions and value-added features of an FoF manager to consider when deciding between a direct and a delegated hedge fund investment program. Unfortunately, some of the large FoFs have been marred by blowups and fraud scandals, which have caused some institutional investors to become wary about the value of an FoF's due diligence process. There is, however, some academic evidence justifying the payment of an additional layer of fees in return for operational due diligence. Operational due diligence is the process of evaluating the policies, procedures, and internal controls of an asset management organization. Brown, Fraser, and Liang1 estimate that net of fees, the largest FoFs tend to outperform the smallest FoFs. Larger FoFs may outperform because their scale allows them to invest greater resources in due diligence and risk management processes.
21.1.3 Eleven Benefits to Investing in Funds of Funds
In addition to accessing professional management for the four functions just discussed, there are a number of other benefits to investing in funds of funds. These potential benefits include the following 11 advantages:
- DIVERSIFICATION: Prudent investing dictates that portfolios be well diversified. Some investors lack the necessary asset size and expertise to invest directly in hedge funds to reach an appropriate level of diversification and risk reduction. By contrast, through a single FoF investment, investors can access a well-diversified portfolio in terms of managers or strategies. However, the diversification level of an FoF portfolio is not necessarily a straightforward function of the number of underlying funds or strategies analogous to stock investing. This is because hedge funds are not single securities; rather, they are previously diversified portfolios of securities.
- ACCESSIBILITY: The median minimum investment for a single hedge fund is $500,000, which makes diversification into numerous funds unaffordable for most individual investors. By comparison, minimum investment levels for FoFs are relatively low. This allows more individual investors and small institutions to gain diversified access to hedge funds even though their capital base is comparatively small.
- ECONOMIES OF SCALE: Investors essentially share costs, such as those associated with the manager selection, reporting, analysis, and due diligence processes, with their FoF co-investors, thereby reducing their individual costs.
- INFORMATION ADVANTAGE: As professional asset allocators, FoF managers have the ability to access, collect, and interpret data gleaned from various channels, such as data providers, prime brokers, and industry contacts. This gives them an informational advantage over nonprofessional investors.
- LIQUIDITY: Investments in hedge funds are relatively illiquid, due to lockups, potential redemption gates, notice periods, and limited redemption dates. By comparison, the liquidity terms offered by FoFs are typically more flexible. Most FoFs offer quarterly or monthly liquidity in normal market conditions. Some FoFs even offer daily liquidity, either through a listing on an exchange or via an over-the-counter secondary market that matches demand and supply.
- ACCESS TO CERTAIN MANAGERS: Access to the best talent and ideas in the hedge fund community is a scarce resource. The most desirable hedge funds may be closed to new investments. Many investors do not have the necessary networks and protocol for obtaining investment capacity in these funds when it becomes available. Investing in an existing FoF that is already allocated to these desirable hedge funds is the fastest way to immediately participate in their performance.
- NEGOTIATED FEES: Thanks to the power of their collective assets, some FoFs have successfully negotiated access to certain managers at reduced fees. This is normally beyond the capabilities of most individual investors.
- REGULATION: In order to facilitate their distribution to a wider audience, some FoFs choose to register in regulatory jurisdictions that offer better investor protection than their underlying investments, even though the cost and administrative and operational burdens may be higher. The improved investor protections can often be reassuring for first-time investors and can ensure that they will receive sufficient transparency, oversight, and quarterly reports.
- CURRENCY HEDGING: Although the currency of choice in the hedge fund world is the U.S. dollar, some FoFs offer share classes denominated in various currencies with the currency risk hedged. Whereas institutional investors often wish to manage their own currency risks, many small or private investors prefer to be shielded from currency fluctuations and thus delegate the hedging aspects to professional managers.
- LEVERAGE: Some FoFs provide leverage to their investors. They borrow money in addition to the capital provided by their investors and invest it in a portfolio of hedge funds. This allows them to produce higher returns than would be produced with an unlevered FoF, as long as the leverage and interest costs incurred are surpassed by the unlevered returns of the underlying hedge fund portfolio.
- EDUCATIONAL ROLE: Many first-time hedge fund investors look at FoFs not simply as an investment vehicle but as a way of learning about hedge fund strategies and hedge fund managers. Larger investors may switch to direct investments in hedge funds after gaining a few years of experience.
21.1.4 Six Disadvantages to Investing in Funds of Funds
Conversely, there are disadvantages to investing in funds of funds. These include the following six potential disadvantages:
- DOUBLE LAYER OF FEES: FoF managers effectively pass on to their investors all fees charged by the underlying hedge funds in their portfolios, while also charging an extra set of fees for their own work, as well as for an additional layer of service providers. Many FoFs charge a 1% management fee and a 10% performance fee on top of the average underlying hedge fund management fee of 2% and incentive fee of 20% for the hedge funds. Due to economies of scale, institutional investors making large allocations have recently been paying much lower fees than the 1% and 10%.
- PERFORMANCE FEES NOT NETTED: In an FoF, the investor must pay performance fees for each of the underlying hedge funds that are profitable, regardless of the performance of the overall portfolio. Thus, if half the managers are down 10% and the other half are up 10% on a gross basis, the investor will have to pay a performance fee to the positive performers despite no positive returns at the aggregate level. The fees are the same for portfolios of funds using direct investing. However, the fees are generally lower using a multistrategy fund, discussed later, because performance fees are charged on a netted or aggregate basis.
- TAXATION: Because of their offshore registration, many hedge funds and FoFs may be tax inefficient for certain investors in certain countries. As an illustration, in Germany, most FoFs invest in hedge funds that fail to meet the extensive notification and disclosure duties requested by the German authorities. As a result, their gains are subjected to heavy taxation penalties, which ultimately affect the investor.
- LACK OF TRANSPARENCY: Some FoF managers do not disclose the content of their portfolio or their asset allocation. They contend that it represents the valuable skills that they bring to the table, and they are reluctant to reveal their full strategy. In such cases, it becomes relatively difficult for their investors to understand what is really happening in terms of risk and returns beyond the information that can be ascertained from the stream of net asset values (NAVs).
- EXPOSURE TO OTHER INVESTORS' CASH FLOWS: FoFs commingle the assets of a number of investors. As a result, investors are affected jointly by inflows and outflows, since co-investors in the same fund may trigger cash increases or decreases or undesirable leveraging to finance redemptions. Furthermore, to satisfy investors' requests for redemption, the FoF manager will typically sell the most liquid funds first, leading to a potential change in the FoF's style. Custom portfolios for a single investor (managed accounts) are not exposed to this type of problem.
- LACK OF CONTROL: In an FoF, investors give up control over how the assets are managed. Moreover, they lose the direct relationship with the hedge funds in which the FoF invests. Direct investment in hedge funds allows investors to create allocations that fit their overall portfolios, but investors in FoFs can't control this style allocation. For example, the pension fund of a bank may not wish to have exposure to distressed credit instruments because of the business risk of the pension fund's sponsor.
21.1.5 Three Major Ways for FoF Managers to Add Value
One of the most important debates with respect to FoFs concerns whether they deserve their second layer of fees. For example, do funds of funds add value relative to a direct investing approach that randomly selects a portfolio of, say, 20 to 40 hedge funds? In practice, there are essentially three major ways for FoF managers to add value from portfolio selection and asset allocation:
-
THROUGH STRATEGIC ALLOCATIONS TO VARIOUS HEDGE FUND STYLES: Running an FoF is not just simply a matter of assembling a large collection of good managers. Having such a collection can still result in a concentration of risks, with somewhat illusory diversification if there is a high level of correlation in the trades or underlying exposures of these managers. The first choice that an FoF manager must make when organizing a portfolio is the long-term strategic asset allocation. The strategic allocation sets the long-term weights across strategies, such as static weights of 20% on macro strategies and 30% on equity strategies.
This normally implies analyzing the long-term risk and return profiles of the different strategies, as well as examining the correlation of their observed and expected returns. The goal is then to determine an initial portfolio allocation consistent with the fund's long-term objectives and constraints. This task determines the long-run beta of the fund with respect to various sources of risks. Superior strategic asset allocations would be an important way for a fund of funds manager to add value.
-
THROUGH TACTICAL ALLOCATIONS ACROSS HEDGE FUND STYLES: Tactical asset allocation refers to active strategies that seek to enhance short-term portfolio performance by opportunistically shifting the asset allocation in response to the changing environment. Many FoFs argue that they implement a top-down, tactical allocation process. In theory, this involves making three key style-weighting decisions periodically: (1) what to do (i.e., overweighting or underweighting a particular investment style); (2) when to do it (i.e., implementing the changes based on levels of certain indicators or factors); and (3) how much to do (i.e., deciding whether the overweight should be, for example, 1% or 3%).
In practice, however, an FoF's tactical allocations are limited due to the underlying hedge funds' liquidity constraints unless the fund of funds invests in the most liquid areas of alternative investments or uses managed accounts. However, new investment flows received by the FoF can be used to reallocate to the most attractive tactical opportunities. Thus, tactical allocation may be a way for fund of funds managers to add value by determining how much the FoF adjusts its asset allocations in response to changes in the market environment.
- THROUGH SELECTION OF INDIVIDUAL MANAGERS: FoF managers can add value within a strategy through the decision of how much money to invest with each manager. Although this manager selection activity seems very similar to a traditional stock selection activity, the reality is that FoF managers need to consider the liquidity of the funds. Managers have to make a trade-off between their ability to add value through dynamic manager allocations in highly liquid funds and the potential contribution of less liquid funds (those with lockups, etc.). Managerial selection can be a major source of added value for an FoF manager.
21.1.6 How Many Hedge Funds Provide Reasonable Diversification?
The first issue to consider when constructing a portfolio of hedge funds is how many funds are needed to achieve appropriate diversification. That is, how many funds are required to reduce manager- and style-specific risks while maintaining manager weights large enough for superior manager selection to have a positive impact on the portfolio? We discuss two methods of estimating the relationship between number of funds and level of diversification: empirical and theoretical.
Using the empirical approach, Fothergill and Coke suggest that a broadly diversified portfolio of between 15 and 20 hedge funds can reduce portfolio volatility to the level of fixed-income investments.2 Amo, Harasty, and Hillion measure the impact of each additional hedge fund investment on the standard deviation of terminal wealth.3 At a one-year time horizon, a portfolio of eight hedge funds has half of the standard deviation of a single hedge fund, and investing in as few as five funds cuts the risk by more than half at a time horizon of 5 or 10 years. The marginal risk reduction benefit of adding more than 15 to 20 hedge funds is minimal. Gregoriou states that portfolios of more than 40 hedge funds dilute manager skill and approach the risk and return of a hedge fund index.4
The problem with the empirical approach to estimating the benefits to diversification is differentiating between systematic and diversifiable risks and the assumption that future returns will offer the same levels of diversification indicated by analysis of past returns. A theoretical approach is to model the returns of a portfolio as depending on the weights, variances, and covariances of the returns of the constituent assets. Equation 4.24 from Chapter 4, replicated here, reflects Markowitz's pioneering expression for the variance of a portfolio when the assets are uncorrelated:

when ρ = 0 between all n individual assets.
To derive a simple rule, this equation is used while assuming that all assets in the portfolio are equally weighted, all assets have no systematic risk, and all assets have equal variances, σ2. In this case, the variance of the portfolio is σ2/n. Given these assumptions, the standard deviation of the rate of return on the portfolio is directly related to the number of funds, as indicated in Equation 21.1:
where σp is the standard deviation of the portfolio's return, σf is the standard deviation of every constituent fund, and n is the number of assets in the portfolio.
Equation 21.1 provides a simple approximation of risk reduction based on the number of funds. If there are four funds, Equation 21.1 approximates that the standard deviation of the portfolio will be half the standard deviation of a single fund. Portfolios with 16 and 100 funds will have 75% and 90% less standard deviation than a single fund. Equation 21.1 assumes zero correlation between fund returns, which overstates the benefits to diversification. However, these results may provide reasonable indications of the reduction in the idiosyncratic risks.
21.1.7 Identifying Funds for an Institutional Portfolio or Fund of Funds
The second issue to consider is that of manager selection and due diligence, which is described in detail in Chapter 31. Out of thousands of single-manager hedge funds, how does the portfolio manager attempt to select the best mix of perhaps 20 managers? Many hedge fund investors have one or more simple rules that immediately reduce the number of hedge funds under consideration. For example, a size rule requiring minimum assets under management (AUM) of $200 million immediately reduces the number of funds under consideration to less than 1,400.
The manager funnel, as shown in Exhibit 21.3, shows the steps taken to select a small number of managers from the vast sea of candidates. Quantitative screens, such as a minimum length of track record, minimum returns, or maximum risk when compared to funds in the same style, can also quickly reduce the number of hedge funds under investment consideration. Other criteria may include manager capacity and the ability of the fund of funds manager to build a long-term relationship with the hedge fund manager. The next step, due diligence, is the most expensive and most challenging, beginning with locating and meeting each hedge fund manager. Although locating managers can be accomplished through database searches, many fund of funds managers have an edge through proprietary knowledge of managers who do not report their returns to databases. Large investors are also frequently contacted by managers who wish to present their funds for investment consideration.

Exhibit 21.3 Hedge Fund Selection Process
Suppose that after the quantitative screens and the first manager interview, the portfolio manager has selected an initial 100 to 200 funds for further consideration. Perhaps there are 10 to 20 funds in each investment style. Once the portfolio manager is initially satisfied with this group of candidates, the in-depth due diligence process begins. After reviewing a completed due diligence questionnaire, as discussed in Chapter 31, the investor visits the hedge fund manager's office. The on-site visit gives the investor an opportunity to interview a broad number of staff members from the hedge fund to determine the manager's level of skill and ability to manage market risks and minimize operational risks. The prospective investor should also conduct reference checks, contact service providers, and verify systems and trading programs.
21.2 Investing in Multistrategy Funds
A growing number of hedge fund managers are adopting a multistrategy approach to investing, in which a single hedge fund diversifies its trading and its positions across the macro and managed futures, event-driven, relative value, and equity hedge fund strategies. In many cases, the multistrategy fund designates one portfolio manager to allocate funds across strategies to various sub-managers, moving assets across teams trading each of the underlying strategies.
21.2.1 Incentive Fees as a Potential Advantage of Multistrategy Funds
The key advantage of a multistrategy fund over a fund of funds is the lack of an explicit second level of fees. Many multistrategy funds charge fees similar to those of a single-strategy hedge fund manager, such as 2 and 20. Although funds of funds pay each of their underlying managers similar fees, the fund of funds manager also earns an additional fee, typically 1 and 10. The second layer of fees can cause a fund of funds to have total fees of 3 and 30.
Reddy, Brady, and Patel discuss the importance of fee netting when evaluating multistrategy funds versus funds of funds.5 Most multistrategy funds charge the incentive fee on the aggregated returns of the combined portfolio of underlying strategies. Fee netting in the case of a multistrategy fund is when the investor pays incentive fees based only on net profits of the combined strategies, rather than on all profitable strategies. This is a distinct advantage over a fund of funds. With a fund of funds arrangement, each underlying fund can charge 2 and 20, irrespective of the performance of other funds; there is no netting of profits and losses across funds in determining incentive fees charged by the underlying funds in an FoF.
For example, consider an otherwise identical multistrategy fund and a fund of funds, each having a 0% aggregated return after management fees but before considering incentive fees. The multistrategy fund manager clearly earns no incentive fee, as there are no aggregated profits to share between the manager and the investors. Suppose, however, that half of the funds underlying the fund of funds posted 10% returns before incentive fees, while the other half posted 10% losses before incentive fees. The fund of funds, like any other limited partner in the funds posting a profit, has to pay 20% incentive fees to those funds that have earned a profit. Thus, the fund of funds pays incentive fees in the amount of 1% of AUM to the half of the underlying managers earning 10% returns (assuming no hurdle rates). However, ignoring possible clawbacks, the fund of funds does not receive an offset on incentive fees from the funds posting 10% losses. Thus, even though the fund of funds does not pay incentive fees to the funds posting losses, the incentive fees on the funds showing profits place the fund of funds at a disadvantage to the multistrategy manager.
Incentive fees were discussed in Chapter 16 as call options on the NAVs of the fund. Limited partners in funds with incentive fees can be viewed as having written call options to the managers. An investor in a fund of funds can be viewed as having written a portfolio of call options, one on each fund. An investor in a multistrategy fund may be viewed as having written a call option on the portfolio of the aggregated strategies. Because the volatility of a portfolio is generally much lower than the volatilities of the constituent assets, the call options written by the multistrategy fund's investors are less expensive (i.e., the incentive fees owed through the multistrategy fund are generally lower than the incentive fees owed through a fund of funds). Lomtev, Woods, and Zdorovtsov estimate that the mean savings from fee netting gives multistrategy managers a 0.23% annual return advantage relative to funds of funds.6
21.2.2 Flexibility and Transparency
Multistrategy funds also have a greater ability to make tactical strategy allocation and risk management decisions than do funds of funds. When a fund of funds manager invests with 20 underlying managers, each investment is subject to possible liquidity terms and limited transparency. The fund of funds manager may agree to an initial lockup period of one year, with quarterly redemption periods thereafter. Whereas some managers may provide monthly portfolio snapshots, other managers jealously guard the details of their holdings. Thus, the fund of funds manager may not be able to obtain financial information or act on information in a timely manner.
Using a multistrategy fund approach, the portfolio manager has real-time access to all positions, making it easy to identify the exact positions, performance, and risks at all times. The multistrategy manager has the ability to direct trading teams to reduce or expand positions. For example, if the portfolio manager tactically believes that macro funds will underperform other funds over the coming quarter, capital can be quickly reallocated across traders from macro funds to other funds within the multistrategy fund without the complications of lockups and redemption periods experienced by fund of funds managers. Also, the transparency allows the portfolio manager to determine and implement portfolio-level hedges to manage the total risk of the multistrategy fund, since the manager has timely and complete information on the composition of the portfolio.
A recent development in the hedge fund world is the emergence of hedge fund companies that build their own internal funds of funds. These hedge fund companies offer several different hedge fund strategies to their investors, housing such funds as equity hedge, event-driven, relative value, merger arbitrage, and global macro all under one roof. These companies then create another hedge fund that optimally rebalances across the underlying hedge funds, effectively creating an internal fund of funds from their existing hedge fund offerings. Although this approach can be used to address transparency issues and liquidity constraints, it focuses the fund of funds investment opportunities on the products of a single company.
Reddy, Brady, and Patel discuss the potential returns to tactical reallocation across hedge fund strategies as adding less value than tactical reallocation between traditional stock and bond investments. Whereas the best- and worst-performing hedge fund reallocation strategies had returns differing by 3.8% per year, the value of switching between stock and bond investments was 8.6% per year. Although it is difficult to measure the style timing skill of multistrategy managers, several papers, including Beckers, Curds, and Weinberger, and Gregoriou, have concluded that funds of funds have not convincingly demonstrated positive market timing skill.7
21.2.3 Managerial Selection and Operational Risks
Whereas multistrategy managers have potential advantages in fees, risk management, and tactical allocation, funds of funds may have a greater ability to add value through manager selection. At a multistrategy fund, the portfolio manager hires a number of trading teams, each of which executes a specific strategy and agrees to have its capital allocation regularly increased or decreased at the discretion of the portfolio manager. The number of traders employed in a multistrategy approach may range from one trader in each of four strategies to possibly five traders in each of 10 strategies. Thus, the multistrategy manager has hired anywhere from four to 50 traders, among whom the manager can manage risks and make capital allocation decisions. In contrast, the fund of funds manager may have the ability to allocate to any of the more than 8,000 single-strategy fund managers, clearly a wider selection than the multistrategy fund has to choose from once the multistrategy team has been formed.
Although asset allocation is much more important than manager selection in traditional investments, the opposite is probably true in the hedge fund universe. Reddy, Brady, and Patel estimate a 7% annual difference in returns between top-quartile and bottom-quartile hedge fund managers within hedge fund styles, with only a 3.8% spread across strategies.8
Some investors may be concerned with the operational risks of investing in a multistrategy fund. Whereas funds of funds diversify operational risk across 10 to 20 independent managers and organizations, a multistrategy fund has a single operational infrastructure. Market risk may also be a concern, as a catastrophic loss in even one of the multistrategy fund's underlying strategies may sink the entire fund. Conversely, the failure of one of a fund of funds' 20 managers may subject investors to only a 5% loss and not affect the fund's other investments. Chapter 29 reviews several prominent failures in which investors lost all or most of their money.
Empirical evidence indicates that multistrategy funds have historically outperformed funds of funds on a risk-adjusted basis, predominantly due to the extra layer of fees charged by fund of funds managers. Agarwal and Kale estimate that multistrategy funds outperform funds of funds by a net-of-fees alpha of 3.0% to 3.6% per year after accounting for exposure to market risks.9 Agarwal and Kale attribute the superior performance of multistrategy managers to a self-selection effect. The self-selection effect in this case is when only the most successful and confident single-strategy hedge fund managers choose to become multistrategy managers by hiring a team of experts and expanding into the world of multistrategy funds. However, it can be argued that the best and brightest among the available hedge fund managers do not remain satisfied in the role of multistrategy fund manager, preferring to manage their own single-strategy fund in order to link their compensation to their own money management skill rather than to the performance of the managers they oversee.
21.3 Investing in Funds of Hedge Funds
The primary purposes of funds of funds are to reduce the idiosyncratic risk of an investment with any one hedge fund manager and to tap into the potential skill of the fund of funds manager in selecting and monitoring hedge fund investments. Also, some funds of funds have continued access to investing with managers whose funds are closed to new investors. Access is an investor's ability to place new or increased money in a particular fund. The access to otherwise closed funds is a potential advantage of a fund of funds for an investor relative to the investor forming his own portfolio. Additionally, some funds of funds arrange to have a liquidity facility that can bridge the fund's mismatches between subscriptions and redemptions. A liquidity facility is a standby agreement with a major bank to provide temporary cash for specified needs with pre-specified conditions.
21.3.1 Funds of Hedge Funds as Diversified Pools
There is safety in numbers. An analogy is that as mutual funds are to single stocks, funds of funds are to single managers. Funds of funds offer diversification and professional management, just like mutual funds. Just as mutual funds invest in a large number of stocks across industries to diversify risk, funds of funds invest in multiple hedge fund managers and strategies to control risk. Investing in a single stock has some commonalities to investing in a single hedge fund manager in that there is a substantial amount of idiosyncratic risk. The company's industry or the hedge fund manager's style may be out of favor, or the CEO of the company or the fund manager may make some substantial mistakes. If a fund of funds invested in a single manager or strategy that experienced dramatic losses, the investor's losses would be reduced by the other investments that maintained or grew their value. Whereas concentrated investments in single stocks or hedge funds can lead to riches or ruin, diversified investments in mutual funds and funds of funds earn returns in a much narrower range, due to the reduction in idiosyncratic risk inherent in portfolios that contain multiple investments.
A fund of funds may seek to reduce operational risk and improve transparency for the fund of funds manager by placing the fund's money in managed accounts or separate accounts. Rather than investing as a limited partner and allowing the individual hedge fund managers as general partners to take custody of the assets of the fund of funds, the manager of the fund of funds can invest using a managed account or separate account that allows the hedge fund managers to trade the assets while the fund of funds controls the custody of the assets. This arrangement nearly eliminates the ability of the hedge fund managers to steal the funds or misrepresent performance. Because the assets are controlled by the fund of funds, the manager has perfect transparency, allowing the fund of funds manager to see all performance and positions in real time, which improves the manager's ability to manage risk and oversee investors. The liquidity of the fund of funds portfolio also increases, as the underlying hedge funds typically can't enforce lockup and gating provisions in a managed account framework.
Empirical evidence indicates that the returns to funds of funds have underperformed the returns of a broad hedge fund index. However, it may be inappropriate to directly make this comparison. Fung and Hsieh use hedge fund databases to document findings that funds of funds suffer less from survivor bias and selection bias than do individual hedge funds.10 Hedge fund survivor bias was found to be 3% annually, whereas the survivor bias of funds of funds was 1.4% annually. Instant history bias was also less for funds of funds, 0.7%, than for hedge funds, 1.4%. In fact, Fung and Hsieh suggest that analyzing the returns to funds of funds may give a more realistic view of the performance of the hedge fund universe. There are several reasons that funds of funds would give a less biased view of hedge fund performance, including the following:
- Survivor bias arises when returns from dead funds are removed from, or never included in, a database. Funds of funds that invested in funds that eventually liquidated, however, retain the returns of those funds in their track records.
- Similarly, instant history bias is reduced, as funds of funds count the returns to their investments in single hedge funds from the date of investment.
- Funds of funds use actual investment weights, which may better reflect the weights used by typical investors.
Because of the second layer of fees, the after-fee returns of funds of funds are, on average, lower than hedge fund returns. However, it would be a mistake to conclude that funds of funds do not add value. In addition to reducing the due diligence cost of building a diversified portfolio of single-manager hedge funds, funds of funds may have skill in evaluating the hedge fund managers. In one study, Ang, Rhodes-Kropf, and Zhao argue that funds of funds should not be evaluated relative to hedge fund returns from reported databases.11 Instead, the correct fund of funds benchmark is the return an investor would achieve from direct hedge fund investments individually, without recourse to funds of funds. Once fund of funds performance is compared to the correct benchmark, Ang and colleagues conclude that on average, funds of funds add value on an after-fee basis.
Ammann and Moerth find that larger funds of funds have statistically significant levels of higher returns and alpha than do smaller funds.12 In addition, the larger funds also have significantly lower standard deviations, which lead to higher Sharpe ratios. The authors surmise that the larger funds of funds have greater operational resources, which can be used to invest in stronger risk management, portfolio construction, and manager due diligence capabilities. The larger funds may also cater to a more institutionally focused clientele. If the large institutional investors demand lower fees from their fund of funds managers, this fee difference may explain a portion of the return advantage experienced by the larger funds of funds. Brown, Fraser, and Liang argue that the difference in returns between smaller and larger funds of funds represents economies of scale from the fixed cost of performing operational due diligence.13
21.3.2 Funds of Hedge Funds Have Varying Investment Objectives
Funds of funds, like any other investor, can choose to build a portfolio with a wide range of investment objectives. HFR maintains indices that measure the performance of funds of funds, including composite, conservative, diversified, market-defensive, and strategic indices. The composite and diversified indices look most like the hedge fund universe, investing across the macro, equity, event-driven, and relative value strategies, and can be most closely compared to the HFRI Fund Weighted Composite Index of single-strategy hedge funds. Funds of funds included in the conservative index focus on strategies with lower standard deviations, such as equity market-neutral, relative value, and event-driven. Investors in funds included in the strategic index seek to maximize total returns, which is quite different from the risk-reduction goal espoused by many funds of funds. To earn these higher returns, strategic funds tend to make larger allocations to directional strategies, such as equity hedge or emerging markets funds.
Managers of funds of funds included in the market-defensive index seek returns that are uncorrelated to stock and bond markets and have lower downside risk. Defensive funds are likely to have minimal investments in event-driven and relative value strategies, as these managers prefer to overweight investments in macro, systematic diversified, and short selling funds.
Although the vast majority of funds of funds are diversified across a number of strategies, some funds of funds eschew this diversification to focus on a single sector. The most popular of these focused funds invest only in equity strategies, only in managed futures, or only in funds within a specific geographic region. These single-strategy or sector-focused funds of funds may be attractive to investors who seek the specific return profile of one strategy, such as managed futures, but believe that it is important to invest in a number of managers to reduce the fund-specific risk.
21.3.3 Funds of Funds as Venture Capitalists
In some cases, it can be difficult to tell the difference between private equity funds and hedge funds. Within the specific strategies of distressed investments or equity activists, the line between private equity funds and hedge funds becomes increasingly blurred, especially when hedge funds invest in private securities or private equity funds invest in public securities.
Some funds of funds also blur the line between hedge fund and private equity investments. Seeding funds, or seeders, are funds of funds that invest in newly created individual hedge funds, often taking an equity stake in the management companies of the newly minted hedge funds. One reason that a seeding fund may create new funds is to obtain transparency and capacity in its underlying hedge fund managers, which can be difficult to obtain with existing hedge funds. Perhaps the best way for a fund of funds to guarantee transparency and capacity over the long run with specific hedge fund managers is for the fund of funds to own a stake in the hedge fund management company.
Further, although hedge fund managers are experts at trading strategies, not all hedge fund managers have the time, connections, or skill to raise funds, and some may not have the resources or knowledge to build the infrastructure of a new hedge fund. Funds of funds are experts at raising capital from investors and structuring new investment vehicles. These complementary needs and skills can form the basis for a seeding relationship, or an incubating relationship, between a fund of funds and a start-up hedge fund manager. In a seeding relationship, the fund of funds may provide the fledgling hedge fund manager with $20 million or so in capital, in addition to the legal and accounting documents, infrastructure, and relationships needed to start the hedge fund. The fund of funds manager may also serve as a third-party marketer, soliciting investors for the new hedge fund. In return, the hedge fund manager guarantees capacity to the fund of funds, even when the hedge fund has closed its doors to other investors. The fund of funds also has an equity stake in the hedge fund manager, which may earn the fund of funds 20% of the hedge fund's total fees and/or the value of the firm upon the sale of the hedge fund management company to an external investor.
The seeding activity of a fund of funds may eventually reach 10 managers across a number of strategies. At $20 million per manager, the fund of funds has $200 million of investor capital placed with the underlying managers, quite similar to a traditional fund of funds without the seeding activity. The seeding fund of funds earns the return to the underlying hedge fund portfolio, perhaps at preferential fees. In addition to the return on the hedge fund portfolio, the fund of funds also receives an equity kicker. To the extent that any of the underlying managers becomes extremely successful, perhaps raising $500 million in investor capital, the value of the fee and equity sharing agreement with the fund of funds can become quite valuable, possibly exceeding the return on the investment in the underlying hedge fund strategy.
21.4 Investing in Portfolios of Single Hedge Funds
Although funds of funds provide instant diversification, they do so at the cost of an extra layer of fees. Whereas investors with a small amount to invest in hedge funds may find these fees to be cost-effective, larger investors need to compare the value of paying fees to funds of funds relative to building a portfolio of hedge funds using in-house resources.
There are a number of costs involved with the hedge fund due diligence process. It is expensive to subscribe to hedge fund databases, to hire and retain internal staff skilled in manager selection and portfolio construction, and to fund the expenses of visiting and evaluating each hedge fund manager. In addition, since the minimum investment in hedge funds tends to be rather large, only investors with very large portfolios can hold a diversified portfolio of hedge funds.
Keith Black discusses a buy-versus-build heuristic that institutional investors should consider.14 A fund of funds approach has a median second layer of hedge fund fees, including a management fee of 1% and an incentive fee of 10%. Black estimates that a full internal program has a minimum annual cost of $1 million for building and maintaining an internal fund evaluation program. Investors may find it cost-effective to build their own hedge fund portfolio once assets allocated to hedge funds exceed $50 million. This result is found by dividing $1 million by 2%, which is the total fee, assuming a typical incentive fee of 1% of AUM. However, for investors with less than $50 million to invest in hedge funds, paying 2% fees to a fund of funds manager can be seen as a lower-cost alternative to spending $1 million annually in-house.
Exhibit 21.4 describes the minimum initial investment sizes required by individual hedge funds. The information presented in the exhibit can be used to help set an investment minimum for building an internal hedge fund portfolio. The median hedge fund has a minimum investment size of $500,000. If investors need approximately 20 hedge funds to be well diversified, then investors would need a minimum hedge fund portfolio of $10 million to consider investing directly in single-manager hedge funds. Yet even if an investor has $10 million to commit to hedge funds, the expenses of building the fund may be prohibitive (e.g., $1 million of expenses, as discussed, would represent 10% of the $10 million investment). Accordingly, small investors are attracted to funds of funds.

Exhibit 21.4 Fund Minimum Investment Sizes, 4Q 2014, as Estimated by HFR. Source: HFR Industry Reports, © HFR, Inc. 2015, www.hedgefundresearch.com.
21.5 Multialternatives and Other Hedge Fund Liquid Alternatives
Liquid exposure to hedge fund strategies is a large and relatively new category of the liquid alternatives introduced in Chapter 2.
21.5.1 Emergence of Liquid Alternatives
As the quality and the number of liquid strategies increase, the business model of funds of funds could be negatively affected. When individual investors can easily access transparent, liquid hedge funds with a low minimum investment, the advantages of a fund of funds to diversify investments and offer a low minimum subscription become much less compelling. Not only do liquid alternatives provide access to hedge fund strategies at lower fees and small minimum investments, but search costs are also reduced, as exchange-traded strategies have regulatory-mandated disclosures that allow both large and small investors to quickly access information regarding all exchange-traded hedge fund strategies.
Historically, most hedge funds have been offered mainly as illiquid and less-than-transparent private placements, sold to high-net-worth and institutional investors. Liquid alternative investments are innovative products that democratize alternative investments by allowing all investors to easily access these strategies in an exchange-traded and transparent format.
A hedge fund is an investment pool or investment vehicle that is privately organized in most jurisdictions and usually offers performance-based fees to its managers. Hedge funds can usually apply leverage, invest in private securities, invest in real assets, actively trade derivative instruments, establish short positions, invest in structured products, and hold relatively concentrated positions.
Investment managers in private placement vehicles have the ultimate flexibility, in that they can take as much or as little risk as investors or counterparties allow. In private placement formats, long lockup periods can encourage holding illiquid or complex assets, which may earn higher long-term returns. If there is a liquidity premium, in which less liquid assets tend to earn higher returns, then some fund managers may choose to hold most or all of their assets in less liquid holdings.
Whereas hedge funds are relatively unregulated, exchange-traded or liquid alternative investments must comply with local regulations, such as the Investment Company Act of 1940 (commonly referred to as “the ’40 Act”) in the United States or Undertakings for Collective Investment in Transferable Securities (UCITS) in Europe. These regulations specifically legislate minimum levels of liquidity and transparency, and maximum levels of leverage, derivatives, shorting, and investment concentration.
On average, private placement funds will have higher returns and higher risks due to the extra freedom allowed in the portfolio management process. Exchange-traded liquid alternatives will generally have lower returns and lower risks than private placements trading similar strategies, as the regulatory restrictions reduce investment manager flexibility. However, asset flows into liquid alternative vehicles have been strong, with assets in UCITS and ’40 Act registered funds combining to reach nearly $600 billion at the end of 2013. The investors attracted to liquid alternative products are those who may value the lower fees, greater transparency and liquidity, as well as the reduced risk of these products over the potentially higher returns from private placement products. There is also evidence of retail investors, or those not legally allowed to access private placement products due to low net worth levels, increasingly investing in liquid alternative products to diversify their portfolios in ways that were previously not possible.
21.5.2 UCITS Framework for Liquid Alternatives
The regulatory requirements for a UCITS fund were introduced in Chapter 2. UCITS-compliant funds were generally managed as long-only stock and bond funds for the first 15 years of the regulatory regime. When UCITS III was enacted in 2001, the regulations allowed the use of options, futures, and other strategies for the first time, which opened the door for managers to offer hedge-fund-like strategies in a UCITS-compliant vehicle. UCITS IV, enacted in 2011, allows fund mergers and master-feeder structures, which gives even greater flexibility to hedge fund managers.
Although private placements offer the investment manager a great deal of flexibility when implementing an investment strategy, UCITS regulations have strict requirements for transparency, risk, and liquidity of compliant funds.15 UCITS regulations require reporting of holdings at least every two weeks to enable investors to view the composition of their funds on a regular basis.
In some aspects, UCITS regulations are less flexible than those of the U.S. Investment Company Act of 1940. For example, investments in property, private equity, and commodities are generally not permitted in UCITS funds. Leverage and concentration risks are also tightly controlled in UCITS funds, with leverage and risk typically limited to 200% of the NAV or risk of the underlying index. UCITS-compliant funds are required to be highly diversified, meaning that there are limits on the size of specific holdings within each fund. For example, UCITS regulations limit the holdings of a single European Union sovereign debt issuer to 35% of fund assets, the holdings of a single investment fund to 20%, the holdings of illiquid investments to 10%, and the amount of assets deposited within a single institution to 20%. Finally, there is a 10% limit on holdings of a single corporate issuer, or 20% when derivatives are included.
21.5.3 Funds Registered under the ’40 Act
Unlike the less liquid regime of private placements, funds compliant with the ’40 Act regulations must offer regular liquidity, with redemptions being paid within seven days. Fund holdings must also be disclosed on a regular basis. Perhaps the most interesting aspect of the ’40 Act regulations is that performance fees for funds that trade securities must be symmetric. That is, the sharing of investment profits by investment managers must be matched by the sharing of investment losses. In the private placement world, hedge fund or private equity managers frequently earn asymmetric incentive fees. Hedge fund managers typically have incentive fee structures that allow managers to receive 20% of all fund profits without the requirement of compensating investors for 20% of their losses. This asymmetric fee structure, which is very attractive to managers of private placement products, is not compliant with the regulations of the ’40 Act. Although most managers of ’40 Act funds do not charge performance fees, there are a few managers who charge symmetric performance fees. These performance-based fees are unlikely to ever be as popular with liquid alternative managers as the asymmetric performance fees that can be earned in the private placement world.
The ’40 Act also places limits on each fund's leverage. There is a 300% asset coverage rule, which requires a fund to have assets totaling at least three times the total borrowings of the fund, thus limiting borrowing to 33% of assets. A fund with 150% long positions and 50% short positions would comply with the regulations, whereas a fund with 200% long positions and 100% short positions would not. The concentration limits of the ’40 Act are less complex than those of UCITS. Under the ’40 Act, diversification regulations apply to 75% of the fund's portfolio, while the remaining 25% of the fund has no concentration limits. In the diversified portion of a fund, investment concentrations cannot exceed 5% of assets invested in one issuer, 25% in one industry, or more than 10% of the shares outstanding of a single company. Finally, there are limits on liquidity risk, specifying that no more than 15% of the fund can be invested in illiquid assets.
21.5.4 Availability of Liquid Alternative Strategies
Let's review our four key hedge fund strategies in the context of the regulatory framework for liquid alternative investments.
Macro and managed futures funds are broadly available as liquid alternative products, given that the underlying holdings of futures and forward contracts can be extremely liquid. Funds using a ’40 Act fund structure can access managed futures returns by holding funds as collateral and entering into swap agreements that transport the returns of managed futures into the liquid alternative structure. Liquid alternative funds, though, may be managed with less concentration and leverage than typical macro funds. Investors need to perform due diligence carefully on funds in this sector, as leverage and asymmetric incentive fees may be buried in the swap products that are often used inside the liquid alternative vehicles.
Event-driven hedge funds are a broad variety of strategies that focus on corporate events. Strategies such as merger arbitrage or activism are likely to be compliant with liquid alternative regulations but aren't yet broadly available in a liquid alternative format. Other strategies, such as distressed investing, are likely to be too illiquid to be offered in an exchange-traded format. Similarly, traditional private equity strategies are typically not available as liquid alternatives, as the time to exit may be years away, far longer than the daily or weekly liquidity expected by investors in liquid alternative funds.
Relative value hedge funds focus mainly on convertible bond arbitrage and fixed-income arbitrage strategies. These funds generally hold long positions in underpriced bonds and short positions in bonds or stocks meant to hedge the long positions. Because the divergences between the long positions and fair value are often small in these strategies, relative value funds are often managed at levels of leverage far in excess of those allowed under the UCITS or ’40 Act regulations. As such, relative value funds are not generally available in a liquid alternative format.
Compared to other hedge fund styles, equity hedge fund strategies have attracted the largest AUM in the liquid alternative sector. Long/short equity funds are the most popular strategy, with equity market-neutral funds following closely behind. Perhaps the availability of equity funds in a liquid alternative format is so prevalent due to the similarity of the strategy in the private and public formats. That is, a large number of equity hedge funds are likely to be compliant with the regulatory requirements for alternative investments, even when managed in a private placement structure.
The liquid alternative space is broader than hedge funds, including funds with exposure to commodities, currencies, and nontraditional bonds. Nontraditional or unconstrained bond funds do not simply take long positions in investment-grade sovereign and credit securities, but may also invest in high-yield or emerging markets debt, often including leverage and short positions. These funds may increase exposure to credit risk while reducing the risk to changes in the level of investment-grade interest rates.
21.5.5 Engineering Illiquid and Leveraged Strategies into Multialternatives
Multialternative funds are liquid alternative funds that offer a strategy similar to that of funds of funds, in that they diversify across fund managers and strategies. Long/short equity and multialternative funds comprise more than half of assets under management within the category of liquid alternatives focused on hedge-fund-like strategies.
Both investors and hedge fund managers may find multialternative funds attractive. Investors can buy a single multialternative fund as a diversified offering, similar to that of a fund of funds. Hedge fund managers may wish to serve as a sub-adviser to a multialternative fund, especially when their stand-alone strategy does not comply with the liquid alternative regulations.
For example, some hedge fund strategies, such as highly levered fixed-income arbitrage or event-driven, are difficult to manage within the leverage constraints of the ’40 Act. However, these fund managers are finding success within the multialternative or multimanager structure, as the provisions of the ’40 Act apply to the full fund, not to the individual strategies. That is, highly levered fixed-income strategies can be mixed with strategies that tend to use less leverage, such as equity long/short strategies. By combining strategies with varying levels of target leverage within a multialternative fund, the total fund may comply with the leverage provisions of the ’40 Act without materially changing the strategy or positions preferred by more highly levered managers.
Managers may also prefer to be a sub-adviser to a multialternative fund rather than offering their own liquid alternative funds, as that role more clearly delineates between the manager's private placement and liquid alternative investments. Managers who offer both a private placement fund and a liquid alternative fund following similar strategies must be careful to demonstrate that the private placement fund adds value relative to the greater liquidity and lower fees offered in the exchange-traded market.
21.5.6 Performance of Liquid Alternative Vehicles
Next, let's look closely at the empirical evidence: the studies of actual historical returns of alternative investments. We will look at return performance using various approaches: matched-sample tests, comparison of U.S. indices to one another, and comparison of U.S. indices to European Union indices.
We begin with matched-sample tests. Perhaps the best way to determine the true risk and return difference between liquid alternative funds and private placements is to find a subset of funds in which each manager offers both a hedge fund and a mutual fund running similar strategies. Of course, this matched-sample performance analysis technique is not perfect, as only a small number of funds will be included in each study.
A 2013 study by Cliffwater LLC does just that, comparing two investment vehicles offering the same strategy.16 Its finding is that, on average, liquid alternative funds have lower risks than limited partnership (LP) funds that employ the same strategy. This makes sense to us, as the regulatory restrictions constrain the investment flexibility of managers in the mutual fund vehicle. The good news for mutual fund investors is that net of fees, returns for liquid alternative funds trail returns of the LP fund offered by the same manager by less than 1% per year. Some strategies, such as equity long/short, credit, market-neutral, and macro and managed futures funds, had return differences between 0.42% and 0.94% per year. Other strategies, namely event-driven and multistrategy funds, had return differences as large as 2.18%. As previously stated, the higher leverage employed in these strategies exacerbates the difference between the more highly levered LP vehicle and the much less levered mutual fund.
A 2014 study by David McCarthy looks at a sample of LP and registered funds, and finds that equity long/short funds have had similar returns and market exposures across the two fund types.17 This is good news for retail investors, as it means that retail investors in hedged equity mutual funds are getting a qualitatively similar experience to investors in equity hedge funds.
Finally, a 2014 study by Barclays segregates ’40 Act fund offerings by whether the manager has had experience managing hedge funds or long-only mutual funds.18 This study finds that all ’40 Act funds with net long positions have earned a return of 0.9% per year, the HFRI Fund Weighted Composite Index have earned a return of 2.3% per year, and mutual funds run by hedge fund managers have earned 1.6% per year. This study also shows that during the crisis year of 2008, liquid alternative funds experienced lower drawdowns than the average long-only mutual fund.
21.6 Historical Returns of Funds of Funds
This section analyzes four categories of funds of funds—market-defensive, conservative, strategic, and diversified—using monthly data from January 2000 to December 2014. Each type is analyzed alongside a composite index of funds of funds using the standardized format of exhibits detailed in the appendix.
Market-defensive funds of funds tend to have underlying and unhedged short positions. According to HFR, market-defensive funds of funds invest in funds that “generally engage in short-biased strategies such as short selling and managed futures.”19 As such, this category of funds of funds should have negative correlations with respect to major market indices.
Conservative funds of funds have underlying hedged positions. According to HFR, conservative funds of funds tend to seek consistent returns primarily through “investing in funds that generally engage in more ‘conservative’ strategies such as Equity Market Neutral, Fixed Income Arbitrage, and Convertible Arbitrage.”20
Strategic funds of funds tend to have underlying directional bets. According to HFR, strategic funds of funds seek superior returns primarily through “investing in funds that generally engage in more opportunistic strategies such as Emerging Markets, Sector Specific, and Equity Hedge.”21
Diversified funds of funds represent a broad mix of funds. According to HFR, diversified funds of funds invest “in a variety of strategies among multiple managers.”22
The monthly returns for the various types of funds of funds are summarized in Exhibit 21.5. As indicated in Exhibit 21.5a, the risk-adjusted performance of market-defensive funds was excellent, with a Sharpe ratio of 0.61, owing to high mean returns and low volatility. The skewness and kurtosis were near zero with very low downside risk, as measured by the minimum monthly return and maximum drawdown. In Exhibit 21.5c, correlations and betas indicate that market-defensive funds exhibited slightly positive correlation to world equities rather than the anticipated negative correlation. The market-defensive category of funds of funds showed somewhat strong positive correlations to both global bonds and commodities.
Exhibit 21.5A Statistical Summary of Returns
| HFRI Fund | HFRI Fund | HFRI Fund | HFRI Fund | HFRI Fund | |||||
| of Funds: | of Funds: | of Funds: | of Funds: | of Funds | |||||
| Index | Market Defensive | Conservative | Strategic | Diversified | Composite | World | Global | U.S. High- | |
| (Jan. 2000−Dec. 2014) | Index | Index | Index | Index | Index | Equities | Bonds | Yield | Commodities |
| Annualized Arithmetic Mean | 5.3%** | 3.5%** | 3.8%** | 3.8%** | 3.8%** | 4.4%** | 5.7%** | 7.7%** | 3.8%** |
| Annualized Standard Deviation | 5.1% | 3.9% | 7.1% | 5.1% | 5.2% | 15.8% | 5.9% | 10.0% | 23.3% |
| Annualized Semistandard Deviation | 2.9% | 4.0% | 5.6% | 4.3% | 4.4% | 12.0% | 3.6% | 9.0% | 16.8% |
| Skewness | 0.2 | −2.3** | −0.6** | −1.1** | −1.1** | −0.7** | 0.1 | −1.0** | −0.5** |
| Kurtosis | 0.2 | 9.7** | 2.9** | 4.1** | 4.0** | 1.5** | 0.6* | 7.7** | 1.3** |
| Sharpe Ratio | 0.61 | 0.34 | 0.22 | 0.31 | 0.32 | 0.14 | 0.60 | 0.56 | 0.07 |
| Sortino Ratio | 1.08 | 0.33 | 0.28 | 0.37 | 0.38 | 0.18 | 0.97 | 0.62 | 0.10 |
| Annualized Geometric Mean | 5.2% | 3.4% | 3.5% | 3.6% | 3.7% | 3.1% | 5.5% | 7.2% | 1.1% |
| Annualized Standard Deviation (Autocorrelation Adjusted) | 5.2% | 6.1% | 8.9% | 6.8% | 6.9% | 18.3% | 6.2% | 13.3% | 27.9% |
| Maximum | 4.9% | 2.4% | 8.7% | 5.4% | 5.2% | 11.2% | 6.6% | 12.1% | 19.7% |
| Minimum | −3.2% | −5.9% | −7.7% | −6.5% | −6.5% | −19.0% | −3.9% | −15.9% | −28.2% |
| Autocorrelation | 3.3% | 46.3%** | 24.4%** | 31.5%** | 31.2%** | 16.0%** | 6.1% | 30.7%** | 19.4%** |
| Max Drawdown | −10.9% | −20.4% | −26.8% | −21.8% | −22.2% | −54.0% | −9.4% | −33.3% | −69.4% |
*= Significant at 90% confidence.
**= Significant at 95% confidence.
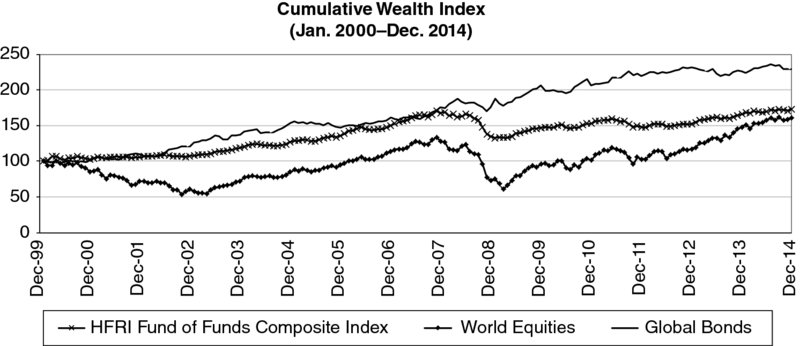
Exhibit 21.5B Cumulative Wealth
Exhibit 21.5C Betas and Correlations
| Index (Jan. 2000−Dec. 2014) | World | Global | U.S. High- | Annualized | ||
| Multivariate Betas | Equities | Bonds | Yield | Commodities | Estimated α | R2 |
| HFRI Fund of Funds: Market Defensive Index | 0.02 | 0.23** | −0.06 | 0.06** | 2.50%** | 0.16** |
| HFRI Fund of Funds: Conservative Index | 0.09** | −0.06* | 0.11** | 0.05** | 0.63% | 0.55** |
| HFRI Fund of Funds: Strategic Index | 0.26** | −0.08 | 0.12** | 0.06** | 0.55% | 0.59** |
| HFRI Fund of Funds: Diversified Index | 0.14** | −0.05 | 0.11** | 0.06** | 0.76% | 0.52** |
| HFRI Fund of Funds: Composite Index | 0.15** | −0.03 | 0.11** | 0.06** | 0.75% | 0.57** |
| World | Global | U.S. High- | %Δ Credit | |||
| Univariate Betas | Equities | Bonds | Yield | Commodities | Spread | %Δ VIX |
| HFRI Fund of Funds: Market Defensive Index | 0.05* | 0.26** | 0.03 | 0.07** | 0.00 | −0.01 |
| HFRI Fund of Funds: Conservative Index | 0.16** | 0.09* | 0.23** | 0.08** | −0.05** | −0.03** |
| HFRI Fund of Funds: Strategic Index | 0.33** | 0.19** | 0.43** | 0.14** | −0.07** | −0.06** |
| HFRI Fund of Funds: Diversified Index | 0.21** | 0.14** | 0.29** | 0.10** | −0.06** | −0.04** |
| HFRI Fund of Funds: Composite Index | 0.23** | 0.16** | 0.31** | 0.11** | −0.06** | −0.04** |
| World | Global | U.S. High- | %Δ Credit | |||
| Correlations | Equities | Bonds | Yield | Commodities | Spread | %Δ VIX |
| HFRI Fund of Funds: Market Defensive Index | 0.14** | 0.30** | 0.06 | 0.31** | −0.02 | −0.11* |
| HFRI Fund of Funds: Conservative Index | 0.65** | 0.13** | 0.60** | 0.51** | −0.49** | −0.45** |
| HFRI Fund of Funds: Strategic Index | 0.74** | 0.16** | 0.60** | 0.44** | −0.36** | −0.55** |
| HFRI Fund of Funds: Diversified Index | 0.66** | 0.16** | 0.57** | 0.47** | −0.40** | −0.50** |
| HFRI Fund of Funds: Composite Index | 0.70** | 0.18** | 0.59** | 0.50** | −0.40** | −0.52** |
*= Significant at 90% confidence.
**= Significant at 95% confidence.
The scatter plot in Exhibit 21.5d indicates that the low correlation between funds of funds and world equities is not attributable to a few outliers.

Exhibit 21.5D Scatter Plot of Returns
As indicated in Exhibit 21.5a, the historical returns of conservative funds of funds indicated low mean returns with low volatility and a moderate Sharpe ratio. The skewness was extremely negative and the kurtosis very high, consistent with the high downside risk, as indicated by the minimum monthly return and maximum drawdown relative to the modest volatility. In Exhibit 21.5c, correlations and betas indicate that conservative funds were generally positively related to world equities, U.S. high-yield bonds, commodities, and global bonds, while showing negative correlations to changes in credit spreads and changes in equity market volatility.
As indicated in Exhibit 21.5a, the historical returns of strategic funds were highly similar to the returns of the composite funds of funds index, including modest mean returns, low volatility, and moderate Sharpe ratios. The skewness was moderately negative, and the excess kurtosis was moderately positive, consistent with the moderate downside risk.
Exhibit 21.5c depicts historical correlations and betas indicating that strategic funds were generally positively related to world equities, U.S. high-yield bonds, commodities, and global bonds, with negative correlations to changes in credit spreads and changes in equity market volatility.
The historical returns of diversified funds shown in Exhibit 21.5a are virtually indistinguishable from the returns of the composite funds of funds index, including modest mean returns, low volatility, and moderate Sharpe ratios. This result is consistent with the idea that both indices indicate the overall performance of the funds of funds category.
The skewness of both the composite and diversified indices was negative, and the excess kurtosis was positive. The historical correlations and betas in Exhibit 21.5c indicate that diversified funds were generally positively related to world equities, U.S. high-yield bonds, commodities, and global bonds, and negatively related to changes in equity market volatility and changes in credit spreads. The strongest correlation was with world stocks.
Overall, the 15 years of data portray funds of funds as offering moderate risk, returns, risk-adjusted returns, and downside risk. As an aggregated sector, there was modest diversification potential. Historical return data are probably of only moderate value in predicting future return behavior, as illustrated in Exhibit 21.5b. Examination of the returns prior to the onset of the financial crisis in 2007 portrays a low-risk, high-return opportunity, whereas returns since 2007 indicate moderate risk and disappointing returns. The dichotomy emphasizes the need for historical return analysis to be only one input into a larger process of professional analysis.
Review Questions
-
List the four functions of fund of funds management.
-
Name four benefits to investing in funds of funds that may lead to higher net returns to limited partners without causing higher risk.
-
Name five benefits to investing in funds of funds that may lead to lower investment risk to limited partners without sacrificing expected return.
-
Describe the double layer of fees in funds of funds.
-
In theory, how would the volatility of an equally weighted portfolio of 16 uncorrelated and equally risky funds compare to the volatility of a single such fund?
-
Why might the incentive fees of a multistrategy fund differ substantially from the incentive fees of an otherwise similar fund of funds even if the stated fees are equal?
-
Why might the operational risks of a multistrategy fund differ substantially from the operational risks of a fund of funds?
-
What is a seeding fund?
-
What investment pools in the United States and Europe provide liquid access of investors to alternative investment strategies?
-
List the four major categories of funds of funds.