The effects of alcohol on behavioural aggression
INTRODUCTION
Because of its association with both violent and nonviolent crime (Murdoch, Pihl, & Ross, 1990; Smith & Burvill, 1987), alcohol is generally believed to facilitate aggression. Laboratory studies have shown that alcohol increases aggressive behaviour under conditions of provocation (Gustafson, 1993) and interpersonal threat (Gantner & Taylor, 1992). Various explanations have been postulated for the effects of alcohol on aggression. Expectancy effects are powerful (Lang, Goeckner, Adesso, & Marlatt, 1975) and although alcohol is usually consumed to induce powerful positive feelings such as euphoria, anxiety reduction, and social disinhibition (Zuckerman, 1987), heavy social drinkers also expect it to increase their aggression (Rohsenow & Bachorowski, 1984). Male drinkers in particular consume alcohol to enhance feelings of power and strength (McClelland, Davis, Kalin, & Wanner, 1972) and this may legitimise acts of aggression (Collins, 1981).
Alcohol is also known to increase physiological arousal and it has been suggested that this state might strengthen aggressive tendencies (Boyatzis 1983). Although alcohol has indeed been shown to raise basal levels of heart rate and skin conductance (Cohen, Schandler, & Naliboff, 1983; Dengerink & Fagan, 1978; Levenson, Sher, Grossman, Newman, & Newlin, 1980), it has also been shown to decrease reactivity to stress (Levenson et al., 1980; Sher & Levenson, 1982). This so-called "stress response dampening" is predicted to occur when an unequivocal stressor is used, and a higher dose (over 1g/kg) of alcohol given. It has been seen when anxiety has been induced in stress tasks (Levenson et al., 1980; Sher & Levenson, 1982) but has not been examined in a task evoking anger or aggression. We decided, therefore, to quantify the effects of two doses of alcohol, low (0.25g/kg) and moderate (0.75g/kg), on the behaviour induced by the competitive reaction time task and on cardiac and electrodermal activity during the task.
Methods
Subjects
Subjects were recruited via advertisements posted on the institutional notice-board and by personal communication, and were paid for participating in a single session. Forty-five subjects took part in the study, 24 females and 21 males, divided into 3 groups, each with 8 females and 7 males. The first group had a mean age of 28.5 years and a mean weight of 68.7kg, the second group 26.6 years and 65.8kg and the third group 26.4 years and 68.3kg.
Drugs and procedure
The study was approved by the appropriate Ethical Committee and each subject gave informed consent. Two doses of alcohol (as vodka) and a placebo were used. Group 1 received the moderate dose, 0.75g/kg alcohol for males. The Widmark factor was used to calculate the dose for females: They received 83% of the male dose so as to achieve the same breath alcohol concentration. The mean amount of vodka given was 164.4ml (198.2 for males; 134.8 for females) made up to 250ml with low-calorie tonic and flavoured with 5ml lime juice. Group 2 received the low dose, 0.25g/kg alcohol, so that the mean volume of vodka given was 53.2ml (62.8 for males; 44.7 for females) made up to 250ml with low-calorie tonic and 5 ml lime juice. Group 3 received 240ml low calorie tonic with 5ml lime juice and 5ml of vodka was floated on the top of the drink to try to maintain the double-blind. Subjects were allowed 15 minutes to consume their drink. They were instructed not to drink any alcohol for 24 hours before testing and not to eat or drink anything (except water) after midnight on the test morning. They completed the first set of measures before the drink at 9.30 a.m. The competitive reaction time task was run 1 hour after the drink had been consumed.
Measures
Breath alcohol concentration
A Lion (Cardiff, UK) Alcolmeter AE-M2 was used to estimate breath alcohol concentrations. The subject inhaled, then blew into the mouthpiece continuously for 6 seconds and the expiration was sampled at 4 seconds. The breath alcohol concentration was measured pre-drink and at 30-minute intervals for 2 hours after the drink. A new mouthpiece was used for each sample.
Competitive reaction time task
This was presented as detailed in Chapter 3. Heart period and skin conductance were recorded during the task as set out in Chapter 3.
Subjective rating scales
The Mood Rating Scale, Anger Rating Scale, and Spielberger State Anxiety Inventory (see Chapter 3) were completed pre-drink, 1 hour post-drink before the competitive reaction time task and immediately after it. The Drinking Questionnaire was filled in once, pre-drink.
Guess concerning alcohol
Subjects were asked to estimate the amount of alcohol they had consumed on a five-point scale from nil to very large. This was completed 1 hour after the drink.
Analysis of data
Multivariate analysis of variance between groups, time, sex, and the interactions thereof was used to analyse the data both for the variables measured pre- and post-task and for the variables measured on the four blocks of trials of the task. Patterns of trends over time were also examined and contrast analysis was used to evaluate differences in treatments. A least significant difference (LSD) t-test was used to compare means within a significant ANOVA. A repeated measured multivariate analysis of variance with a between-subjects model of sex and groups and a within-subjects model of event and time was used to analyse the heart period. A priori contrasts were selected.
Results
Breath alcohol concentration
No alcohol was detected on the placebo occasion. On the low dose occasions, concentrations ranged from 36.3mg/100ml 30 minutes after ingestion to 12.5mg/100ml at 90 minutes. The corresponding figures for the higher dose occasion were 99.9 and 79.1mg/100ml, respectively.
Guess concerning alcohol
The placebo and higher dose groups differed in their detection of alcohol but the difference between placebo and low-dose groups was not significant.
Competitive reaction time task
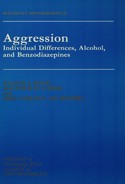
Level set – Trial 1 (pre-provocation). The dosage groups differed significantly on Trial 1 (F2,39 = 4.09; P < 0.03) (see Fig 5.1). The alcohol groups set higher levels, although this was confined to the higher dose in females.
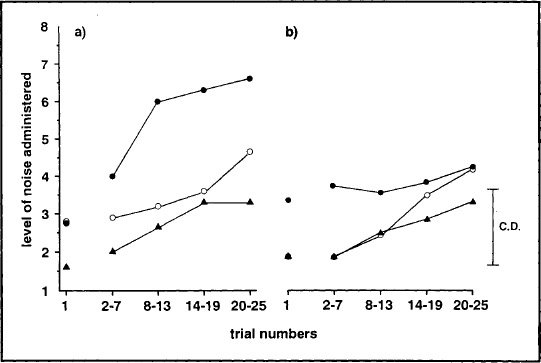
FIG. 5.1. Mean levels of noise administered by (a) male and (b) female subjects after a moderate dose of alcohol (![]() ), a low dose of alcohol (
), a low dose of alcohol (![]() ), and placebo (
), and placebo (![]() ). The 0.05 critical difference applies to the blocks of trials.
). The 0.05 critical difference applies to the blocks of trials.
Trial blocks 1–4. The noise levels increased with blocks of trials for all groups (F3,40 = 11.39; P < 0.001). The dosage groups differed significantly (F2,42 = 5.81; P < 0.006), the higher alcohol group in particular setting higher levels. However, differences were seen between the sexes, males increasing their settings more than females (F6,74 = 2.76; P < 0.02) (see Fig. 5.1).
Setting time. No significant differences between groups were found.
Reaction time. All subjects decreased their RT through the task (F3,40 = 6.37; P < 0.001). There was a significant difference between groups (F2,42 = 3.81; P < 0.03), subjects on the higher dose of alcohol were slightly slower and those on the low dose were slightly faster than subjects on placebo. The difference was therefore significant between doses (F1,42 = 7.65; P < 0.01).
Physiological measures
Skin conductance level and fluctuations
The skin conductance level (SCL) tended to increase throughout the experiment (increased arousal). The SCL also rose during each trial and this rise increased as the trials progressed (F3,40 = 4.76; P < 0.007). No intergroup differences were found. The number of fluctuations increased from pre-trial to the rest of the trial (F3,37 = 31.4; P < 0.001) and after the noise compared to no-noise (F3,37 = 16.3; P < 0.001) irrespective of group.
Heart period
Trial 1. The heart period (inter-beat interval) shortened from immediately before the start of the trial to subsequent points within the trial. After the subject set the level of noise, the heart temporarily slowed. There were no significant interactions with alcohol.
Trial blocks 1–4. The heart period shortened over time for all groups, i.e. the heart rate rose. During the trial the pattern was similar to that in Trial 1. The exception was the change from after the warning signal to after the response (RT), which showed an interaction with groups. The higher alcohol group showed a tachycardia, whereas the other two groups slowed down (F2,39 = 5.71; P < 0.007). All groups showed a shorter heart period after the noise.
Overall, placebo and alcohol groups showed differences. The alcohol groups had raised heart rates (F1,39 = 4.07; P < 0.05) and less change within trials (F2,39 = 4.5; P < 0.05) (see Fig. 5.2).
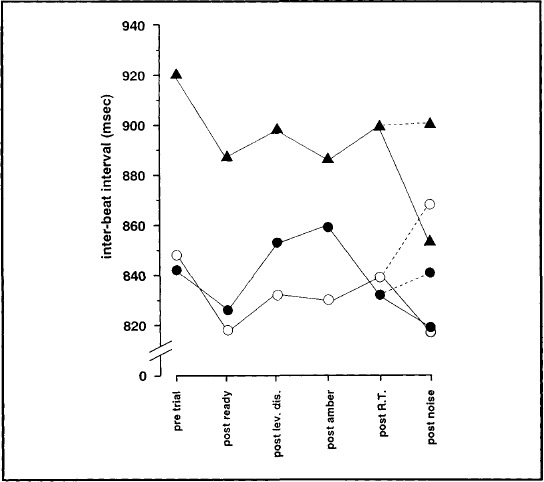
FIG. 5.2. The mean inter-beat interval of the heart rate pre-trial and after events within trial for trials 2–25 after a moderate dose of alcohol (![]() ), a low dose of alcohol (
), a low dose of alcohol (![]() ), and placebo (
), and placebo (![]() ). The dashed line ( - - - ) represents when no noise was administered.
). The dashed line ( - - - ) represents when no noise was administered.
Subjective rating scales
Drinking questionnaire
The groups did not differ with respect to drinking behaviour. Overall subjects drank once or twice a week or at weekends only and consumed three or four drinks on each occasion.
Mood rating scale
Factor 1: alertness. There was an overall difference between groups on this factor (F2,42 = 4.12; P < 0.03). The higher dose of alcohol made subjects feel generally drowsier. Most of the scale items on this factor also showed a significant time effect, the subjects finding the task "alerting", which was reflected in the factor score (F1,42 =17.80; P < 0.001). There was no interaction between groups and time.
Factor 2: contentment. Subjects in all groups became less contented after the task (F1,42 = 11.12; P < 0.01).
Factor 3: calmness. All groups became more calm and relaxed after the drink but this effect was reversed by the task (F1,42 = 95.27; P < 0.001). The three groups had similar pre-task values but the placebo group showed more change than the alcohol groups after the task (see Fig. 5.3a), becoming significantly more anxious (F2,42 = 3.32; P < 0.05).
Anger rating scale
Subjects in all groups became more angry and hostile after the task (F1,42 = 16.21; P < 0.001). Alcohol tended to attenuate this effect, e.g. furious–calm (F1,42 = 6.04; P < 0.02) (see Fig. 5.3b).
Spielberger State Anxiety Inventory
This showed a significant time effect, all subjects irrespective of group becoming more anxious after the task (F1,42 = 37.76; P < 0.001). The placebo group showed most anxiety.
DISCUSSION
The competitive reaction time task was run at a time when breath alcohol levels were maximal and beginning to decrease, as this is when adverse mood effects are most likely to occur (Myrsten, 1971). The placebo control double-blind was successful in that subjects in the placebo group believed that they had received a dose of alcohol indistinguishable from the low dose. However, subjects in the moderate dose group, with breath alcohol concentration averaging 0.1 per cent, did rate themselves as receiving more than either of the other two groups and presumably recognised the intoxicating effects of alcohol.
FIG. 5.3. Mean scores on (a) factor 3 of the mood rating scale and (b) VAS calm-furious pre-drink, post-drink, and post-task after a moderate dose of alcohol (![]() ), a low dose(
), a low dose(![]() ), or placebo (
), or placebo (![]() ).
).
Emotional and behavioural aggression was elicited by the competitive reaction time task in all groups. The measure of behavioural aggression was taken as the level of noise the subjects set for their opponent. Subjects in the higher alcohol group set this level higher to start with and continued to set significantly higher levels than the placebo group. The male and female subjects in the placebo and low dose groups behaved in a similar way However, in the moderate dose group, although both male and female subjects started off more aggressively, they then diverged. The males increased their settings steeply, whereas the females increased them very little. This difference was not reflected in any other measure but there is evidence that although women experience as much anger as men, they respond with less physical aggression (Frost & Averill, 1982; Gustafson, 1986).
The major physiological effect was an increase in activity as the trials proceeded. The heart period shortened as the noise settings rose. A specific pattern within each trial was discernable. Thus, the heart period shortened from the resting condition to events within trial and from these to the noise. Effects of a novel noise stimulus have been shown to be substantial (Turpin & Siddle, 1983) and the noise condition in this experiment kept the heart rate elevated compared to when no noise occurred. The heart period consistently lengthened at one point in the trial, while the subjects waited to see a light display of the noise they would receive at the end of the trial, should they "lose". This change was in the predicted direction for anticipation (Obrist, 1982) and was not altered by alcohol.
Nevertheless, distinct cardiac effects were induced by alcohol. It increased basal cardiac activity but suppressed reactivity to events within the trial. This supports the hypothesis that alcohol exerts a stress-response dampening effect on cardiac activity at the point of stress (Levenson et al., 1980). As not only cardiac responsivity to stress (Eves & Gruzelier, 1984; Light & Obrist, 1983) but also the stress-response dampening (SRD) effect of alcohol (Sher & Levenson, 1983) differs in individuals, these effects must have been strong to show up in a nonselected group. It is also possible that the CRT by inducing anger and aggression as well as anxiety created more stress than the previous tasks employed.
The only sex difference found on the physiological measures was that females had lower skin conductance levels than males, which replicates a previous finding (Bond & Lader, 1986). Electrodermal activity increased overall in a way similar to cardiac functioning, but the change within trial was more marked than that across trials. Subjects seeemed able to recover between trials with respect to skin conductance level, but then all groups showed a marked response to events within the trial and to increasing levels of noise. Alcohol did not show an SRD effect on electrodermal activity. A dissociation was therefore found between heart rate and electrodermal activity, but not in the direction predicted from Gray's (1975) theory (Fowles, 1980).
Mood was clearly altered by the competitive task. Subjects in all groups became more alert, less contented, and more anxious. Alcohol had some calming effect and also tended to lessen feelings of hostility. These effects are consistent with the tension-reducing hypothesis (Conger, 1956; Kraft, 1971), but this still does not account for the increased behavioural aggression induced by alcohol. Response disinhibition seems unlikely as the increase in behavioural aggression is linked to the increasing provocation of the "opponent". The SRD effect of alcohol may result from an influence on a cognitive process altering the evaluation of a level of threat (Levenson et al., 1980). Hull (1981) provides a model of self-awareness linked to this that states that "alcohol does not serve to reduce tension directly but rather serves to reduce cognisance of a potential source of tension". Alcohol would therefore be consumed to reduce self-awareness and the consumption would decrease the individual's responsiveness to situational norms of appropriate behaviour. Some support for Hull's theory comes from studies in which subjects who had consumed alcohol behaved more aggressively to opponents irrespective of behavioural contingencies (Cherek, Steinberg, & Manno, 1985; Gustafson, 1985; Zeichner & Pihl, 1979, 1980). The theory would also account for our finding of increased aggressive behaviour after alcohol even prior to any provocation and without the same levels of tension, anxiety, or anger felt by the placebo group. Another theory that has developed out of experimental work on alcohol and aggression (Taylor & Leonard, 1983) suggests that alcohol impairs attentional capacity so that attention is only directed to the most salient external cues. In this experiment the provocation of receiving increasing levels of noise would be the most salient contextual cue. Studies that have introduced cues leading to self-awareness have shown that alcohol-instigated aggression can be reduced (Bailey, Leonard, Cranston, & Taylor, 1983; Jeavons & Tayler, 1985).
SUMMARY
Alcohol in two doses (0.75g/kg and 0.25g/kg) and a placebo were administered to three matched groups of subjects. After one hour, the subjects took part in a competitive reaction time task during which they both experienced and had the opportunity to administer increasing noise levels. Cardiac and electrodermal activity were monitored throughout and subjects completed ratings of mood, anger, and anxiety pre- and post-drink and post-task. It was found that as the noise level they received increased, subjects in all groups displayed higher cardiac and electrodermal responsiveness. Alcohol increased behavioural aggression without a concomitant increase in any of the mood states measured, and showed a stress-response dampening effect on cardiac but not electrodermal activity.