Behavioural aggression in a clinical group
INTRODUCTION
This study was designed to assess physiological and psychological variables in patients with a history of aggression. Studies of biological correlates of aggression in psychiatric patients have been few, and most concentrate on extremely disturbed patients. In most of these experiments, aggression has been assessed through interviews and questionnaires. The data gathered from such studies are indirect, which hinders making reliable inferences.
One problem in dealing with clinical populations is multiple pathology. Thus, patients with a history of acts of aggression or complaints of hostile feelings tend also to suffer from other abnormal behaviour or affects including anxiety, depression, and obsessive-compulsive behaviour. Some, indeed, display psychotic features. In order to disentangle the aggressive aspects from the others, we used two comparator groups. The first was healthy normal subjects, i.e. individuals with neither aggressive nor any other psychiatric problems. The second was a control group of patients who had psychiatric abnormalities, mainly clinical anxiety and depression, but had no history of aggressive behaviour. We used the competitive reaction time paradigm as described in the previous chapter. It was hypothesised that the patients with a history of aggression would become more aggressive on provocation than the other two groups.
Methods
Subjects
Forty-eight subjects (42 males, 6 females) participated in the study, comprising three groups of 14 males and 2 females. All groups were matched by sex and age as closely as possible. Patients were also matched by primary diagnosis. One group of patients, the “forensic patients", had a history of physical aggression. Most of these were referred by the Forensic Psychiatry Department of the Maudsley Hospital. The remainder as well as the control patients were recruited through other Maudsley Hospital clinics. Subjects for the normal group were recruited from a local job centre. In the forensic group only one was an in-patient compared with two in the control patient group.
The psychiatric record of each patient was reviewed for diagnosis based on the “International Classification of Diseases, 9th Revision". The psychiatric diagnoses consisted of anxiety disorders (4 forensic, 4 controls), delusional disorders (2 forensics), mood disorders (9 forensic, 12 controls) and personality disorder (1 forensic). However, in reviewing the patients' clinical records, personality disorder was a second-level diagnosis in an additional 11 forensic patients. Two forensic patients had a history of drug abuse, one with marijuana and heroin, and another with marijuana; one had a history of alcohol abuse and three of benzodiazepine dependence. In the control group one patient had a history of benzodiazepine dependence and one had previously abused alcohol. Nine forensic and five control patients had attempted suicide or self-harm—four forensic patients had made suicide attempts more than once. At the time of testing and in the previous two weeks 7 patients in the forensic group were drug-free as compared with 3 in the control group. Six forensic patients were taking one single drug, whereas 3 were taking two drugs simultaneously. In the control group 11 patients were on treatment with one drug and 2 patients were taking two drugs at the same time (see Table 4.1). All normal subjects were drug-free.
Patients with a diagnosis of epilepsy, schizophrenia, or mental handicap were excluded, as well as those with a history of head injury.
Materials and procedures
The procedures were approved by the appropriate Ethical Committee of the Institute of Psychiatry and the Bethlem Royal and Maudsley Hospitals. All subjects were informed about the tests, both physiological and psychological, in a short interview and signed a consent form.
TABLE 4.1
Psychotropic drug frequencies
| Frequency | ||
| Forensic patients (n = 16) | Control patients (n = 16) | |
| Psychotropic drugs | ||
| Anti-anxiety (including sedatives and hypnotics) | 6 | 2 |
| Antidepressants | 1 | 9 |
| Antimanic | 1 | 2 |
| Antipsychotic | 2 | 2 |
| Drugs for movement disorders | 1 | - |
| Antihypertensives | 1 | - |
They attended the laboratory on one occasion, always in the afternoons at about 2 pm. Subjects were asked to avoid drinking alcohol on the night before and the day of testing. They were also asked to consume only a light meal immediately before the testing session. Those patients who were taking medication were requested not to change their treatments in any way.
The experimental session lasted for about 90 minutes and most tests were recorded using a computer. The testing conditions were kept as standard as possible.
The experimenter started each experimental session by interviewing the patient concerning demographic and diagnostic characteristics, followed by a set of questionnaires and subjective rating scales that the patient completed before the recording of the physiological variables was set up. At this stage contact with subjects was friendly but uninformative. Instructions about performing the tests were read in a systematic, controlled way. The sequence of tests is shown in Table 4.2.
Measures
Psychophysiological measures
The psychophysiological variables (EEG, AEP, SC level) were recorded, as described previously, during a simple reaction time task.
Competitive reaction time task
This measure of aggressive behaviour was carried out as described in the previous chapter. The heart period and skin conductance level were monitored during the task.
| Time 1: | Consent form Conviction questionnaire Questionnaire on drinking behaviour Mood rating scale Anger rating scale Spielberger State Anxiety Inventory Spielberger Trait Anxiety Inventory Spielberger State Anger Scale Spielberger Trait Anger Scale EEG AEP + skin conductance level + reaction time CRT—with continuous monitoring of heart rate and skin conductance level |
|
| Time 2: | Mood rating scale Anger rating scale Spielberger State Inventories EEG AEP + skin conductance level + reaction time Buss-Durkee Hostility Inventory |
|
| EEG = electroencephalogram; AEP = auditory evoked potential; CRT = competitive reaction time. | ||
Subjective rating scales
The Mood Rating Scale, Anger Rating Scale, and Spielberger State-Trait, Anxiety and Anger Inventories were completed at the beginning and at the end of the recording session. The Conviction Questionnaire, Drinking Questionnaire, and the Buss–Durkee Hostility Inventory were filled in once.
Analysis of data
Parametric statistics were used and included analysis of variance (uni-and multivariate) with repeated measures. Analysis of variance tested for overall differences between the groups and included an analysis to confirm the comparability of the groups. Trend analysis evaluated any task-related effects over time.
Because of the large amount of data, critical differences were used in most instances to indicate the dispersion in the data. Critical difference is the divisor in a between-means t-test and was calculated from the error variance in the overall analysis of variance (least significant difference test). The 0.05 critical difference is plotted on the graphs as a vertical bar, labelled C.D., and any means further apart than this are significantly different at the 0.05 level of probability at least.
Pearson product moment correlation coefficients were calculated between “trait” hostility and anxiety inventories and between these and the two measures of aggressive responses on the competitive reaction time task.
Results
Subjects
There were 16 subjects in each group: 14 males and 2 females and one subject in each group was nonwhite. The mean age (±SD) of forensic patients was 35.1 ± 12.0 years, range: 20–58. For the control patients the mean age was 40.7 ± 13.2 years, range: 21–63. The normal volunteer group had a mean age of 33.6 ± 11.4 years, range: 22–59. Patients were also matched for marital status, 11 living alone and 5 cohabiting in each group. With respect to education, all the forensic patients had left school by age 16, whereas half the control patients had some form of further education. Four of the forensic and 7 of the control patients were currently employed.
The healthy volunteers, recruited from a job centre, were all, of course, currently unemployed. Ten had left school by age 16, 15 were living alone and 6 were nonwhite. It was felt that this represented as feasible a match as possible with the two clinical samples.
Conviction questionnaire
The criminal profile of the groups was different (F2,45 = 18.51; P < 0.001). As would be expected, forensic patients were involved in more acts of violence to people and property (F1,45 = 7.63; P < 0.01), resulting in convictions.
Drinking questionnaire
The groups did not differ with respect to drinking. Group members drank three or four drinks on each occasion, on average once or twice a week. In the week before the test session each group consumed amounts similar to those in a usual week.
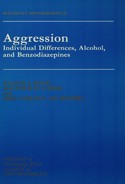
Buss-Durkee Hostility Inventory
The individual scales, the total score, and the motor aggression factor were analysed (see Table 4.3).
Assault. This scale reflects physical violence against others and getting into fights. In this dimension the groups were significantly different, forensic patients admitting to more assaultive behaviour.
Indirect hostility. This scale represents undirected hostility, such as temper tantrums, slamming doors, and throwing objects. No significant (P < 0.05) differences occurred between groups on this subscale but the forensic patients admitted to more indirect hostility than control patients.
TABLE 4.3
Buss-Durkee Hostility Inventory
Verbal hostility. This scale represents behaviour such as shouting, arguing, and insulting other people. There was a significant difference between groups but this was accounted for by the patients. Healthy volunteers showed as much verbal hostility as forensic patients.
Irritability. This scale involves feeling easily annoyed. In this case the difference between groups represented a difference between patients and normals. Both patient groups were more irritable.
Motor aggression factor. Not surprisingly, this factor formed from the first listed four scales showed significant differences between groups. The forensic patients scored higher than the other groups.
Suspicion. This scale reflects feelings that other people dislike you or are untrustworthy. There was a difference between groups. The forensic patients were more suspicious.
Negativism and Resentment showed no significant differences between groups, although forensic patients again had the highest scores (see Table 4.3).
Guilt. Both groups of patients recorded more feelings of guilt than the healthy subjects but this result only approached statistical significance.
Total score. The forensic patients obtained a much higher score than the other groups
Mood rating scale
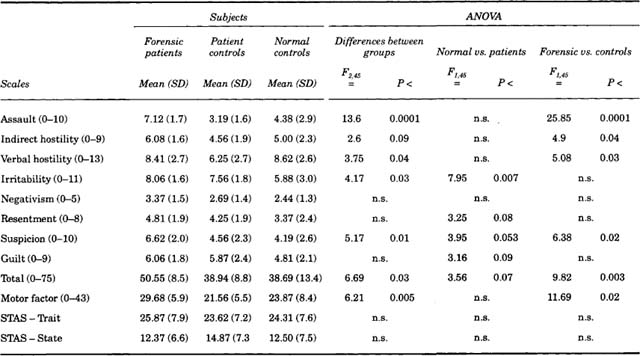
Factor 1: alertness. Eight of the nine scales loading on this factor showed significant differences, which were reflected in the factor score pre-task between the groups (F2,45 = 7.25; P < 0.002): normals were significantly more alert than patients (F1,45 = 12.87; P < 0.001) (see Fig. 4.1a). This difference between normals and patients (F1,45 = 11.92; P < 0.002) remained after the task.
Factor 2: contentment. This factor was significant between the groups both pre-task (F2,45 =10.06; P< 0.001) when the normals were more content and over the experiment (F2,45 = 10.79; P < 0.001). Although contentment increased over time in all groups, patients remained less contented than the normals at both time points (see Fig. 4.1b). There was no difference between the two patient groups.
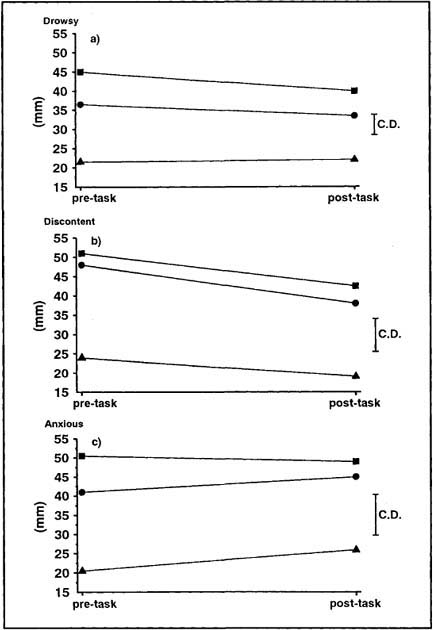
FIG. 4.1. Mean scores for the forensic patients (![]() ), control patients (
), control patients (![]() ), and healthy volunteers (
), and healthy volunteers (![]() ) on (a) Factor 1 (alertness), (b) Factor 2 (contentment), and (c) Factor 3 (calmness) of the mood rating scale before and after the CRT. The P < 0.05 C.D. is displayed.
) on (a) Factor 1 (alertness), (b) Factor 2 (contentment), and (c) Factor 3 (calmness) of the mood rating scale before and after the CRT. The P < 0.05 C.D. is displayed.
Factor 3: calmness. This factor was significant between groups and between normals and patients both pre-task (F2,45 = 9.0; P < 0.001) and overall (F1,45 = 16.21; P < 0.001) (see Fig. 4.1c). Patients were less calm than normals, as expected, but there were no differences between the two patient groups.
Anger rating scale
Most of the 13 items on this scale were significantly different pre-task between groups and between normals and patients. Thus, both groups of patients were more hostile, angry, quarrelsome, etc. than normals. An example of one scale is depicted in Fig. 4.2. Time effects tended to differ between groups. Pre-task, patients felt more quarrelsome than normals, but post-task forensic patients tended to stay quarrelsome in contrast to the other groups (F2,45 = 7.13; P < 0.01). Also in contrast to normals, both groups of patients became more resentful after the task (F1,45 = 5.87; P < 0.02). In general, patients tended to be more angry than normals (F1,45 = 17.88; P < 0.001), as shown on the mean scale score.
Spielberger State-Trait Anxiety Inventory

FIG. 4.2. Mean scores for the forensic patients (![]() ), control patients (
), control patients (![]() ), and healthy volunteers (
), and healthy volunteers (![]() ) on VAS affable–quarrelsome from the ARS before and after the CRT.
) on VAS affable–quarrelsome from the ARS before and after the CRT.
On the STAI-Trait the groups differed significantly (F2,45 =14.71; P < 0.001), the two groups of patients being more anxious than the normals (F1,45 = 26.82; P < 0.001) (see Fig. 4.3). The STAI-State showed significant differences pre-task between groups (F2,45= 14.21; P < 0.001), between normals and patients (F1,45 = 22.07; P < 0.001), and between forensic and control patients (F1,45 = 6.35; P < 0.02). Also the groups were significantly different overall (F2,45 = 10.98; P < 0.001), as were normals compared with patients (F1,45 = 18.94; P < 0.001). There were significant time effects within subject groups (F1,45 = 9.81; P < 0.01): all subjects became slightly less anxious after the task.
Spielberger State-Trait Anger Scale
These scales failed to show any difference between groups either pre- or post-task. The pre-task means are shown in Table 4.3.
Physiological measures during simple reaction time task
EEG wavebands
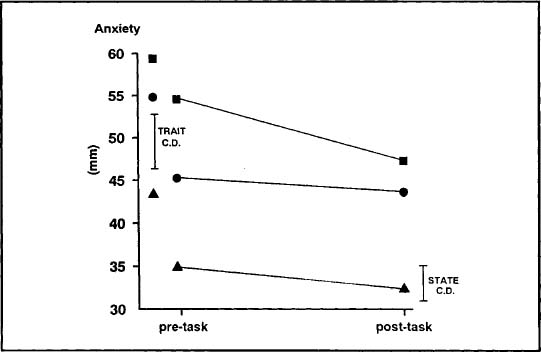
FIG. 4.3. Mean scores on the STAI-Trait (left) pre-testing and STAI-State before and after the CRT for the forensic patients (![]() ), control patients (
), control patients (![]() ), and healthy volunteers (
), and healthy volunteers (![]() ).
).
The data were similar across all four wavebands. The power in the wavebands was significantly greater for the two patient groups than for the normal subjects (pre-task total power: F1,44 = 6.8; P < 0.02) and this difference was maintained after the CRT (total power: F1,44 = 7.17; P < 0.01). All groups dropped somewhat from pre-task to post-task (F1,44 = 8.07; P < 0.01) but these changes tended to be greater in the patient groups.
Auditory evoked potentials
Significant inter-group differences were found for the P2 and N2 latencies: the forensic group had shorter latencies than the control patients pre- but not post-task (F1,45 = 5.91; P < 0.02). No inter-group differences were found for the P1 and N1 latencies, nor for any of the evoked potential amplitudes.
Skin conductance level
The mean level did not differ between groups pre-task. However, the level dropped in the normal group but rose in the two patient groups, pre- to post-task, the interaction being significant (F1,45 = 7.01; P < 0.02).
Auditory reaction time
This speeded up from pre- to post-task, particularly in the normals (F1,45 = 4.4; P < 0.05).
Competitive reaction time task
Level set – Trial 1 (pre-provocation). On the first trial, differences between groups on level set were not significant.
Trial blocks 1–3 (increasing provocation). All subjects increased the level of noise set for their opponents through the task (F2,44 = 4.6; P < 0.02) with a linear trend (F1,45 = 8.99; P < 0.01) (see Fig. 4.4a). A significant difference was found between groups (F2,45 = 3.24; P < 0.05), and between forensic and control patients (F1,45 = 5.99; P < 0.02).
Duration set. The duration of noise delivered to the opponent failed to show a significant difference between groups. However, the forensic patients tended to set longer noises overall.
Setting time. No difference between groups was found on Trial 1. The time taken by all subjects to set the noise level decreased significantly through the blocks (F2,44 = 4.55; P < 0.02), with the forensic patients becoming quicker than control patients (F2,44 = 3.53; P < 0.04).
Reaction time. No significant difference between groups on reaction time over all trials was found (see Fig. 4.4b). However, reaction times decreased over trials, particularly for forensic patients (F2,44 = 15.27; P < 0.001).
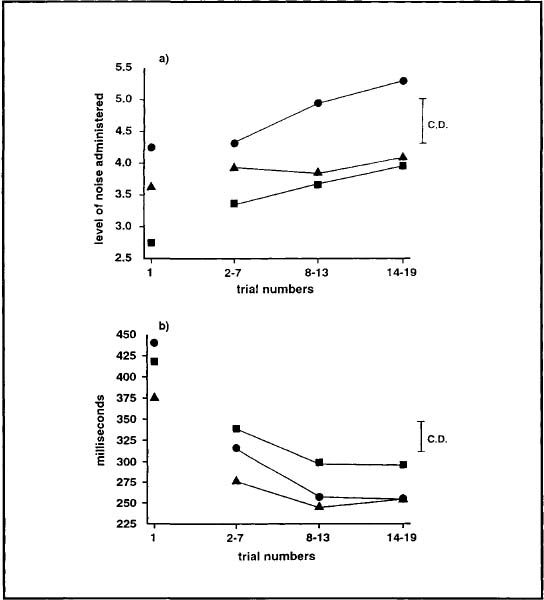
FIG. 4.4. Mean (a) levels of noise administered by the forensic (![]() ), control (
), control (![]() ), and healthy (
), and healthy (![]() ) group to their opponent and (b) reaction time during each block of trials of the CRT.
) group to their opponent and (b) reaction time during each block of trials of the CRT.
Skin conductance and heart period
These two variables were measured throughout the competitive reaction time task, pre-trial, post-ready button pressed, etc. However, skin conductance showed no significant results.
Heart period. Trial 1. The inter-beat interval (IBI) was measured at 6 points within the first trial (see Table 3.3). The mean heart period was different between normals and patients overall (F1,44 = 3.73; P < 0.06) (see Fig. 4.5). The normals had a longer heart period (i.e. slower heart rate). There was a significant difference between conditions within the trial (F5,40 = 8.1; P < 0.001), across groups, and a significant condition versus patients effect (see Table 4.4). The heart period had similarities between groups from the pre-trial to the middle of the block, but from post-amber light point (the warning signal) to the reaction time itself the pattern differed: The forensic patients shortened their heart period in a similar way to the normals but the control patients showed no change.

FIG. 4.5. The mean inter-beat interval of the heart rate pre-trial and after events within trial over successive blocks of trials for the forensic (![]() ), control (
), control (![]() ), and healthy (
), and healthy (![]() ) groups. The individual points on each trial block represent pre-trial, post-ready, post-level displayed, post-amber light, post-RT and post-noise. The dotted line (....) represents when no noise was administered.
) groups. The individual points on each trial block represent pre-trial, post-ready, post-level displayed, post-amber light, post-RT and post-noise. The dotted line (....) represents when no noise was administered.
TABLE 4.4
Multivariate analyses of variance of heart period between events within trial between groups

Trial blocks 1–3. From trials 2 to 19 the heart period was examined over an additional event: post-win button (i.e. the duration of time subjects selected to deliver the noise to their opponent). The mean heart period did not change through the experiment but the significant difference between groups remained (F2,44 = 4.2; P < 0.03): The normals had a longer heart period than patients (F1,44 = 7.83; P < 0.01). There were significant effects (see Table 4.4) between conditions (F6,39 = 10.62; P < 0.001) and between conditions versus groups across the experiment (F12,78 = 2.43; P < 0.01) (see Fig. 4.5). There was a significant difference between pre-trial heart period and the rest of the trial: Normals showed more change than patients (F1,44 = 10.55; P < 0.002). During trial events the control patients showed less change than on Trial 1, whereas the forensic patients were more like the normals. The forensic patients showed a lengthening in their heart period as the noise increased and a shortening when no noise occurred, whereas the control patients showed the opposite tendency.
Correlations between Trait Inventories
The total score of the Buss–Durkee Inventory correlated significantly with the Spielberger Trait Anger Scale (r = 0.49; P < 0.001). The subtotal of the four aggression scales, termed the motor component by Buss and Durkee (1957), also correlated significantly with the Trait Anger Scale (r = 0.53; P < 0.001). Both the total score of the Buss–Durkee and the Trait Anger Scale correlated with the Spielberger Trait Anxiety Inventory (r = 0.30; P < 0.05 and r = 0.39; P < 0.01, respectively).
Correlations between Trait Inventories and CRT behavioural aggression measures
The total score of the Buss–Durkee Hostility Inventory correlated significantly with the mean level of noise administered during the competitive reaction time task (r = 0.43; P < 0.01). The motor aggression factor and the individual Assault Scale also correlated with the level of noise administered (r = 0.32; P < 0.05; r = 0.40; P < 0.01, respectively). The Trait Anger Scale did not correlate significantly with this measure and neither questionnaire correlated significantly with the length of time for which the subjects administered the noise. The level of the noise set and the duration it was set for correlated weakly (r = 0.25; P < 0.10).
DISCUSSION
The main hypothesis was confirmed. The patients with a history of aggression responded with more behavioural aggression to provocation on the CRT than either the control patients or normal volunteers. We attempted to control as many individual variables as possible by matching the groups on demographic features so they had similar social status, and the three groups did not differ on drinking history nor on recent alcohol intake. However, there were differences in years of schooling. None of the forensic patients had any further education after the statutary school leaving age of 16. This may have been due to behavioural problems or interpersonal difficulties at school rather than intellectual ability. Nevertheless, we cannot rule out lower cognitive functioning as a contributory factor in their aggressive behaviour.
We attempted to match the two patient groups on primary diagnosis. However, far more of the forensic group had a second-level diagnosis of personality disorder. This is the most common diagnosis in patients displaying aggressive behaviour, but as pointed out in Chapter 1, the definition of antisocial personality disorder is circular in that a type of behaviour is used to define a disorder of personality. Therefore, the forensic patient's history of aggression would result in the diagnosis. Many authors have suggested that it is more helpful to look at dimensional measures (Kendell, 1982; Millon, 1981; van Praag et al., 1990) and so we used a range of these.
As might be expected, the patient groups differed from the healthy group on trait anxiety: Both showed levels of clinical anxiety (Spielberger et al., 1970) comparable to patients with anxiety disorders (Bruce & Lader, 1991). It has often been assumed that the relationship between anxiety and aggression is negative and that anxiety inhibits aggressive behaviour. However, a study that looked at the contribution of fear and anger to violence in forensic patients with delusional (paranoid) disorder found that all patients were rated positive on these two emotions both before and at the time of the offence (Kennedy, Kemp, & Dyer, 1992). The ratings were completed by both the patients and informants, and whereas patients more commonly described fears, informants described outbursts of anger. These patients then saw the world as a very threatening place and were responding to this. A group of violent offenders who rate highly on measures of anxiety and social inhibition has also been identified by Blackburn (1993). Anxiety may therefore represent a contributory factor to our patients' aggression. A similar pattern of anxiety was shown on the STAI-State, both patient groups showing significantly more anxiety than the healthy group. On this measure of current anxiety the control patients were significantly more anxious than the forensic group at initial testing but this diminished after the task, although both patient groups were still more anxious than normal controls.
There were major differences between groups on the questionnaire measures of aggression. Although not all the forensic patients had convictions, as a group they were more likely to have been involved in or convicted for acts of violence to people or property. This history was confirmed by their self-reports on the BDHI. The forensic patients admitted to exhibiting more physical violence, suspicion, and more aggression generally than the other groups who had similar scores to the original norms (Buss & Durkee, 1957). This confirms previous reports that have found prisoners convicted of violent crimes to score higher on the BDHI than those convicted of other crimes (Ehrenkranz, Bliss, & Sheard, 1974; Lothstein & Jones, 1978) and men who have committed domestic violence to score higher than nonviolent controls but no higher than generally violent men (Maiuro, Cahn, & Vitiliano, 1986; Maiuro, Cahn, Vitiliano, Wagner, & Zegree, 1988). This adds to the evidence for the concurrent validity of the BDHI. The forensic patients also differed from control patients on verbal hostility but not from the healthy volunteers. We do not know if this result would be replicated with another healthy group or if it was a characteristic of our healthy volunteer sample who were at the extreme on this dimension. Both groups of patients showed increased irritability relative to the healthy group. This does not support the postulation that irritability is related to overt aggressive acts, but the result may have been confounded by acts of attempted suicide or self-harm in both patient groups, irritability being related to aggression directed both outward and inward. Irritability may also be related to negative mood. There were no differences between groups on the anger scales, although there was a relationship between anger and both aggression and anxiety.
The patient groups were generally similar on current mood. They reported only average levels of alertness, contentment, calmness, and peacefulness on the visual analogue scales compared to healthy volunteers. This fits in with Beck's theory of negative self-evaluation by psychiatric patients (Beck, 1967) or indeed positive self-evaluation by normal subjects. The patients did not report extreme dysphoria, probably because they were receiving treatment. The differences in current mood between patients and healthy volunteers were maintained after the task but all subjects became more alert and excited, the forensic patients showing most change. All subjects also rated themselves as generally more contented and less hostile after the task. This may have been due to relief at the end of an aversive event (Mowrer, 1960). The changes on hostility were small and the forensic group showed no change, thus responding aggressively was not cathartic as would be predicted by frustration–aggression theory (Miller, 1941).
The patient groups also differed from the healthy volunteers on background psychophysiological measures. They exhibited higher power in all wavebands of the EEG pre-task. The fact that the patient groups were similar means this result is unlikely to be linked to aggression per se. A previous study has also shown higher cortical arousal in patients with anxiety disorders (Bond, James, & Lader, 1974) and so this finding may be linked to the high levels of trait anxiety shown by all the patients. Some work has linked antisocial, criminal behaviour to underarousal on both central and peripheral psychophysiological measures (Raine, Venables, & Williams, 1990). Although this work examined serious offending such as recorded in the Criminal Records Office, it was not confined to aggressive acts and this may be one reason why conflicting results have been obtained (Mednick, Pollock, Volavka, & Gabrielli, 1982). Blackburn (1993) has identified two separate groups of violent offenders, one with high anxiety and one without, and so our patients may be similar to the former group. Their aggressive behaviour may be due to their perception of the world as a threatening place and their impulsive response to perceived provocation. Studies of social expectations have confirmed this. The secondary psychopathic group identified by Blackburn (1993) expected other people to challenge them, i.e. to argue, wind you up, be sarcastic, and not to be friendly or attentive. There was a tendency for slow-wave activity to decrease and fast-wave activity to increase post-task and these changes were most apparent in the patient groups on fast-wave activity, increasing their differences from normal. This may indicate more psychophysiological response to a stressful situation in people with psychological problems than is shown in healthy controls. Some confirmation of this interpretation is given by the skin conductance level results. The control patients showed slightly lower levels pre-task but both patient groups increased their levels post-task, whereas the normal subjects decreased, i.e. became more relaxed. The increased arousal of the patient groups may also have interfered with simple reaction time performance. There were no differences between groups pre-task but the normal controls improved their performance more and were therefore significantly faster than the control patients post-task.
Our major behavioural measure of aggression was the volume of noise the subjects set for their “opponent”. The forensic patients set higher levels of noise throughout the task but this was not significant before provocation was introduced. With increasing levels of provocation, all subjects tended to increase the volume of noise they set but this was significantly greater for the forensic group. The forensic group also administered longer periods of noise to their opponent but this measure did not reach statistical significance. Although the duration of noise administered might be considered a more direct form of aggressive behaviour, it did not involve provocation in this experiment as the durations of noise administered to the subjects varied randomly and did not increase. The fact that patients with a history of aggression respond more aggressively on the CRT task gives external validity to the task. The CRT is able to identify subjects who are likely to respond aggressively to perceived provocation in the world outside the laboratory. The time taken to choose a level of noise to be administered to the opponent decreased through the task for all subjects. The healthy group were fastest but both the forensic and the healthy groups were more decisive than the control patients.
Heart period and skin conductance level were monitored throughout the task. The heart period was consistently shorter in the patient groups, confirming the increased arousal shown on the other psychophysiological measures. The healthy subjects also showed greater recovery between trials, i.e. their heart rate returned to its resting level before each trial, whereas the patient groups showed no recovery. Within trial the forensic group showed similar changes to the healthy subjects, whereas the control patients were less reactive to events. Both normal and forensic groups showed an increase in heart period in response to hearing the noise and a decrease when they administered it to their opponent, whereas the control patients tended to show the opposite. Any differences therefore do not seem to be due to aggression, although there was an indication that the forensic group were more reactive within trial as well as showing less recovery between trials.
The major finding in this experiment is that forensic patients behave more aggressively on a laboratory task of aggression, the CRT. We also found a correlation between self-reported aggressive behaviour on the BDHI and behavioural aggression on the task. Thus, there was a relationship between a history of aggressive acts, a trait of aggressiveness, and behaviour on a laboratory task. This gives external validity to this laboratory task, which can induce aggressive behaviour in a similar way to that found previously by other authors using shocks (Taylor, 1967). It should therefore be a good method of measuring aggression induced by drugs.
SUMMARY
Sixteen patients with a history of aggression, 16 control patients and 16 healthy volunteers, all matched for demographic features, took part in the study. They competed on a competitive reaction time task and filled in self-ratings both before and after the task. Some psychophysiological measures were recorded before and after the task and cardiac and electrodermal activity were monitored during it. Both groups of patients differed from healthy subjects on self-ratings of mood and background psychophysiology. They rated themselves as less alert and more discontent, anxious, and irritable, and they showed higher voltage levels on the EEG. The patient groups diverged on the measures of aggression. The forensic patients showed more behavioural aggression on the task than both the other groups, especially at high levels of provocation. They also rated themselves as more aggressive on the BDHI and these two measures correlated. The CRT therefore proved to be a valid measure of aggression.