 Chapter 13
Isolating the Effects
of the Program
Bruce C. Aaron
In This Chapter
This chapter explores techniques that can be used to isolate the effects of programs from the effects of other factors when evaluating business performance measures. Upon completion of this chapter, you will be able to
- explain the importance of isolating the unique contribution of a program to business outcomes
- identify techniques available to isolate the effects of a program
- select the appropriate isolation technique for any situation and level of evaluation.
The Importance of Isolating the Effect of a Program
Two particularly important challenges face consultants conducting training evaluations: collecting accurate data to describe program effects and isolating the effects of the program. Isolating program effects is a critical component of measurement and evaluation and is essential for ensuring credibility because factors other than the program can influence business results (see figure 13-1).
Figure 13-1. The Importance of Isolating Program Effects
Bill was excited. He was presenting for the first time to the new CEO. She had been running the company for a year now and had begun several initiatives that had an effect on programs in the human resources department. One of these had led to the establishment of the Leadership Institute, which Bill had designed and developed. Now Bill was meeting with her to present his first report on the impact of the Institute. Bill presented data showing significant increases in several important metrics, such as employees’ satisfaction with work, supervisors’ job satisfaction ratings, and increased production. Then he summarized by indicating how successful the Leadership Institute had been to date. The CEO, however, reminded Bill of several other initiatives, such as the new performance management system, the improved employee benefits package, and the organizational realignment she had led. “How do you know what effect the Leadership Institute has had on the results you’re showing here, apart from the impact of these other initiatives?” she asked. Bill’s stomach churned a bit as he began to respond; he didn’t have a credible answer to the question. The CEO was about to realize the same thing.
In organizations, programs are implemented within complex systems of people, processes, and events. The only way to know the connection between a particular program or project and measured business impact is to deliberately isolate the effects of the program on the specific business outcomes of interest. This ensures that the data analysis allocates to the program only that part of the performance improvement that is connected to the program. Without this important step, the conclusions of the study will lack credibility because other important influences might affect results as the program is conducted. Many other factors (job redesign, incentives, rewards, compensation, technology, operational systems, and other internal processes) can influence improvement in business results. Similarly, factors external to the department or function area, or to the organization, can influence performance. Giving full credit for performance results to a single program without accounting for other factors that clearly have a similar potential effect on results is questionable. Credible evaluation requires an effort to ensure that only the results that are directly attributable to the program should be reported to stakeholders.
Fortunately, a variety of techniques can be used to isolate the effects of the program from other influences. These include using control groups, trend and forecast analyses, and using expert input from a various sources. Each technique has different advantages and drawbacks, and the choice of which to apply depends on the situation.
 Practitioner Tip
Identify the isolation technique during evaluation planning. This allows the best technique to be identified for the specific context, and to associate this important part of the evaluation plan with key stakeholders.
Techniques for Isolating the Effects of a Program
Table 13-1 shows a list of these techniques.
These approaches can reasonably be condensed into a smaller number of manageable categories: control groups, trend and forecast analysis, and estimates. Exploring these in greater technical detail and with statistical sophistication, however, is beyond the scope of this chapter.
Chain of Impact: The Initial Evidence
Before presenting the techniques, examine the “chain of impact” implied in the different levels of evaluation (see figure 13-2). The chain of impact must be in place for the program to drive business results. It models the results and the process by which we intend to achieve those results. Isolation of program effects, although not itself a link in this chain, must be applied to the business results data to determine the change that can be attributed uniquely to the program.
The chain of impact assumes that measurable business impact achieved from a training program should be derived from applying skills and knowledge on the job over a specified time after one completes the program (training programs serve as a common example; other types of programs might result in slightly different models). Logically, then, successfully applying program material on the job should stem from new knowledge, skills, and/or attitudes learned in the program, which are measured at Level 2. Therefore, for business results to improve (Level 4), this chain of impact implies that measurable on-the-job applications are realized (Level 3) when new knowledge and skills are learned (Level 2).
Table 13-1. Techniques for Isolating the Efffects of Programs and Projects
• Control group arrangement
• Trend line analysis of performance data
• Forecasting performance data
• Participant’s estimate of impact
• Supervisor’s estimate of impact
• Management’s estimate of impact
• Estimates based on expert opinion or previous studies
• Calculation or estimation of the impact of factors other than the program
• Customer estimate of impact

Attributing business impact to the program is difficult without evidence of the chain of impact. Concluding that the program caused any performance improvements is illogical if there is no learning or application of the material on the job. Literature and practice support this approach of modeling a chain of impact based on the different levels of evaluation (Alliger and Janak, 1989). A practical requirement, therefore, is to collect data across all levels of evaluation when conducting an ROI evaluation. Data must be collected at lower levels when a higher-level evaluation is conducted.
Despite its importance, the chain of impact does not prove a direct connection between the program and business impact. Isolation is necessary to make this direct connection and determine the amount of improvement attributable to the program.
Using Control Groups
The classic approach to isolate the impact of a program is using control groups in an experimental research design (Wang, 2002). This approach involves using an experimental group that participates and a control group that does not. Compose both groups as similarly as possible and, if feasible, randomly select participants for each experimental or control group. When this is possible, both groups are subjected to the same environmental influences, with the program itself as the difference in the performance of the two groups. Differences in outcomes can be then be attributed to the program, because it remains as the only systematic influence that explains observed differences in performance between the groups—the magnitude of the effect on business results indicates the unique contribution of the program. The basic control group design is presented here, but variations of the design are relevant to different situations and various threats to validity. These topics are addressed in more detail in Isolation of Results: Defining the Impact of the Program (Phillips and Aaron, 2008).
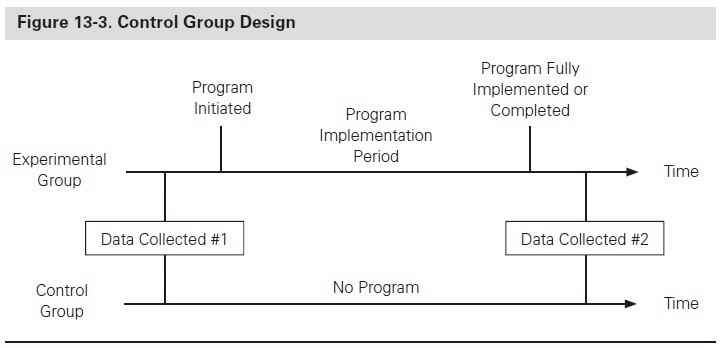
Basic control group design. The basic control group design has an experimental group and a control group, as illustrated in figure 13-3. The experimental group participates in the program, whereas the control group does not. Data are gathered on both groups before and after the program. The results for the experimental group, when compared to the control group, reveal the impact of the program.
There should be no significant differences between groups in characteristics that can influence the final outcome data, independent of the outcome of the program. The participants in each group should be at approximately the same job level, experience, ability, working conditions, and possibly even location.
Practically speaking, control group designs often are not feasible in organizational settings; one must explore other approaches of isolating the effects of the program on performance. Organizations face tradeoffs between research principles and feasibility: higher costs are often associated with measurement and evaluation, and the very nature of a control group assumes that some will receive the potential benefits and others will not. A control group evaluation design also implies a longer evaluation timeline. Consider the following questions to determine if a control group is the best isolation technique for your program:
- Is the population large enough to divide into groups?
- Is the population homogeneous—representing similar jobs and similar environments?
- What is the particular measure that matters to the organization?
- What variables may be affecting the measure? These variables are used to select the comparison groups for the control group arrangement.
- Using the Pareto Principle, which of the variables most strongly influences the output measure(s)?
- Can the program be withheld from a particular group? Sometimes, this occurs naturally because it might take a long time to roll out a program. Employees who receive the program last may be as many as three to six months behind those who participate in the program first, creating an opportunity to compare the last group with the first group.
- Is a pilot offering planned, and could the pilot group be matched with other groups for comparison?
Several rules are helpful when a control group arrangement is feasible:
- Keep the groups separated by different locations, different buildings, different shifts, or different floors.
- Minimize communication between the groups.
- If possible, do not let the control or experimental group know that they are part of an experiment and being compared with others.
- Monitor data on a short-term basis to check for improvements in both groups.
- Watch out for the Hawthorne effect (a change in behavior caused not by the program but by the special attention of the study itself) from the experimental group. Attend to the group as required by the program design, but try to minimize other interactions.
- Do not create expectations beyond the norm that may influence the results (for example, do not tell people that they are a special group and top performance is expected).
Because control groups are a powerful and credible method for isolating the impact of an intervention, consider using one to determine whether the support and opportunity are available to allow their use in evaluating important programs.
Using Trend Lines and Forecasts
When a control group analysis is not feasible for isolating the impact of a program, the next logical choices are two specific, closely related techniques. The first is trend line analysis, a simple process of forecasting the measure in question using preprogram data. The second method, the forecast technique, is more general and can be used when other influences have entered the process. A mathematical relationship or model is developed so that the data can be forecasted, not just projected on a trend line.
Trend line analysis. With this approach a trend line is drawn, using previous performance on the outcome measure as a baseline, extended into the future. When the program is conducted, actual performance is compared with the projected value shown by the trend line. Any improvement in performance over that predicted by the trend line can then be reasonably attributed to the program, if two conditions are met:
- The trend established prior to the program would be expected to continue in the absence of the program. The process owner(s) should be able to provide input to reach this conclusion. If the answer is no (indicating other factors would affect the outcome trend), the trend line analysis should not be used. If the answer is yes, the second condition must be met.
- No other new variables or influences entered the process after the program was conducted (that is, no additional influences entered the process beyond the program). If the answer is yes, another method must be used. If the answer is no, the trend line analysis will develop a reasonable and credible estimate of the impact of the program.
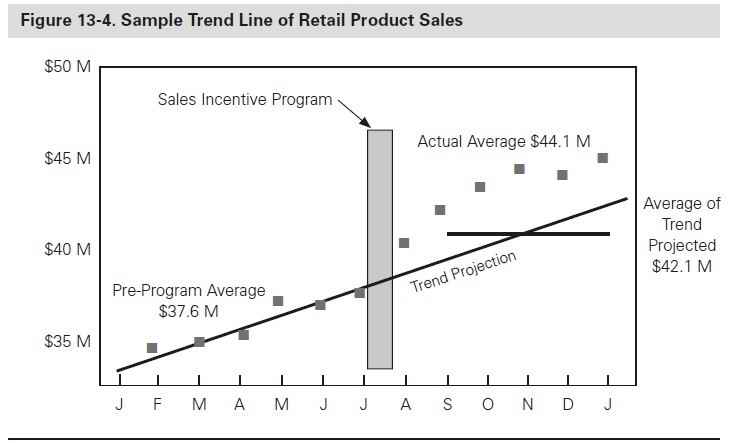
Figure 13-4 shows an example of this trend line analysis taken from sales revenue in a retail store chain. The vertical axis reflects the level of sales in millions. Data are shown before and after a sales incentive program was introduced in July. As shown in the figure, there was an upward trend in the data prior to implementing the incentive program. Although the program had a dramatic effect on sales, the trend line shows that improvement would have continued anyway, based on the previously established trend. The temptation is to measure the improvement by comparing the average six months of sales prior to the program ($37.6 million) to the average of six months after the program ($44.1 million) yielding a $6.5 million difference. However, a more accurate comparison is the six-month average after the program compared to the trend line average ($42.1 million). In this example, the difference is $2 million. Using this more conservative measure increases the accuracy and credibility of the isolation process. In this case, the two conditions outlined above were met (yes on the first; no on the second).
Preprogram data must be available before this technique can be used, and the data should have some reasonable degree of stability. If the variability in the data is high, the stability of the trend line becomes an issue. If the stability of the data cannot be assessed from a direct plot, use more detailed statistical analyses to determine if the data are stable enough to make the projection (Salkind, 2000). A trend line can be projected with a simple analytical function available in many calculators and software packages, such as Microsoft Excel. The primary advantage of this approach is that it is simple and inexpensive. If historical data are available, draw a trend line and estimate the differences. Although not exact, it does provide a quick assessment of a program’s potential impact.
Using trend line analysis can be straightforward and credible. To use trend lines effectively, a yes answer is necessary for these four questions:
- Are historical data available for the measure at hand?
- Are at least six data points available?
- Do the historical data appear to be stable when they are plotted over time?
- Is it anticipated that there will be no other influences, factors, or processes implemented at the same time of the program?
Forecasts. A more analytical approach to trend line analysis is using forecasting methods that predict a change in performance variables. This approach is a mathematical variation of trend line analysis in which other variables are accounted for at the time a program is implemented. The actual performance of the outcome measure is compared with a forecasted value of that measure. The forecasted value is derived by taking the additional influence into account. A linear model, in the form of y = ax + b, is appropriate when only one other variable influences the output performance and that relationship is characterized by a straight line. Instead of drawing the straight line, a linear equation is developed, which calculates a value of the anticipated performance improvement. Figure 13-5 provides an example of how this technique works.
Figure 13-5. Example of the Application of Forecasting Methods
A large retail store chain with a strong sales culture implemented a sales training program for sales associates. Applying the new skills should increase the sales volume for each associate. An important measure of the program’s success was the sales per employee, collected six months after the program and compared with the same measure prior to the program. The average daily sales per employee prior to training, using a one-month average, were $1,100 (rounded to the nearest $100). Six months after the program, the average daily sales per employee were $1,500.
After reviewing potential influencing factors with several store executives, only one factor—the level of advertising—appeared to have changed significantly during the period under consideration. The advertising staff had developed a mathematical relationship between advertising and sales. Using the historical values, a simple linear model yielded the following relationship: y = 140 + 40x, where y is the daily sales per employee and x is the level of advertising expenditures per week (divided by 1,000). This least squares function used to derive this equation is a routine option on some calculators and is included in many software packages. The level of weekly average advertising expenditures in the month preceding the program was $24,000, and the level of expenditures during the six months after the program was $30,000. Assuming that the other factors that might influence sales were insignificant, store executives determined the impact of the advertising by plugging in the new advertising expenditure amount (30) for x and calculating the average daily sales, which yielded $1,340. Therefore, the new sales level caused by the increase in advertising was $1,340. Because the new actual sales value was $1,500, then $160 ($1,500 – $1,340) could be attributed to the program.
A challenge with this predictive approach is presented if additional influences need to be accounted for, which requires more sophisticated statistical techniques and software for multiple variable analyses. Even then, a good fit of the data to the model may not be possible.
The primary advantage of this process is that it can predict business performance measures without the program, if appropriate data and models are available. Using more complex models can be a helpful option for practitioners familiar with the assumptions and requirements of general linear model techniques. Presenting more complex specific methods is beyond the scope of this chapter and is contained in other publications (Armstrong, 2001). However, you do not need complex approaches to unearth the value of using straightforward approaches described here.
Using Estimates
If the previously discussed techniques are not feasible, consider using estimates to isolate program effects. Estimates are by nature subjective and should be considered only after the other approaches have been exhausted, but they can provide powerful and credible evidence connecting the program to the observed business results. In businesses and other organizations with dynamic environments and time constraints, decisions will be made with the best available data. Ultimately, these decisions will be more subjective, not less, to the extent that all reasonable and credible data are not brought to bear.
Essentially, this approach involves using estimates from a variety of experts, with the participants of the programs often being the most credible source. Take a conservative approach to estimation with some accounting for the error or reliability of the estimates. Obtain estimates from participants, their managers, or sometimes, senior managers.
Participant, manager, and senior manager estimates. The effectiveness of this approach assumes that the sources of data can be used to determine or estimate how much of a performance improvement is related to the program. When using this technique, assume that the program is focused on improving performance, that one or more business measures have been identified prior to program implementation and have shown improvement, and that there is a need to link the program to the specific amount of performance improvement to determine the monetary impact of the improvement. This information can be gathered using a focus group, an interview, or a questionnaire. Detailed guidelines for collecting estimate data using each of these approaches can be found in other sources (Phillips and Aaron, 2008).
However, the process has some disadvantages. As an estimate, it lacks the objective accuracy desired by some professionals. Also, the input data may be unreliable from participants who are incapable of providing these types of estimates, either because they might not be aware of exactly which factors contributed to the results, or because they may be reluctant to provide data. If the questions come as a surprise, the data will be scarce.
Several advantages make this technique attractive. It is a simple process, easily understood by most participants and by others who review evaluation data. It is inexpensive, takes little time and analysis, making the results an efficient addition to the evaluation process. Participant estimates originate from a credible source—the individuals who actually produced the improvement. Sometimes, the participants’ immediate manager may be the more credible source. When this is the case, this is the ideal source. Periodically, senior managers are the ideal source. In any case, the process to develop the estimates is easy. The relative ease with which these data can be collected, however, should not entice evaluators into an overreliance on this approach; always consider more rigorous approaches (such as controlled research designs, trend and forecast analyses) first. If time and resources permit, estimates can be a corroborating and enlightening source of data even when other methods are also feasible.
The advantages of estimating offset the disadvantages in cases where the more rigorous research designs discussed previously cannot be used. As with the very act of measurement, isolating the effects of a program will never be completely precise and error free, and estimates can be sufficiently accurate for clients and management groups. These key audiences tend to readily accept the approach. Living in an ambiguous world, they understand that estimates have to be made and often are the only way to approach an issue. They understand the challenge and appreciate the conservative approach to estimation, often commenting that the actual value is probably greater than the value presented. This process is particularly appropriate when the participants are managers, supervisors, team leaders, sales associates, engineers, and other professional and technical employees.
The steps to estimating the contribution of a program include
- identifying the factors that contribute to improving a business measure
- estimating the contribution of the improvement specifically due to the program under evaluation given the variety of factors (typically reported as a percentage)
- describing the basis for the estimate
- adjusting for error in the estimate by identifying the level of confidence associated with the estimated contribution (typically reported as a percentage).
Figure 13-6 presents an example of how the estimation process works.
Customer estimates of program impact. One helpful approach in some narrowly focused situations is to solicit input on the impact directly from customers. In these situations, customers are asked why they chose a particular product or service or to explain how individuals applying skills and abilities have influenced their reaction to the product or service. This technique focuses directly on what the program is designed to improve. For example, after a teller training program was conducted following a bank merger, market research data showed that the percentage of customers who were dissatisfied with teller knowledge was reduced by 5 percent when compared with market survey data before the training program. Because the training program was the only factor during this time to affect teller knowledge, the 5 percent reduction in dissatisfied customers was directly attributable to the program.
Of course, customer estimates can be used only in situations where customer input can be obtained. Even then, customers may not be able to provide accurate data. They must be able to see the influencing factors to isolate them. However, because customer input is usually credible, the approach is helpful in the situations in which it can be used.
Figure 13-6. Example of the Estimation Process
A large financial institution had implemented various initiatives to increase opportunities for branch staff to cross-sell several products. The initiatives included
• sales training
• incentive systems
• goal setting/management emphasis
• marketing
• other.
Six months after the sales training, one measure being tracked showed improvement. Credit card accounts had increased by 175 per month on average. The training team wanted to know how much of the increase was due to the sales training. The training team mailed branch managers a questionnaire asking them various questions regarding the program. A series of questions focused specifically on the contribution of the sales training.
The manager for a branch located in the Southern Division brought her team together to identify the causes of the increase in credit card accounts. Together they identified the contribution of each factor and adjusted for error in their estimates by reporting their confidence in their estimation. The result was the lowest possible estimate given a range of estimates.
| Monthly Increase in Credit Card Accounts: 175 | ||
| Contributing Factors | Percent of Average Impact on Results | Percent of Average Confidence Level |
| Sales Training Program | 32% | 83% |
| Incentive Systems | 41% | 87% |
| Goal Setting / Management Emphasis | 14% | 62% |
| Marketing | 11% | 75% |
| Other _______ | 2% | 91% |
| TOTAL | 100% | |
The contribution of the sales training program was calculated at 175 credit card accounts x 32% contribution factor x 83% confident in estimate = 46.48% new credit card accounts per month due to the sales training program.
Summary
Isolating the effects of a program is a critical step when making the connection between results and the program. Various techniques are available, including control groups, trend lines and forecasting, and using estimates, which may come from a variety of sources.
![]()
Knowledge Check: Isolating Program Effects Using Trend Line Analysis
As part of a quality improvement program, Micro Electronics, an electronics components manufacturer, conducted a series of training programs to improve quality. One measure of quality is reject rate, which is the percent of items returned for rework. Because of the overall emphasis in quality for the last year, there has been a downward movement in the reject rate. The business conducted a continuous improvement program (CPI) to improve the reject rate in one work unit. All employees of this work unit were involved in the program, conducted in July. After the program was completed, the training staff measured the impact of the program on the reduction of rejects. The chart below shows the reject rate six months before and after the program was implemented. The trend lines show the relative trends and midpoint values both before and after the program.
Using the figure below as your guide, what is improvement in reject rates due to the program? Check your answers in the appendix.

![]()
About the Author
Bruce C. Aaron, PhD, CPLP, is a capability strategy manager for Accenture, a global management consulting, technology services, and outsourcing company (www.accenture .com). He has authored or co-authored dozens of publications on topics in statistics, measurement, evaluation, instructional technology, and group decision-making systems. His most recent publication is Isolation of Results: Defining the Impact of the Program (2008). Aaron presents at a variety of international conferences such as AERA, AEA, ASTD, ISPI, SALT, and The Psychometric Society. Aaron received a master’s degree in School Psychology and a PhD in Educational Measurement and Evaluation from the University of South Florida, and he is a Certified Professional in Learning and Performance (CPLP). Aaron can be reached at [email protected].
References
Alliger, G. M. and E. A. Janak. (1989). “Kirkpatrick’s Levels of Training Criteria: Thirty Years Later.” Personnel Psychology 42: 331–342.
Armstrong, J. ed. (2001). Principles of Forecasting: A Handbook for Researchers and Practitioners. Boston: Kluwer Academic Publishers.
Phillips, J. P. and B. C. Aaron. (2008). Isolation of Results: Defining the Impact of the Programs. San Francisco: Pfeiffer.
Salkind, N. (2000). Statistics for People Who (Think They) Hate Statistics. Thousand Oaks, CA: Sage.
Wang, G., Z. Dou, and N. Lee. (2002). “A Systems Approach to Measuring Return on Investment (ROI) for HRD Interventions.” Human Resource Development Quarterly 13(2): 203–24.
Additional Reading
Aiken, L. (1991). Psychological Testing and Assessment, 7th ed. Boston: Allyn and Bacon.
Brinkerhoff, R. O. and D. Dressler. (July 2002). “Using Evaluation to Build Organizational Performance and Learning Capability: A Strategy and a Method.” Performance Improvement.
Kaufman, R. (July 2002). “Resolving the (Often-Deserved) Attacks on Training.” Performances Impermanency 41(6).
Keuler, D. (2001). “Measuring ROI for Telephonic Customer Service Skills,” In Action: Measuring Return on Investment vol. 3. P. Phillips ed. Alexandria, VA: ASTD, 131–58.
Phillips, P. P. and J. J. Phillips. (2002). “Evaluating the Impact of a Graduate Program in a Federal Agency,” In Action: Measuring ROI in the Public Sector. P. Phillips ed. Alexandria, VA: ASTD, 149–72.
Phillips, P. P. and J. J. Phillips. (2007). Proving the Value of HR: ROI Case Studies. Birmingham, AL: ROI Institute.
Phillips, P. P. and J. J. Phillips. (2007). Proving the Value of HR: ROI Case Studies. Birmingham, AL: ROI Institute.
Russ-Eft, D. and H. Preskill. (2001). Evaluation in Organizations: A Systematic Approach to Enhancing Learning, Performance, and Change. Cambridge, MA: Perseus Books.
Surowiecki, J. (2004). The Wisdom of Crowds: Why the Many Are Smarter than the Few and How Collective Wisdom Shapes Business, Economies, Societies, and Nations. New York: Doubleday.