It may feel like everyone (and their grandmother) spends their entire day liking, tweeting, and creating TikTok videos—yet, that is not the reality. Everyone is not spending extensive time on social media and those who are do not use every social media platform. Over time, consumers change their social media platform preferences and behavior. Just because a consumer group is using a platform today offers no guarantee that they will be using the same platform tomorrow. Indeed, social media is a fluid and evolving space. Many of the changes that occur in social media can be attributed to technological advancements and perhaps, more importantly, consumer behavior. The future of social media platforms, such as Facebook and Instagram, and the manner in which consumers use them to both connect with companies and engage in sWOM are dependent on each platform’s ability to meet consumer needs. Therefore, to be successful in your social media efforts, it is crucial to understand social media consumer behavior. So, who is the social consumer and why should we care?
What Is a Social Consumer?
A social consumer is an individual who uses social media to both identify and share product-related information (i.e., articles and opinions) that assists their own or others’ consumption decision-making process. A social consumer may use Facebook to checkout a friend’s new outfit, LinkedIn to establish the credibility of a local home improvement company, Twitter to keep abreast of breaking industry news, YouTube to learn how to build a bookcase from Lowes, and Pinterest to bookmark future purchases. In other words, consumers are using social media to help them identify, evaluate, and use products and services. They are both viewing and engaging in communication with their personal networks and businesses. In addition, they are sharing information and offering their opinion on products, thereby potentially influencing the behavior of others. This chapter will explore the demographic and behavioral differences behind these consumers.
Who Are Social Consumers?
4.62 billion individuals or over half of the world’s population are active social media users.
Globally, 4.62 billion individuals are active social media users and virtually everyone is accessing their social media accounts from a mobile device (We Are Social and Hootsuite 2022). The heaviest users of social media, specifically social networking sites (SNS), are the young (e.g., 2021: 84 percent of 18–29-year-olds); however, older consumers are adopting SNS at an increasing rate. Between 2010 and 2021, usage among those aged 65 and over more than tripled (11 to 45 percent) (Auxier and Anderson 2021). Adoption rates are also tied to education and income. Consumers with a higher level of education and income are the most likely to use social media (Auxier and Anderson 2021). Historically, in the United States, it was women who boasted the highest use of social media. Today, the gender gap has somewhat narrowed. In 2021, 78 percent of women online used SNS compared to 66 percent of men (Auxier and Anderson 2021). However, gender differences do exist for specific social media platforms. To illustrate, Pinterest, Snapchat, TikTok, Instagram, and Facebook are more frequently used by women. Pinterest is used almost three times more by women than men. YouTube and Twitter have comparable adoption rates for both genders, whereas LinkedIn, WhatsApp, and Reddit are more popular with men (Auxier and Anderson 2021).
Social media platforms’ adoption rates also vary by race and ethnicity. A 2021 study by Pew Research Center revealed that while Facebook is the most popular platforms across racial or ethnic lines, minority groups
(i.e., Blacks and Hispanics) have considerably higher rates of platform usage, compared to Whites on most of the popular SNS (i.e., Facebook, Instagram, YouTube, WhatsApp, and TikTok). Notably, Hispanics usage rates are much higher on WhatsApp (46 percent) compared to Whites (16 percent) and Blacks (23 percent) and lower on LinkedIn (19 percent, versus Black 27 percent and White 29 percent) and Pinterest (18 versus 35 percent Black and 34 percent White).
Figure 2.1 outlines the number of active users for each platform

Figure 2.1 Major social media platforms global active users
Source: Data curated from We are Social and Hootsuite (2022).
Consumers across the globe have adopted an average of 7.5 different social media platforms. In the United States, adoption rates are slightly lower, with the average consumer using 6.6 different platforms (We Are Social and Hootsuite 2022). If consumers are limiting their social media usage to just one platform, chances are it is Facebook. Facebook remains the worldwide favorite and the overall favorite in the United States (although a teen or young adult will passionately debate this point) (GWI 2022). Yet, more U.S. adults use YouTube (81 versus 69 percent for Facebook). After YouTube and Facebook, there is a steep drop-off for U.S. adult social media platform reported 2021 usage—Instagram (40 percent), Pinterest (31 percent), LinkedIn (28 percent), Snapchat (25 percent), WhatsApp (23 percent), TikTok (21 percent), Reddit (18 percent), and Nextdoor (13 percent) (Pew Research Center 2021a).
Social media platform usage, however, does not exemplify frequency of use or the demographic differences that exist. To illustrate, average daily time spent on social media can vary dramatically by county. Philippines residents are on it, on average 4 hours and 6 minutes, whereas individuals in Japan clock in at only 51 minutes a day. United States consumers fall somewhere in-between at 2 hours and 14 minutes (We Are Social and Hootsuite 2022). As for the frequency of use, a majority of U.S. adults are likely to use Facebook, Snapchat, Instagram, and YouTube on a daily basis, whereas Twitter is used daily by only 46 percent of those surveyed (Pew Research Center 2021a). In fact, 49 percent of U.S. Facebook users (Gramlich 2021) and 38 percent of Instagram users use it several times a day (Schaeffer 2021).
How and Why Do Social Consumers Access Social Media?
In 2021, smartphone adoption rates (85 percent) were higher than desktop and laptop computers (77 percent). Adoption rates for tablets were at 53 percent (Pew Research Center 2021b). Young adults have even higher adoption rates—96 percent of 18- to 29-year-olds and 95 percent of 30- to 49-year-olds own a smartphone (Pew Research Center 2021b). But, smartphones aren’t just for adults; in 2018, 95 percent of U.S. teenagers had access to a smartphone (Anderson and Jiang 2018). Outside of age, smartphone ownership in the United States is somewhat equally divided between men and women but skewed toward younger, college-educated consumers earning higher incomes. Ownership rates are approximately the same between Whites, Blacks, and Hispanics (Pew Research Center 2021b). For 15 percent of smartphone consumers, their smartphone is their primary, if not only, means to access the Internet. They do not have a broadband connection (Perrin 2021). Outside of simple access, it appears that consumers are spending considerably more time using social media on their smartphones compared to their desktop or laptop computers. Worldwide, 98.8 percent of all social media users access platforms on their mobile phones (We Are Social and Hootsuite 2021).
There is a myriad of reasons why consumers access social media. A 2020 study conducted by GWI (Global WebIndex) of 180,852 worldwide Internet users aged 16 to 64 identified the most popular reasons behind social media consumption (see the following bulleted list). In addition, they completed later a generational analysis to determine if motivations differed between Gen Z (1997–2003), Millennials (1983–1996), Gen X (1964–1982), and Boomers (1955–1963). While some motivations remained relatively constant between generations (e.g., “keeping in touch,” “reading news stories,” and “finding products to purchase”). Other motivations such as “filling spare time,” “finding content,” “seeing what’s trending,” “finding inspiration,” “following celebrities or influencers,” “seeing brand updates,” and “making new contacts” were vastly different especially when comparing Gen Z to Baby Boomers. In general, each of these motivating reasons was most popular for Generation Z and gradually decreased for each subsequent generation. The one exception was “keeping in touch with friends/family” where Baby Boomers had the highest affirmative response, followed subsequently by each generation (GWI 2021, 2022).
• Keeping in touch with friends/family—50 percent
• Reading news stories—36 percent
privacy of approximately 8• Filling spare time—37 percent
• Finding content—32 percent
• Seeing what’s trending/being talked about—30 percent
• Finding inspiration for things—28 percent
• Finding products to purchase—27 percent
• Sharing/discussing opinions with others—25 percent
• Watching livestreams—24 percent
• Making new contacts—24 percent
• Seeing updates/content from favorite brands—23 percent
• Work-related networking research—23 percent
• Finding like-minded communities—22 percent
• Posting about your life—22 percent
• Watching/following sports—21 percent
• Following celebrities or influencers—21 percent
Thankfully, from a marketer’s perspective, many of these motivating reasons revolve around brands and their marketing efforts. It is clear that social media is part of the consumer buyer’s journey. This is particularly true for younger generations that are more apt to follow influencers, research brands, and get brand recommendations.
Levels of Engagement and Social Consumer Roles
Social media satisfies a variety of purposes—it allows us to stay in touch with friends, network with professionals, stay current with news or events, provides entertainment, but it also provides us with the opportunity to share our opinions simultaneously with a large number of consumers and to engage with brands. Social consumers play various roles that impact the consumer decision-making process: social listeners, social sharers, and social influencers. Before we delve into these roles, let’s first examine the levels of engagement possible within social media.
Charlene Li’s, Senior Fellow at Altimeter, research developed an engagement pyramid (Figure 2.2). The engagement pyramid depicts various levels of engagement that social consumers and social employees can have within social media. It reveals that many consumers and employees are engaged at the lower levels. Although this research is now dated, these categories still hold in the context of social media. Smartphone ubiquity, coupled with the popularity of image and video platforms such as Instagram, Snapchat, and TikTok, suggests that we may need to rethink the placement of producing on the pyramid.
The Watching segment’s engagement is limited to watching (or listening) to social media. In academic and industry research, these are commonly referred to as Lurkers (Gong, Lim, and Zhu 2015). They are passive observers of tweets, Instagram posts, and articles that they see on Facebook and videos they watch on YouTube. They are neither sharing nor interacting but simply consuming information. Industry experts originally claimed that as much as 90 percent of social media were classified as Lurkers (Nielsen 2006). Others have since claimed that this number may be inflated (Vision Critical 2014; Dembosky 2012). But regardless of the actual number, all agree that the majority of consumers are simply watching. The second level is Sharing. At this level, consumers become more engaged—they are not only listening and digesting information, but they are also frequent sharers of information. They retweet and share content produced by other individuals and companies’ content. Commenting is the next level, where consumers craft and share their opinions. Their opinions are not private but rather part of a larger public dialog. Arguably, the next two steps take a considerable jump up in the engagement level when compared to commenting. In Producing, consumers create fresh new content (e.g., YouTube videos, Facebook posts) to share with others. The last level of engagement, Curation, is only accomplished by a small number of consumers. These individuals are very active on social media, sorting through content and sharing only the most relevant data with their networks. They make it easy for consumers to find what is important and relevant, and for that reason, they are seen as trusted advisers (Li 2010). As a company, you don’t want all of your consumers to simply watch (or listen) to your social media content. If all they do is watch, then their level of influence is low. Instead, you should strive to develop content that moves some of consumers up to higher levels of the engagement pyramid.
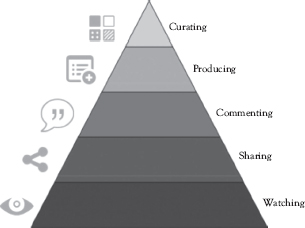
Figure 2.2 The social media engagement pyramid
Source: Adapted from Li (2010).
The three roles of social listeners, social sharers, and social influencers are related to engagement—although they are somewhat broader constructs (Figure 2.3).
Social Listeners
A social listener, as the name implies, is an individual who observes or listens to conversations on social media. They participate in the “watching” level of engagement. This individual may be in a passive or active shopping mode. A passive shopping mode is when “information and advice [that] consumer[s] need to make a purchase comes to them unsolicited” (Belch and Belch 2014, 131). Consumers are continually collecting information that may come from a Facebook post, a tweet that they happen to glance at, or a pin that they came across when looking for a great guacamole recipe. Although consumers may not be interested in purchasing the product then, the fact that they have read the post allows them to accumulate knowledge that may be helpful to them in the future or that they can share with others. For example, reading a review of a restaurant posted by a friend and then later sharing this information with another friend who is looking for a new place to eat. In truth, consumers are constantly in this passive stage—unknowingly accumulating knowledge for future use.

In the active shopping mode, consumers are “purposefully seeking information and/or assistance so [consumers] can make informed purchase decisions with confidence” (Belch and Belch 2014, 131). This hunt for product information often leads consumers to social media. A study undertaken by Forrester Research revealed that an average U.S. adult uses social media to both “discover” and “explore” new products (Fleming 2016). Whereas, a GWI 2021 study identified “finding products to purchase” as a main reason to use social media by 27 percent of North American survey respondents (GWI 2021). Younger consumers (Gen Z, Gen Y, and Gen X) are more likely to use social media to both find new products to purchase and see updates or content from their favorite brands compared to older consumers (Baby Boomers) (GWI 2022). Finding information about products and brands was also one of the three primary reasons given by consumers in using Pinterest, LinkedIn, Instagram, Reddit, and Twitter. The location of where consumers find information on new brand/product information also varies: social media ads (28 percent), recommendations/comments on social media (23 percent), updates on brands’ social media pages (17 percent), posts/reviews by expert bloggers (16 percent), celebrity endorsements (15 percent), messaging app ads (14 percent), vlogs (13 percent), and forums/message boards (12 percent) (GWI 2021).
When Do They Listen?
Let’s face it; we are not always receptive to other people’s advice. Sometimes, we simply don’t care that Sally loves her new car, found a new recipe on Pinterest, or looks fabulous in those Instagrammed shoes. But there are other times when we are not only interested but are more receptive to these social recommendations to assist us in our purchase. We are certainly more receptive when we are in active shopping mode—but are there other factors that make us more likely to listen to sWOM?
Academic research on traditional WOM and eWOM, coupled with industry studies addressing social media, has identified several conditions when social consumers are more likely to seek out and are receptive to social recommendations and information:
• Purchasing a product for the first time or having little experience within the product category (Gilly et al. 1998).
• High involvement purchase (e.g., higher level of risk associated with the purchase) (Beatty and Smith 1987).
• Younger consumers (Mixon 2016; Sprout Social 2021).
• Americans with more than $100,000 yearly household income (Mixon 2016).
• When the message is personalized and effectively targeted (Bughin 2015).
• For specific product categories (i.e., 40–50 percent of consumers used social recommendations when selecting travel and investment services) (Bughin 2015).
• Consumers who use a search engine in researching a product are also more likely to use social media in their prepurchase investigation (Bughin 2015).
• When the recommendation is received from a highly credible source (Park and Lee 2009; Gilly et al. 1998).
• Influence is more substantial when the “tie strength” is strong. In other words, your relationship or connection with the recommender is robust (i.e., friends or family) (Brown and Reingen 1987).
In conclusion, listening behavior is now swiftly converting to purchases within social media as these platforms continue to monetize. One industry survey found that approximately 8 in 10 businesses are currently selling or plan on selling directly within social media platform in the next three years (Sprout Social 2021).
Social Sharers
Not all social media users share information. Yet, many of us do share, retweet, and comment. Social sharers are consumers who not only post information about products or services via social media, but they can also share their opinion and that of others. These consumers are sharing, commenting, and producing. One industry study found that 94 percent of social media users post content on social media, 42 percent post content at least once a day, and 30 percent surveyed are either liking, posting, or sharing content more than 10 times a day (Herhold 2019). Their level of engagement on social media can include not only sharing but also commenting and even creating content.
There are two types of social sharing: implicit sharing—that relates to products (e.g., sharing a news article involving a product or endorsing a company through a “like”) and explicit sharing—sharing that includes a discussion about a product (e.g., creating a post that explicitly discusses a product). Both types are influential. A 2015 Adobe Study of European social media users (UK, France, Germany, Sweden, and Netherlands) found that implicit (i.e., follows or likes) and explicit endorsements (i.e., mentions) varied by platform, with endorsements more prevalent on Facebook and Instagram compared to Snapchat. Interestingly, 18- to 24-year-olds depended considerably more on the visually oriented platform Instagram (72 percent) than the average social media user (Watt 2016).
Implicit sharing can come in many forms. It can be simply retweeting a news article without providing a personalized comment or providing a simple brand endorsement. In other words, the endorsement is implied. A “like” on Facebook or Instagram, a “favorite” on Twitter, and a “follow” on Facebook are some of the many examples of quick implicit brand endorsements. This form of endorsement is very common perhaps, partly, to the ease at which a consumer can communicate their support. For example, a GWI survey of global social media users found that 23 percent have liked or followed a brand in the last month (GWI 2021).

Figure 2.4 Percentage of consumers who have made implicit and explicit endorsements on social media
Source: Watt (2016).
Explicit brand endorsements are more involved. They can be textual, visual, or both. Textual endorsements include personalized messages, comments, or hashtags, which may be attached to an existing piece of communication. For example, retweeting an article and including a comment and a hashtag. Hashtags can be a fast and effective way of endorsing a product (e.g., #ShareaCoke, #WantAnR8, #ShareYourEars, # PepsiPerfect). Consumers can also embed their product endorsements through visual communication. For instance, a consumer may model their new Gucci sunglasses on Instagram or pin an image of a Pottery Barn couch they are planning to purchase to their personal decorating board on Pinterest. They can also do all three—post a picture with a comment and a hashtag. This type of sharing represents a higher level of engagement, requires more time and effort, and may be more influential.
Some of the most involved product discussions on social media describe a consumer’s experience with a product and customer service. Both positive and negative brand experiences are commonly shared via social media. In addition, a 2020 survey by the CFI group found that approximately 18 percent of respondents shared their customer service experience on a variety of social media platforms: Facebook (39 percent), Instagram (15 percent), YouTube (15 percent), and Twitter (13 percent) (CFI Group 2020). The product discussions may contain textual descriptions of a product’s strengths and weaknesses, but they may also include images and video. These visual modes of communication are powerful in their ability to influence (Chapter 6). Including hashtags can increase the likelihood of the post being discovered in a search.
Why Do We Share?
There are many reasons behind why we share within social media. Some studies have addressed this question broadly, whereas others have examined sharing behavior within specific social media platforms. Understanding what drives consumers to push the “retweet” or “share” button directly impacts the type of content and conversation you hope to have with your target market.
In 2011, the New York Times conducted a comprehensive U.S.-based study examining the motivations behind social media sharing. The “Psychology of Sharing” study involved ethnographies, focus groups, and a survey of 2,500 social sharers across various social media platforms. The researchers identified five separate motivations for sharing: “to bring valuable and entertaining content to others; to define ourselves to others; to grow and nourish our relationships; self-fulfillment; and to get the word out about causes or brands” (The New York Times 2011). Underlining each of these motives was the importance of relationships. In addition, the study identified “six personas of online sharers” (The New York Times 2011):
• Altruists: Individuals motivated to share information by a sense of helping others. These people are described as helpful, reliable, thoughtful, and connected.
• Careerists: For these individuals, sharing is concentrated on information related to career and reputation enhancement.
• Hipsters: Hipsters share to express their identity. They are creative, young, on the cutting-edge, and popular.
• Boomerangs: For boomerangs, sharing is linked to validation. These individuals are seeking feedback from others.
• Connectors: For these individuals, sharing is linked to making, planning, and connecting to their offline lives (e.g., sharing a deal for a brunch with friends).
• Selectives: Selectives are not frequent sharers, but they are thoughtful. They only share when the information is relevant or useful to others.
Other studies examining consumers’ motivation to use social media revealed similar results. For instance, a 2016 study from Fractl of 2,000 Facebook users found that people shared third-party content primarily to entertain (48 percent), express information on issues that they valued (17 percent), evoke emotions (13 percent), and educate (11 percent). Sixty-nine percent of respondents also indicated that sharing “helps them feel close to their friends” (Jones 2016). Both of these studies reveal somewhat similar themes—consumers are sharing information that can bring value to other people’s lives. For information to be shared, it needs to be interesting, funny, or unique. We share information out of a desire to help others (e.g., altruists). We also share information to help form our identities (e.g., hipsters). Through social media, we project to others what we want to believe and want others to believe about us.
So, which persona or personas does your target market fall into? Are they hipsters? Careerists? Both? What motivates your consumers? This New York Times sharing typology may help guide your content planning and marketing message. However, it would be helpful for you to analyze your target market sharing behavior on your social media platforms and perform primary research exploring their specific sharing motivations.
Thus far, we have talked about general sharing motives, but what motivates us to engage with brands online and share information about our product experiences? To begin, there are several reasons why consumers “like” and follow a brand. The top reasons are to learn about products, be entertained, obtain news and promotions and connect with similar people (Nanji 2019). Academic studies addressing traditional WOM (although still applicable for sWOM) have identified several factors that increase the likelihood of sharing product experiences. Briefly, consumers often post about products when they are very satisfied or very dissatisfied (Bowman and Narayandas 2001; Anderson 1998) when the product is new (Richins and Bloch 1986; Bone 1992), when there is high product involvement (i.e., the product is relevant to consumers) (Richins and Bloch 1986), and when the consumer is highly involved in the marketplace (i.e., market mavens) (Slama and Tashcian 1985).
Marketers need to understand sharing behavior to identify the type of content that is most likely to be shared on each social media platform. Unfortunately, the act of sharing does not mean that that individual will be influential. A social consumer can post a rave review about a product, but what if that consumer has only a handful of followers and what if they never see the review? In this case, the social sharer may have limited influence on the behavior of others. For that reason, it is important the companies seek out social influencers.
Social Influencers
There are a relatively small number of social consumers that have a disproportionately large amount of social influence when it comes to sWOM. In the marketing world, they are commonly referred to as opinion leaders, social influencers, or simply, influencers. Influencers (or opinion leaders) typically focus their expertise in a specific area (i.e., fashion, food, exercise). Social influencers, those who influence the opinions and behaviors of others, are engaged at all levels—they share, comment, produce, and curate. Their recommendations are surprisingly powerful. A joint study by Twitter and Annalect found that recommendations from influencers on Twitter were relied upon almost as much as recommendations from friends (56 percent relied on friends versus 49 percent for influences). Forty percent of those surveyed admitted to purchasing a product as a result of an influencer’s recommendation (Swant 2016).
Marketers recognize the importance and value of these influencers, which is why formal influencer campaigns, and the agencies that support them have become commonplace. A 2022 survey of 1000+ marketing professionals found that 34 percent were going to prioritize influencer marketing. Additionally, 57 percent of marketers currently using influencer marketing believed it was effective, and 46 percent of those planned to spend more in 2022 (Bump 2022). Influencer programs effectively fulfill three objectives: building brand awareness, generating sales leads, and increasing consumer loyalty.
Social influencers come in various forms, with varying levels of influence. They can provide companies with informal, organic support (or nonsupport). Alternatively, their role can also be much more formal, with input and compensation provided by the company. Indeed, influencer marketing has exploded—spending is estimated to be $16.4 billion in 2022 (Influencer Marketing Hub 2022). It has become an industry in itself, which includes dedicated companies, software packages, agents, and, of course, millions of influencers. To do this topic justice, we needed an entire chapter of material. So, please see Chapter 5 for an in-depth social influencers dive.
Rethinking Being a Social Consumer
Consumers are increasingly examining the role that social media is playing in their lives. This can be attributed, in part, to numerous public scandals that have embroiled social platforms. To illustrate, the 2018 Cambridge Analytica Facebook news alerted the public to the misuse of consumer data—violating the privacy of approximately 87 million Facebook users (Confessore 2018). The security of these networks has also been questioned, as evidenced by the July 15, 2020, Twitter Hack, where numerous high-profile accounts were taken over in a Bitcoin scam (New York State Department of Financial Services 2020). And most recently, in 2021, the social media platform Facebook (now Meta) has employed a host of troubling, unethical business practices. Specifically, Ms. Frances Haugen, a former Facebook product manager turned whistle blower, revealed that Meta had a two-tier content monitoring system—often letting celebrities, politicians, and other high-profile account post and disseminate content that were clear content policy violations (Horwitz 2021). Meta has also been criticized for a lack of content monitoring in developing countries where Facebook has been used to recruit women for human trafficking, run cartel businesses, and incite violence (Scheck, Purnell, and Horwitz 2021). Lastly, Instagram’s (another Meta property) own internal research has found that one in five teens acknowledged that Instagram “makes them feel worse about themselves,” and many teens believe that Instagram is hurting their mental health (Wells, Horwitz, and Seetharaman 2021). More broadly, 12 percent of users “report engaging in compulsive use of social media that impacts their sleep, work, parenting, or relationships.”
Outside of news stories, a growing body of academic research also supports the idea that there is a correlation between heavy social media use and a variety of mental health disorders (i.e., depression, narcissism, anxiety, etc.) (Barry et al. 2017; Woods and Scott 2016; Anderson, Pallesen, and Griffiths 2017). Younger consumers (Gen Z) are the most concerned about time spent on social media (GWI 2021). Negative news stories and research coupled with consumers’ own experiences of social media use have led a majority of consumers to believe that specific social media platforms, such as Facebook, have a negative impact on society (The WashingtonPost 2021). Consumers simply don’t trust many of the platforms. A 2021 poll revealed that 72 percent of users did “not much” or “at all” trust Facebook, followed by TikTok 63 percent, Instagram 60 percent, WhatsApp 53 percent, and YouTube 53 percent (The Washington Post 2021).
Response to Public Concerns
Apple Investors, concerned with the academic literature on the negative effects of “screen time” on children, called upon Apple to find ways to reduce time spent on the iPhone (Walton 2018). What resulted was the 2018 “Screen Time” iOS tool that allows parents (and really anyone) to monitor and control how much time they spend online and notably within specific social media platforms. These monitoring features are now offered on all phone operating systems. Outside of simply monitoring social media use, some consumers have gone a step further. A Pew Research Center 2018 study found that 42 percent have “taken a break from checking in for several weeks or more” and 26 percent have deleted the Facebook phone app (Perrin 2018). While specific numbers are hard to come by, anecdotal evidence of a quitting social media trend is apparent through the plethora of “how to delete [social media platform]” articles and the popularity of the search phrases “how to delete [platform] account” for Instagram and Facebook (i.e., approximately one million combined Google keyword searches in November 2021!). The Facebook platform, however, may be experiencing the brunt of the social media exodus. Younger users are leaving. In the data presented to Congress, Facebook has seen declining use of 18- to 24-year-olds and plateauing usage of 13- to 17-year-olds since 2012 (Wagner and McLaughlin 2021). Since 2019, teenage use of Facebook has decreased by 13 percent. More troubling for Facebook is that in the next two years, it was projected to decrease by 45 percent (Heath 2021).
As everyday users are turning away from social media platforms, businesses are also responding by no longer using their accounts and no longer advertising within the network. For example, in July 2020, a coordinated Facebook advertising boycott of more than 1,000 companies, named #StopHateForProfit, occurred, whereas other companies, such as Proctor and Gamble, Walmart, and Geico, reduced their spending (Hsu and Lutz 2020). This boycott wanted Facebook to address hate speech, voter suppression, and the “silencing of Black voices” (Aziz 2020). Responding to negative news and societal pushback, some businesses have decided to make a more permanent disconnection from social media. Lush, a British cosmetics retailer with an emphasize for ethically sourced products and charity work, decided to shut down its accounts on Facebook, Instagram, Snapchat, and TikTok—losing over 10 million followers and related sales (Wood 2021). Fashion brands Bottega Veneta and Balenciaga have also eliminated their social media use (Webb 2021). Whereas others, like Patagonia, had stayed on the platform but no longer participates in the advertising business (Ali 2021).
In recent years, CEOs and senior executives from Facebook (Meta), Twitter, Google (Alphabet), Snapchat, TikTok, and Reddit have been repeatedly called into U.S. congressional hearings to address concerns regarding privacy, mental health, misinformation, political interference, and “domestic violent extremism” (C-SPAN 2020; Kang 2021; United States House 2022). Time will tell whether the state or federal government will become more involved in regulating social media. What is clear, however, is that the public is becoming more amenable to some sort of intervention. In a 2021 Washington Post–Schar School poll, 64 percent of survey respondents indicated that the “government should do more to regulate how Internet companies handle privacy issues” (The Washington Post 2021). Whereas Pew Research Center found that 48 percent of U.S. adults believed that the U.S. “government should take steps to restrict false information, even it if means losing some freedom …” (Mitchell and Walker 2021).
Marketing Implications
Distrust of platforms, increased privacy settings, limiting usage, deleting social media apps, and unethical business practices all have implications for marketers using social media platforms. While the authors believe that social media will not leave us anytime soon, marketers must pay attention to the changing public perceptions of specific social media platforms. In particular, they need to quickly pivot to new platforms as their target market usage patterns and platform perceptions change. Brands also need to ensure that their actions are consistent with their positioning. If a brand promotes ethical practices and consumers’ well-being and health, then advertising on platforms that are antithetical to these themes would not be “on-brand.” Lastly, federal regulations may be put into place limiting marketers’ effectiveness in reaching their target market (see Chapter 7 for more on this topic).
References
Ali, S. October 09, 2021. “Patagonia Doubles Down on Its Facebook Boycott in Wake of New Whistleblower Leaks.” The Hill. Retrieved from https://tinyurl.com/uvhh7bme.
Anderson, E. 1998. “Customer Satisfaction and Word of Mouth.” Journal of Service Research 1, no. 1, pp. 5–17.
Anderson, M. and J. Jiang. May 31, 2018. “Teens, Social Media and Technology.” Pew Research Center. Retrieved from https://www.pewresearch.org/internet/2018/05/31/teens-social-media-technology-2018/
Anderson, C., S. Pallesen, and M. Griffiths. January 2017. “The Relationship Between Addictive Use of Social Media, Narcissism, and Self-Esteem: Findings From a Large National Study.” Addictive Behaviors 64, pp. 287–293.
Auxier, B. and M. Anderson. April 07, 2021. “Social Media Use 2021.” Pew Research Center. Retrieved from https://www.pewresearch.org/internet/2021/04/07/social-media-use-in-2021/.
Aziz, A. June 24, 2020. “Facebook Ad Boycott Campaign ‘Stop Hate for Profit’ Gathers Momentum and Scale: Inside the Movement for Change.” Forbes. Retrieved from https://www.forbes.com/sites/afdhelaziz/2020/06/24/facebook-ad-boycott-campaign-stop-hate-for-profit-gathers-momentum-and-scale-inside-the-movement-for-change/?sh=9e9004b16687.
Barry, C., C. Sidoti, S. Briggs, S. Reiter, and R. Lindsey. 2017. “Adolescent Social Media Use and Mental Health from Adolescent and Parent Perspectives.” Journal of Adolescence 61, pp. 1–11.
Beatty, S. and S. Smith. 1987. “External Search Efforts: An Investigation Across Several Product Categories.” Journal of Consumer Research 14, no. 1, pp. 83–95.
Belch, G. and M. Belch. 2014. “The Role of New and Traditional Media in the Rapidly Changing Marketing Communications Environment.” International Journal on Strategic Innovation Marketing 1, no. 3, pp. 130–136.
Bone, P. 1992. “Determines of Word-of-Mouth Communications During Product Consumption.” In Advances in Consumer Research, eds. J.F. Sherry and B. Sternthal, pp. 572–583. Provo, UT: Association for Consumer Research. www.acrwebsite.org/search/view-conference-proceedings.aspx?Id=7359.
Bowman, D. and D. Narayandas. 2001. “Managing Customer-Initiated Contacts With Manufacturers: The Impact of Share of Category Requirements and Word-of-Mouth Behavior.” Journal of Marketing Research 38, no. 3, pp. 281–295.
Brown, J.J. and P.H. Reingen. 1987. “Social Ties and Word-of-Mouth Referral Behavior.” Journal of Consumer Research 14, no. 3, pp. 350–362. http://search.ebscohost.com/login.aspx?direct=true&db=bth&AN=4657957&site=ehost-live.
Bughin, J. 2015. “Getting a Sharper Picture of Social Media’s Influence.” McKinsey Quarterly. www.mckinsey.com/business-functions/marketing-and-sales/our-insights/getting-a-sharper-picture-of-social-medias-influence.
Bump, P. 2022. “The Marketing Trends of 2022.” Hubspot. Retrieved from https://blog.hubspot.com/marketing/marketing-trends.
CFI Group. 2020. “Contact Center Satisfaction Index (CCSI).” CFI Group. Retrieved from https://cdncom.cfigroup.com/wp-content/uploads/CFI-contact-center-satisfaction-2020.pdf.
Confessore, N. April 04, 2018. “Cambridge Analytica and Facebook: The Scandal and the Fallout So Far.” The New York Times. Retrieved from www.nytimes.com/2018/04/04/us/politics/cambridge-analytica-scandal-fallout.html.
C-SPAN. 2020. “Facebook and Twitter CEOs Testify on Regulating Social Media Content.” C-SPAN. Retrieved from www.c-span.org/video/?478048-1/facebook-twitter-ceos-testify-regulating-social-media-content#.
Dembosky. April 2012. “In the West We’re Mostly Social Media ‘Lurkers.’” The Globe and Mail. www.theglobeandmail.com/technology/digital-culture/social-web/in-the-west-were-mostly-social-media-lurkers/article1357516/ (accessed February 08, 2017).
Fleming, G. 2016. “The Data Digest: Forrester’s Social Technographics 2016.” Data Insights Professionals Blog. http://blogs.forrester.com/category/social_technographics.
Gilly, M., J.L. Graham, M. Wolfinbarger, and L. Yale. 1998. “A Dyadic Study of Interpersonal Information Search.” The Journal of the Academy of Marketing Science 26, no. 2, pp. 83–100.
Gong, W., E.P. Lim, and F. Zhu. 2015. “Characterizing Silent Users in Social Media Communities.” In Proceedings of the Ninth International AAAI Conference on Web and Social Media, pp. 140–149.
Gramlich, J. 2021. “10 Facts About Americans and Facebook.” Pew Research Center. Retrieved from www.pewresearch.org/fact-tank/2021/06/01/facts-about-americans-and-facebook/.
GWI. 2021. “Social Media Marketing in 2021.” Global WebIndex. Retrieved from www.gwi.com/reports/social-report-b.
GWI. 2022. “The Biggest Social Media Trends for Social.” Global WebIndex. Retrieved from www.gwi.com/reports/social.
Heath, A. October 25, 2021. “Facebook’s Lost Generation.” The Verge. Retrieved from www.theverge.com/22743744/facebook-teen-usage-decline-frances-haugen-leaks.
Herhold, K. 2019. “How People Interact on Social Media in 2019.” The Manifest Blog. Retrieved from https://themanifest.com/social-media/how-people-interact-social-media.
Horwitz, J. September 13, 2021. “Facebook Says Its Rules Apply to All. Company Documents Reveal a Secret Elite That’s Exempt.” The Wall Street Journal. Retrieved from www.wsj.com/articles/facebook-files-xcheck-zuckerberg-elite-rules-11631541353?mod=series_facebookfiles.
Hsu, T. and E. Lutz. August 01, 2020. “More Than 1,000 Companies Boycotted Facebook. Did It Work?” The New York Times. Retrieved from www.nytimes.com/2020/08/01/business/media/facebook-boycott.html.
Influencer Marketing Hub. 2022. “The State of Influencer Marketing 2022.” Influencer Marketing Hub. Retrieved from https://influencermarketinghub.com/ebooks/Influencer_Marketing_Benchmark_Report_2022.pdf.
Jones, K. 2016. “Motivations for Sharing on Facebook.” Fractl Blog. Retrieved from https://blog.frac.tl/motivations-sharing-facebook.
Kang, C. September 30, 2021. “Facebook Grilled by Senators Over Its Effect on Children.” The New York Times. Retrieved from www.nytimes.com/2021/09/30/technology/facebook-senate-hearing.html.
Li, C. 2010. Open Leadership: How Social Technology Can Transform the Way You Lead. New York, NY: John Wiley & Sons, Inc.
Mitchell, A. and M. Walker. 2021. “More Americans Now Say Government Should Take Steps to Restrict False Information Online Than in 2018.” Pew Research Center. Retrieved from www.pewresearch.org/fact-tank/2021/08/18/more-americans-now-say-government-should-take-steps-to-restrict-false-information-online-than-in-2018/.
Mixon, I. 2016. “8 Statistics That Will Change the Way You Think About Referral Marketing.” Ambassador. http://app.mhb.io/e/npo3/57 (accessed February 08, 2017).
Nanji, A. 2019. “Why People Follow (And Unfollow) Brands on Social Media.” MarketingProfs. www.marketingprofs.com/charts/2019/41243/why-people-follow-and-unfollow-brands-on-social-media.
New York State Department of Financial Services. 2020. “Twitter Investigation Report.” Retrieved from www.dfs.ny.gov/Twitter_Report.
Nielsen, J. 2006. The 90-9-1 Rule for Participation Inequality in Social Media and Online Communities. California: Nielsen Norman Group.
Park, C. and T.M. Lee. 2009. “Information Direction, Website Reputation and the eWOM Effect: A Moderating Role of Product Type.” Journal of Business Research 62, no. 1, pp. 61–67.
Perrin, A. September 05, 2018. “Americans Are Changing Their Relationship With Facebook.” Pew Research Center. Retrieved from www.pewresearch.org/fact-tank/2018/09/05/americans-are-changing-their-relationship-with-facebook/.
Perrin, A. June 03, 2021. “Mobile Technology and Home Broadband 2021.” Pew Research Center. Retrieved from www.pewresearch.org/internet/2021/06/03/mobile-technology-and-home-broadband-2021/.
Pew Research Center. 2021a. “Social Media Fact Sheet.” Pew Research Center. Retrieved from www.pewresearch.org/internet/fact-sheet/social-media/.
Pew Research Center. 2021b. “Mobile Fact Sheet.” Pew Research Center. Retrieved from www.pewresearch.org/internet/fact-sheet/mobile/.
Richins, M. and P. Bloch. 1986. “After the New Wears Off: The Temporal Context of Product Involvement.” Journal of Consumer Research 13, no. 2, pp. 280–285.
Schaeffer, K. 2021. “7 Facts About Americans and Instagram.” Pew Research Center. Retrieved from www.pewresearch.org/fact-tank/2021/10/07/7-facts-about-americans-and-instagram/.
Scheck, J., N. Purnell, and J. Horwitz. September 16, 2021. “Facebook Employees Flag Drug Cartels and Human Traffickers—The Company’s Response Is Weak, Documents Show.” The Wall Street Journal. Retrieved from www.wsj.com/articles/facebook-drug-cartels-human-traffickers-response-is-weak-documents-11631812953?mod=series_facebookfiles.
Slama, M. and A. Tashcian. 1985. “Selected Socioeconomic and Demographic Characteristics Associated With Purchasing Involvement.” Journal of Marketing 49, pp. 72–82.
Sprout Social. 2021. “The Future of Social Media: New Data for 2021 & Beyond.” Sprout Social. Retrieved from https://sproutsocial.com/insights/data/harris-insights-report/.
Swant, M. 2016. “Twitter Says Users Now Trust Influencers Nearly as Much as Their Friends.” Adweek. Retrieved from www.adweek.com/news/technology/twitter-says-users-now-trust-influencers-nearly-much-their-friends-171367.
The New York Times. 2011. “The Psychology of Sharing.” Retrieved from https://foundationinc.co/wp-content/uploads/2018/12/NYT-Psychology-Of-Sharing.pdf.
The Washington Post. December 22, 2021. “November 4–22, Washington Post-Scholar School Tech Poll.” Retrieved from www.washingtonpost.com/context/nov-4-22-2021-washington-post-schar-school-tech-poll/1f827037-688f-4030-a3e4-67464014a846/?itid=lk_inline_manual_6.
United States House. January 13, 2022. “Select Committee Subpoenas Social Media Companies for Records Related to January 6th Attack.” Press Release January 6th Committee. Retrieved from https://january6th.house.gov/news/press-releases/select-committee-subpoenas-social-media-companies-records-related-january-6th.
Vision Critical. 2014. “New Vision Critical Report Identifies Major Gaps in Social Media Data Companies Use to Analyze Customer Behavior.” www.businesswire.com/news/home/20141209005233/en/New-Vision-Critical-Report-Identifies-Major-Gaps-in-Social-Media-Data-Companies-Use-to-Analyze-Customer-Behavior.
Wagner, K. and D. McLaughlin. October 25, 2021. “Facebook, Alarmed by Teen Usage Drop, Left Investors in the Dark.” Bloomberg. Retrieved from www.bloomberg.com/news/articles/2021-10-25/facebook-files-show-growth-struggles-as-young-users-in-u-s-decline.
Walton, A. January 09, 2018. “Investors Pressure Apple Over Psychological Risks of Screen Time for Kids.” Forbes. Retrieved from www.forbes.com/sites/alicegwalton/2018/01/09/investors-pressure-apple-over-psychological-risks-of-screen-time-for-kids/?sh=de10b9e38dfe.
Watt, N. 2016. “ADI: Best of the Best Brands Driving Social Media Success.” CMO. www.cmo.com/adobe-digital-insights/articles/2016/7/18/adi-best-of-the-bestdriving-social-media-success-.html#gs.b90iG=k.
We Are Social and Hootsuite. 2021. “Digital 2021 Global Overview Report.” Retrieved from https://wearesocial.com/uk/blog/2021/01/digital-2021-uk/.
We Are Social and Hootsuite. 2022. “Digital 2021 Global Overview Report.” Retrieved from https://wearesocial.com/uk/blog/2022/01/digital-2022-another-year-of-bumper-growth-2/.
Webb, B. November 22, 2021. “Lush Is Quitting Social Media. The Start of a Trend?” Vogue. Retrieved from www.voguebusiness.com/consumers/lush-is-quitting-social-media-the-start-of-a-trend-facebook-instagram-snapchat-tiktok.
Wells, G., J. Horwitz, and D. Seetharaman. September 14, 2021. “Facebook Knows Instagram Is Toxic for Teen Girls, Company Documents Show.” The Wall Street Journal. Retrieved from www.wsj.com/articles/facebook-knows-instagram-is-toxic-for-teen-girls-company-documents-show-11631620739?mod=series_facebookfiles.
Wood, Z. November 26, 2021. “‘I’m Happy to Lose £10m by Quitting Facebook,’ Says Lush Boss.” The Guardian. Retrieved from www.theguardian.com/business/2021/nov/26/im-happy-to-lose-10m-by-quitting-facebook-says-lush-boss.
Woods, H. and H. Scott 2016. “#Sleepyteens: Social Media Use in Adolescence Is Associated With Poor Sleep Quality, Anxiety, Depression and Low Self-Esteem.” Journal of Adolescence 51, pp. 41–49.