8. Quantifying Uncertainty
,Software development is a risky business because the entire undertaking is shrouded in uncertainty. Anything you need to predict about a project will be to some extent uncertain. But exactly how uncertain?
We can look back at a given project and say about the project manager, “She really didn’t know when the work would be done.” But what does that mean? How uncertain was she? Maybe she was confident that the project would be done sometime in Month 6, and just a little unsure about whether that meant early or late in the month. Or maybe she was truly clueless. There is clearly a world of difference between these two levels of uncertainty. Think about it this way: You are a project manager running an effort that is scheduled to be done by October 30. You’ve got a pretty good sense that October 30 is not in the cards, but beyond that, you really don’t know. You’re essentially clueless. Your subordinates are equally in the dark. So, around midsummer, with the deadline four months away, you call in a consultant. The consultant you’ve chosen is the best in the business, someone who can size up a project in his sleep and tell you where it stands. After a few days of poring over the spec and the interim work products and meeting with your team and stakeholders, he gives you the straight skinny:
“Listen, there is simply no chance of finishing before the first of next year—zero. The most likely date for delivery of an acceptable product is the beginning of next April. Even that date is not particularly bankable. You probably don’t want to publish any delivery date before May 1. At least with a date in May or later, you’ll have a better than fifty-fifty chance of making it. If you want a date you’ll have virtually zero chance of missing, you’ll have to go all the way out to the end of next December.”
You called in a consultant because you were uncertain about when the project would be done, but the consultant has shown himself to be somewhat uncertain as well. The difference between your uncertainty (clueless) and his (described by the preceding paragraph) is that he put definite bounds on his.
Same Idea in Picture Form
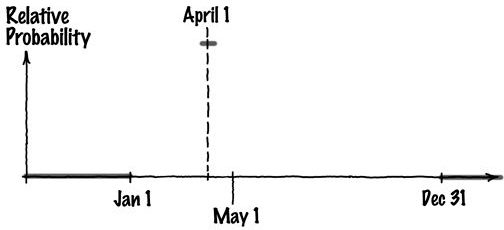
Let’s take the consultant’s assessment and express it as a picture. Since what he was talking about all along was probability (“no chance of delivery before the first of next year,” “better than fifty-fifty chance,” and so on), the picture will show certainty/uncertainty as a probability of delivery on any given date. We’ll want to extend the picture out to cover the whole range of dates between the virtually impossible to the essentially sure. So, we plot probability on the vertical and time on the horizontal. Here is the empty chart, showing the four explicitly mentioned dates:

The consultant has told us that the probability of finishing was zero for all days leading up to January 1, that needing more time beyond December 31 of next year was highly unlikely (since he was quite sure the project would be finished by then), and that the most likely date (the day with the highest probability of being the actual delivery date) was April 1. Given this, we can fill in those two ranges and the peak of the curve. Since there is no scale yet affixed to the vertical, we can place the peak arbitrarily, without being concerned yet about its precise value. That gives us the following:
All that’s left is to fill in the middle, striving to keep the area under the curve to the left of May 1 more or less equal to the area to the right (more on this later). A smooth curve that fits all these constraints looks like this:
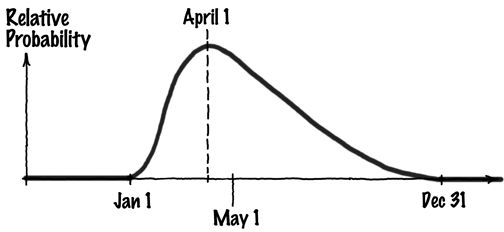
The result is a kind of uncertainty diagram called a risk diagram. Risk diagrams are the subject of Chapter 10, so you’ll find more there about their characteristics and uses. But for the present, you’ve probably already figured out most of the essentials:
• The area under the curve represents the cumulative likelihood of finishing by a given date, so if a third of the area lies to the left of April 1, that says that the probability of finishing on or before April 1 is about 33 percent.
• The area under the whole curve is 1.0, representing the consultant’s assessment that the work will be completed sometime in the period between January 1 and December 31 of next year.
What the Risk Diagram Tells Us About Today’s Common Practices
The risk diagram pictured above might show a lot more uncertainty (a bigger tolerance window around the date) than is typically declared in your organization. If you believe it to represent the truth—reality—then you still might have some concerns about who gets to see it and how it is presented. Even if absolutely no one gets to see the diagram except yourself, the exercise of quantifying your uncertainty with such a diagram can have enormous benefit.
For example, the diagram immediately helps you understand a lot of what’s been going on in the software industry over the past few decades. One common plaint that managers share with us is that “the earliest articulated date automatically becomes the deadline.” Going public with the consultant’s finding that “there is no chance of delivery before the first of next year” may land you in a position where January 1 is therefore laid down in concrete as the deadline. But on the risk diagram, the area under the curve to the left of January 1 is essentially zero:
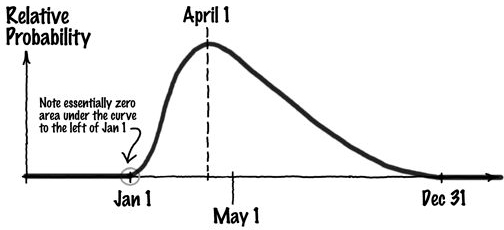
That says that the chance of delivery by the “deadline” is negligible. The pathology of setting a deadline to the earliest articulable date essentially guarantees that the schedule will be missed.
Even the strategy of picking the “most likely date” is not particularly safe, as the area to the left of the peak of the curve is barely a third. That says there is a two-thirds chance of missing the most likely date. Yes, it was most likely of all the dates, but still not very likely.
Picking the date that’s right in the center—with half the area to the left and half to the right—still only gives you one chance in two of delivering on time. In fact, picking any single date off the risk diagram is problematic; what makes a lot of sense instead is to treat the risk diagram itself as the schedule commitment. Admittedly, it has uncertainty in it, but simply picking a date and committing to it does not make that uncertainty go away; it merely conceals your uncertainty from the people who receive your commitment. The test of a grown-up organization is that managers at all levels learn to live with commitments that have explicitly stated uncertainty bounds.
The Nano-Percent Date
The intersection of the curve with the horizontal defines the first date that has a nonzero probability. But it’s not very nonzero. This intersection is what we call N, the “nano-percent date,” since delivery by that date is about a nano-percent likely.

It makes no sense at all to commit to a delivery at N, but it is an important date nonetheless. It’s important because it is something that we have an innate sense for. All of our estimating experience so far has taught us how to estimate N, but then it erroneously guided us to treat N as a delivery date. This second step is poor practice, but our hard-learned experience in figuring out the nano-percent date can and will be turned to our advantage.
Yes, a Window, but How Much of a Window?
In mature organizations, uncertainty diagrams are everywhere. They show explicitly what’s known and what isn’t. If everybody is definitely hoping to have a new product out the door by a given date, the uncertainty diagram keeps everybody focused on just how likely or unlikely that date is.
Explicitly stated uncertainty allows you to take risks. Without it, you can still take on minor risks, but serious, competent managers are never going to take on any big risk without credible assurance of just how big a risk it is. Concealing the extent of the uncertainty doesn’t help gull these managers into taking risks that they probably ought to take. Instead, it breaks down the managers’ trust in the very people they need to depend upon when the risks are high.
Now, all of that would be easy enough to swallow if the window of uncertainty could be kept small. But can it? You can certainly imagine being the world’s greatest advocate of risk diagrams if the one for your project looked like this:
Here, the window of uncertainty seems like a reasonable proportion of the optimal duration from project inception to N.
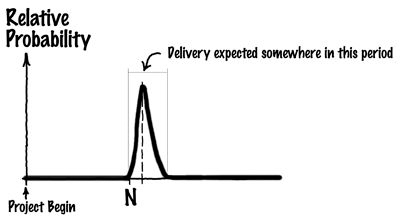
But suppose instead that your risk diagram looked like this:

What’s so unappetizing about this picture is that uncertainty is large compared to the interval from Project Begin to N.
If you’re like the rest of us software project managers, you feel comfortable when the total window is on the order of 10 to 15 percent of the time to N, and uncomfortable with anything larger than that—in fact, you’re increasingly uncomfortable as the window grows beyond 15 percent.
The rough and tumble of past projects and their politics has acculturated us to think that uncertainty windows of 10 to 15 percent of N are proper. Larger windows seem wrong, somehow undisciplined. Many managers even consider them wimpy.
However, none of this matters at all. The size of your window of uncertainty is a function of how much noise (variation) there is in your organization’s development processes, and it has nothing to do with anybody’s sense of what is proper.
Process noise is the source of deviation from one project to the next, the explanation of why some projects take longer compared to your best efforts. More or less, process noise is a quantification of the effects of past risks. The amount of noise can be empirically determined for any organization that keeps even rudimentary records of its performance. This figure establishes how much uncertainty there must be about your next projection. In other words, your past performance determines window size.
For the software industry as a whole, window size is in the range of 150 to 200 percent of N. So, for a project with N at Month 25, the tail end of the uncertainty curve will go as far out as Month 75. You’re not required to feel particularly happy about this. It’s just the way things are. Pretending otherwise won’t help.