
CHAPTER 27. Troubleshooting Tools for TCP/IP Networks
SOME OF THE MAIN TOPICS IN THIS CHAPTER ARE
Checking the Host System’s Configuration First 452
Using ping and tracert to Check Connectivity 457
Using the nslookup Command to Troubleshoot Name Resolution Issues 476
Using Network Connection Repair in Windows XP 478
Because TCP/IP allows for decentralized management—many separately managed networks are interconnected through the Internet or an intranet—tools have been developed for troubleshooting connection and configuration problems dealing with the TCP/IP protocols and services. These tools can be used for troubleshooting problems within your local network, as well as for attempting to isolate Internet-related problems. In Chapter 24, “Overview of the TCP/IP Protocol Suite,” you learned about the Internet Control Message Protocol (ICMP) and the User Datagram Protocol (UDP). These two components of the TCP/IP suite are put to use in this chapter to build tools that are helpful for diagnosing simple problems. In addition, in this chapter you will learn some other utilities that are not part of the standard TCP/IP implementation.
Checking the Host System’s Configuration First
Before you start to check the cables, network adapters, hubs, and other physical components of the network, you should check to see whether there is a problem with a computer’s TCP/IP configuration. You can do this by using the tools provided with the operating system. Information about Windows configurations can be found in Chapter 24. Linux or Unix users should check their specific documentation and man (manual) pages for information on how to configure networking on a system. This configuration information can usually be entered during the installation of the operating system, but you may find it necessary to change it. For example, if you move the computer to a different subnet you will have to make changes. Check to be sure that the system has an IP address that uses the same network number as the other computers on the local subnet. Also check to be sure that the correct subnet mask and default gateway are used. If you are using DHCP to assign configuration information, check to see that there is a DHCP server on the subnet or a DHCP relay agent operating on the subnet. If everything checks out okay, it is time to start using the basic troubleshooting tools that are available with most versions of TCP/IP.
![]() The Dynamic Host Configuration Protocol (DHCP) is covered in Chapter 28, “BOOTP and Dynamic Host Configuration Protocol (DHCP).”
The Dynamic Host Configuration Protocol (DHCP) is covered in Chapter 28, “BOOTP and Dynamic Host Configuration Protocol (DHCP).”
Using hostname and Related Commands
The hostname command is perhaps the simplest command you can use to begin checking the configuration of a host computer. On Windows systems, this command prints the name of the host computer on which it is executed. Just enter the command in the Command Prompt window.
Why would you want to use the hostname command? Because the hostname is translated into an IP address, you can use the system’s hostname to ensure that the correct IP address is associated with that name. If a Domain Name System (DNS) server shows a different IP address, you will know that you cannot reach this particular host by using its hostname. If this is the case, check to see whether the IP address is in use by another system. If not, you can change the DNS record so that the hostname and IP address are related. Other methods can also be used to translate hostnames to IP addresses. See Chapter 29, “Network Name Resolution,” for more information about this topic.
The hostname command can be used on Unix and Linux. Depending on the operating system, and how your network is configured, and the command-line parameters used, you may get just the name assigned to your computer, or the fully qualified DNS name, as well as other Unix/Linux-specific information. You will find several other related commands discussed here that can be used to return information about the name of the system, as well as network information. Whereas this command on Windows NT/2000/XP systems outputs the name of the host to the command line, the Linux version offers you many options for viewing the hostname for the system. Following is the syntax for using hostname (and a few variants that return similar information) for Linux Version 8.0:
hostname [-v] [-a] [--alias] [-d] [--domain] [-f] [--fqdn]
[-i] [--ip-address] [--long] [-s] [--short] [-y] [--yp]
[--nis] [-n] [--node]
hostname [-v] [-F filename] [--file filename] [hostname]
domainname [-v] [-F filename] [--file filename] [name]
nodename [-v] [-F filename] [-file filename] [name]
dnsdomainname [?-v]
nisdomainname [?-v]
ypdomainname [?-v]
![]()
[-a] [--alias]—Displays the alias name of the host if one is being used. The alias name should be found in your Domain Name System (DNS) server database.
![]()
[-d] [--domain]—Displays the name of the DNS domain.
![]()
[-F] [--file filename]—Reads the hostname from the specified file filename. Note that the hostname file is now considered a relic of the past, but it still serves a useful purpose for some specific situations, as discussed in Chapter 30.
![]()
[-f] [--fqdn] [--long]—Displays the FQDN (fully qualified domain name). A FQDN consists of a short hostname and the DNS domain name found in the /etc/hosts file.
![]()
[-h] [--help]—Prints a usage message and exits. This is all you have to remember if you don’t carry this book around with you!
![]()
[-I] [--ip-address]—Displays the IP address(es) of the host.
![]()
[-s] [--short]—Displays the short hostname. That is, instead of the FQDN, only the first part of the hostname (before the first period character) is displayed.
![]()
[-V] [--version]—Prints version information on standard output and exits.
![]()
[-v] [--verbose]—Causes the command to produce additional output.
![]()
[-y] [--yp] [--nis]—Displays the NIS (or the older YP) domain name. If a parameter is given (or --filename), then root also can set a new NIS domain.
As you can see, the Linux command is a little more complex than the Windows version. The following related commands can also be used: domainname, nisdomainname, and ypdomainname. Each will give you the hostname that is stored in the NIS (Network Information System) database.
Note
NIS stands for Network Information System. Formerly known as Yellow Pages (YP), the name was changed due to a trademark dispute. For more information on managing users with YP and NIS, see Chapter 38, “Managing Unix and Linux Users.”
Using ipconfig and ifconfig to Check Host Configurations
The ipconfig command is useful for checking the TCP/IP configuration of Windows workstations or servers. A similar command on Unix and Linux workstations is ifconfig. On Windows 95/98 or Windows Me systems, you can use the winipcfg command.
ipconfig for Windows
Simply enter the ipconfig command at the command prompt.
Using the ipconfig command with no parameters displays network configuration information about each adapter on the system, as well as for PPP (dialup or VPN) connections. The basic information includes the following:
![]() Subnet mask
Subnet mask
![]() Default gateway
Default gateway
![]() DNS server information
DNS server information
![]() Windows domain
Windows domain
Here’s an example of the output that ipconfig generates:
C:Documents and SettingsMark>ipconfig
Windows IP Configuration
Ethernet adapter Local Area Connection 3:
Connection-specific DNS Suffix . :
IP Address. . . . . . . . . . . . : 192.16.0.100
Subnet Mask . . . . . . . . . . . : 255.255.255.0
Default Gateway . . . . . . . . . : 192.16.0.1
If the adapter is not connected to a network cable, you will see the following information instead of DNS and other network information:
Media State . . . . . . . . . . . : Media disconnected
If the adapter lists an IP address of 0.0.0.0, it does not have a valid IP address. If the network adapter receives an IP address from a DHCP server, make sure the network cable is properly connected to the adapter, and then use the ipconfig /release and ipconfig /renew commands in succession to obtain a new address. If the network adapter uses a fixed (user-assigned) IP address, open the network adapter’s properties sheet (in Network Connections or Network Neighborhood) and manually configure the network adapter’s IP address and other TCP/IP configuration information.
Each network adapter in a system (including wireless adapters) has a separate section listed in the output for ipconfig.
With the /all parameter, you also can obtain the hardware (MAC) address and DHCP information for each network adapter in a computer. You also can use this command to renew or release DHCP configuration information to attempt to reconfigure the computer with updated information.
Here’s an example:
C:Documents and SettingsMark>ipconfig /all
Windows IP Configuration
Host Name . . . . . . . . . . . . : tiger-athlon
Primary Dns Suffix . . . . . . . :
Node Type . . . . . . . . . . . . : Mixed
IP Routing Enabled. . . . . . . . : No
WINS Proxy Enabled. . . . . . . . : No
Ethernet adapter Local Area Connection 3:
Connection-specific DNS Suffix . :
Description . . . . . . . . . . . : Linksys LNE100TX(v5) Fast Ethernet Adapter #2
Physical Address. . . . . . . . . : 00-20-78-0D-D5-BF
Dhcp Enabled. . . . . . . . . . . : Yes
Autoconfiguration Enabled . . . . : Yes
IP Address. . . . . . . . . . . . : 192.16.0.100
Subnet Mask . . . . . . . . . . . : 255.255.255.0
Default Gateway . . . . . . . . . : 192.16.0.1
DHCP Server . . . . . . . . . . . : 192.16.0.1
DNS Servers . . . . . . . . . . . : 63.64.9.11
63.64.9.19
Lease Obtained. . . . . . . . . . : Monday, September 26, 2005 11:08:02 PM
Lease Expires . . . . . . . . . . : Tuesday, September 27, 2005 11:08:02 PM
The syntax for Windows is
ipconfig [/? | /all | /release [adapter] | /renew [adapter]
| /flushdns | displaydns | /registerdns
| /showclassid adapter
| /setclassid adapter [classidtoset] ]
![]()
/all—Causes a verbose display of all the configuration information that the ipconfig utility has access to, including multiple adapters.
![]()
/release [adapter]—Releases an IP address that was configured using DHCP. If you use just the /release qualifier by itself, the system will attempt to release IP configuration for all adapters on the computer. Otherwise, you can use the syntax of /release name to release the IP configuration for a specific adapter with the specified name. Note that you can use wildcards, such as /release "wireless*" to release all wireless addresses.
Note
You can see the adapter names with the unqualified ipconfig command. For example, if an adapter is listed as “Ethernet adapter Local Area Connection,” you could use ipconfig /release "Local*". Note that under Windows 2000 and newer, you can also view the adapter names by right-clicking Network Neighborhood and selecting Properties from the pop-up menu. The adapter names are the names of the icons. If you use the Details view, the name is conveniently listed under the Name column.
![]()
/renew [adapter]—Renews an IP address that was configured using DHCP. If you use just the /renew qualifier by itself, the system will attempt to renew IP configuration for all adapters on the computer. Otherwise, you can use the syntax of /renew name to renew the IP configuration for an adapter with the specified name. As with /release, you can use wildcards, such as /renew "wireless*" to renew all wireless addresses.
![]()
/flushdns—Purges the DNS resolver cache.
![]()
/registerdns—Refreshes all leases granted by DHCP for the adapter and reregisters DNS names.
![]()
/displaydns—Shows the contents of the DNS resolver cache.
![]()
/showclassid [adapter]—Displays all the DHCP class IDs allowed for adapter.
![]()
/setclassid [adapter] [classidtoset]—Modifies the DHCP class ID. DHCP class IDs are covered in more detail in Chapter 28.
Tip
When a Windows system obtains a translation (hostname to IP address) from a DNS server, it stores the record in a cache for a short period. When the name is used again, the TCP/IP stack will first consult the cache to see whether the record exists, thus providing a quicker response than if a DNS server is queried. To keep the cache set to a reasonable size, each record is flushed from the cache after a Time to Live (TTL) value for the record expires. If you have made a change to a DNS record, you can use the ipconfig /flushdns command to remove all records from the cache so that the DNS server will again be consulted, and the cache will begin to store new records. The ipconfig /displaydns command will show you the contents of the cache, which can be helpful when you are not sure whether the cache or DNS server is being consulted for the name translation.
Obviously, this command is extremely useful when you are trying to solve problems related to DNS and DHCP functions. For example, you can use /release and /renew to see whether you are having problems obtaining configuration information from a DHCP server. If you are unable to renew the IP address with the /renew switch, there’s a problem with your connection to the DHCP server and you should check the functionality of the network adapter, cable, and any intermediary network devices up to and including the DHCP server.
You can use the DNS qualifiers when you’ve made configuration changes and want to keep the local cache updated or register the new configuration information with a DNS server. The /all qualifier shows all the output to which the command has access and is frequently used to scan for problems. To see all the output without having it scroll off the screen, use the command in the form of ipconfig /all | more. You can also use the command ipconfig /all > filename to send the information to a file so that you can print it, or save the information for use in the future.
The quantity of information you can show is useful when constructing a spreadsheet or other document for help-desk use. One method that will help you keep up with current configuration information is placing the following command in a login script or startup file:
ipconfig /all > network drive%computername%.config
The %computername% environment variable is replaced with the computer name that is assigned to the system and a text file is created. By placing the output file on a network drive, you can have it available for use by administrative or help-desk staff. The server that provides the file share network drive can use a script file appropriate for that operating system to parse the information and store it in a database.
Tip
A common method for importing information into a spreadsheet is to create a comma-delimited file. If you use Windows, Unix, Linux, or some other operating system, it is easy to take the information provided by the ipconfig command and parse it, and separate the important information by inserting commas. Your script file can then be used to load the information into a spreadsheet on a periodic basis.
ifconfig for Unix and Linux
On Unix and Linux systems, ifconfig is a very powerful command. You can use it to display IP configuration information, and also to make changes to the configuration. This command is used in startup files to enable network adapters or provide addressing information, among other items. Online you can use this command to make changes to the configuration.
Some versions of Unix allow you to use this command to view statistics or configuration information for each network adapter. Others simply print a short list of the same, and are mainly used to configure the adapters. To determine the options available in your version of Unix or Linux, enter man ifconfig at a Unix or Linux shell prompt to view the man (manual) page for the ifconfig command.
Although the ifconfig command is used during the boot sequence to perform the initial configuration for network adapters, after the system is up and running only the root account can use this command to change the configuration. For troubleshooting, it is a quick way to get the information you need in order to determine whether the system was properly configured. For those unfamiliar with Unix, the superuser is just another term for the user account that has full system privileges and can perform all tasks. For Unix/Linux this account is named root.
Tip
The root account on Unix/Linux machines is a powerful account. Consider it to be the same thing as the Administrator account on Windows computers. It is a good idea to use this account only when absolutely necessary, because it’s possible to make a mistake if you use the account as your everyday login. Instead, for Unix/Linux systems, an ordinary user account should be used. When you need to gain the privileges that the root account provides, use the su command. This command will prompt you for the password to the root account and allow you to make changes on an as-needed basis. To exit back to your normal account, use Control-D (for Solaris Unix). Check the documentation for your Unix/Linux system to see whether another character combination is used to exit the root environment. You can also specify other commandline options for the su command, such as another user account to use, and the shell to use, but these are beyond the scope of this book and will vary from one version of Unix/Linux to another.
To simply display the current configuration information, you can execute the command followed by the network interface name. For example:
ifconfig –le0
This command will show less information than the Windows ipconfig command, but other commands described later in this chapter (such as netstat) will enable you to obtain additional configuration information. The output from this command will typically show you the following:
![]() The IP address assigned to the interface
The IP address assigned to the interface
![]() Whether the interface is up and running
Whether the interface is up and running
![]() The mtu—maximum transmission unit (usually 1,500 bytes because this is the maximum for Ethernet transmissions)
The mtu—maximum transmission unit (usually 1,500 bytes because this is the maximum for Ethernet transmissions)
![]() The network subnet mask (in hexadecimal format)
The network subnet mask (in hexadecimal format)
![]() The broadcast address
The broadcast address
To display information about all network adapters in a computer that uses multiple adapters, use this command:
ifconfig –a
You do not need to specify the adapter names using this form of the command.
Note
Keep in mind that Unix and Linux are case-sensitive. Enter all commands discussed in this chapter in lowercase. If you use uppercase for a command you will get an error. You can, however, use upper- or lowercase commands for such things as filenames. When you use a command that uses the filename, though, you must specify the filename exactly as you created it.
As always, check the documentation for your Unix/Linux system (the man pages) to ensure that you have the correct syntax, because it may vary from that shown previously. The capability to set routing metrics and mark an adapter as either up (running) or down (not running) can be useful when the Unix or Linux box is being used for routing functions or is part of a proxy firewall solution.
Using ping and tracert to Check Connectivity
Two of the most basic commands that can be used to test connectivity on a TCP/IP network are the ping command and the tracert command. In this section we’ll look at how these commands work and the kind of troubleshooting information you can gain from their use.
The ping Command
The ping command is a good place to start your troubleshooting efforts. The name of this command might not make a whole lot of sense at first glance. This utility is used to test connectivity between two systems on the network. ping uses the ICMP protocol (which, you’ll remember, uses UDP packets for transport) to exchange packets with the remote system. This utility was originally developed by Mike Muuss and operates in a simple manner. It uses the ICMP protocol to send UDP messages to an address (ECHO REQUEST) and waits to hear for a reply (ECHO REPLY). The remote system sends the reply packets back to their source, and the round-trip is determined. Thus, ping is used to “grope” around trying to find out whether it can communicate with another system on the network. You also can think of ping as a sonar type of mechanism.
![]() ICMP uses UDP datagrams. UDP stands for the User Datagram Protocol, and you can learn more about this protocol (as well as ICMP) in Chapter 24, “Overview of the TCP/IP Protocol Suite.”
ICMP uses UDP datagrams. UDP stands for the User Datagram Protocol, and you can learn more about this protocol (as well as ICMP) in Chapter 24, “Overview of the TCP/IP Protocol Suite.”
Figure 27.1 shows the layout of the ICMP ECHO REQUEST and ECHO REPLY packets. If the message type is an ECHO REQUEST, the first field of the ICMP (message type) packet will have a value of 8. If the message type is an ECHO REPLY, this field will contain a zero.
Figure 27.1. Layout of the ICMP ECHO REQUEST and ECHO REPLY packets.
Using ping on Unix and Linux Systems
The way that ping functions is quite simple. The sequence number field is first set to zero, and then incremented for each packet sent. On most Unix and Linux implementations, the identification field is set to the process ID of the process sending the ping ECHO REQUEST message. This can vary with other operating systems, but the identifier is important and is used to uniquely identify the returned packets in case more than one user on a machine is using the utility at the same time. When the receiving computer gets the ECHO REQUEST message, it sends back a reply containing the identifier and the sequence number. In this way the receiving machine can tell whether all packets are returned and also, more important, tell you if packets are being dropped or returned out of order. These conditions can indicate problems on the network. Another possibility is that the remote system is working at a high capacity and cannot respond to all the ECHO REQUEST messages in a timely manner.
The ping utility tells you how long (in milliseconds) the round-trip took, and it tells you when packets do not make it back successfully. To determine the round-trip time, the utility stores the time that it sends the initial request packet in the optional data portion of the packet and compares it to the current time when the reply packet is received. The basic program also prints a Time to Live (TTL) value, which is typically decremented by at least one second for each host or router through which the packet passes.
Occasionally you will notice that the round-trip time value declines for subsequent ping requests. This is because the destination machine (or the gateway router) isn’t currently in the local ARP table, and it takes a few milliseconds for arp to determine the hardware address for sending out the first packet. If you ping by using a hostname instead of a TCP/IP address, it might take a few seconds for the ping utility to contact a DNS server and resolve the hostname to the IP address.
When you’re using ping, it’s best to first use it to ping the local interface, or the loopback address (127.0.0.1, or 120.0.0.1 on some older systems). The loopback address is used in TCP/IP stacks to enable you to test whether the local stack is functioning correctly. This is a reserved IP address that cannot be used on the Internet. If you can’t ping the local system’s own IP address, you might have a configuration problem. If you can’t ping the loopback address, you might have a problem with the TCP/IP stack or perhaps the network adapter.
In RFC 2151, “A Primer on Internet and TCP/IP Tools and Utilities,” the basic ping syntax is defined as follows:
ping [-q] [-v] [-R] [-c Count] [-i Wait] [-s PacketSize] Host
![]()
-q—Quiet output; nothing is displayed except summary lines at startup and completion.
![]()
-v—Verbose output. Lists ICMP packets that are received in addition to echo responses.
![]()
-R—Record route option; includes the RECORD_ROUTE option in the ECHO REQUEST packet and displays the route buffer on returned packets.
![]()
-c Count—Specifies the number of ECHO REQUESTs to be sent before the concluding test (default is to run until interrupted with a Ctrl+C).
![]()
-i Wait—Indicates the number of seconds to wait between sending each packet (default = 1).
![]()
-s PacketSize—Specifies the number of data bytes to be sent; the total ICMP packet size will be PacketSize + 8 bytes due to the ICMP header (default = 56, or a 64-byte packet).
![]()
Host—Host IP address or hostname of target system.
An older syntax for ping that you might find is
ping [-s] {IP_address|hostname} [PacketSize] [Count]
When using the -s option, the ping command will send a message to the target every second. This can be helpful when you are monitoring an intermittent problem and want to be able to watch in real time whether a connection can be made.
The syntax for ping can vary depending on the operating system, and even among different variants of Unix. However, its basic use is simply ping hostname or ping address. The syntax for a Linux ping follows:
ping [-R] [-c number] [-d] [-I seconds] host
The options include the following:
![]()
-c number—Specifies the number of ICMP ECHO_REQUESTs that are sent.
![]()
-d—Causes ping to send packets as fast as they are echoed back from the remote system, or up to 100 times per second. Exercise caution when using this option regularly to avoid generating high volumes of traffic on a busy network.
![]()
-I seconds—Enables you to specify the number of seconds between each packet sent; the default is 1 second. This option cannot be used with the -R option.
![]()
-R—Records the route taken by the packet.
Using ping on Windows Systems
The ping command has a much different syntax when used with the Windows operating systems (both servers and clients):
ping [-t] [-a] [-n count] [-l size] [-f] [-i TTL] [-v TOS]
[-r count] [-s count] [[-j host-list] | [-k host-list]
[-w timeout] destination-list
The options include the following:
![]()
-t—Continues pinging until explicitly stopped by Ctrl+C. Statistics are displayed after you stop the command.
![]()
-a—Resolves addresses to hostnames.
![]()
-n count—Specifies the number of ICMP ECHO REQUEST packets to send.
![]()
-l size—Sends buffer size.
![]()
-f—Sets the don’t fragment flag in the packet. Useful to determine whether a device is changing the packet size between nodes.
![]()
-i TTL—Time to Live value.
![]()
-v TOS—Type of Service.
![]()
-r count—Displays route for count hops.
![]()
-s count—Displays a timestamp for each hop.
![]()
-j host-list—Loose source route along host-list.
![]()
-k host-list—Strict source route along host-list.
![]()
-w timeout—Timeout value to wait for each reply (in milliseconds).
As you can see, the syntax can vary widely between implementations, as can the usefulness of ping as a diagnostic tool.
Following is an example of a simple use of the ping command:
G:>ping www.activewebhosting.com
Pinging www.activewebhosting.com [24.120.30.50] with 32 bytes of data:
Reply from 24.120.30.50: bytes=32 time=97ms TTL=105
Reply from 24.120.30.50: bytes=32 time=95ms TTL=105
Reply from 24.120.30.50: bytes=32 time=90ms TTL=105
Reply from 24.120.30.50: bytes=32 time=89ms TTL=105
Ping statistics for 24.120.30.50:
Packets: Sent = 4, Received = 4, Lost = 0 (0% loss),
Approximate round trip times in milli-seconds:
Minimum = 89ms, Maximum = 97ms, Average = 92ms
In this example, the computer is responding well. There was 0% packet loss in the transmissions, and the reply time was about 100 milliseconds. The size of the packet sent was 32 bytes. This simple usage of the ping command can tell you right away if there is a problem between two nodes on the network. It might be a broken cable, possibly a router configuration issue, or some other problem. But if you start with ping you’ll find out right away whether there is an IP pathway between the two network nodes. If there is, you can begin to use other tools to explore why certain applications are not functioning.
Note
An inability to ping a remote node is not a guarantee that the node is disconnected physically from the network. In other words, you cannot simply assume that a ping failure indicates a wiring problem. It might be that an intermediary device, such as a switch, router, or gateway, is malfunctioning. This is one of the reasons you need to keep a detailed map of your network. When you have to troubleshoot you can check not just the end nodes, but also every device and cable along the path between them.
Troubleshooting a Network Connection with the ping Command
For basic connectivity troubleshooting, use the following steps:
1. Ping the local system’s own numeric IP address.
2. Ping the system’s hostname. The ping command resolves the hostname to an address before attempting to send packets to the hostname. If the address that ping resolves isn’t the address you think it should be for your computer, you might need to check with your computer’s configuration. You might have configured the local computer with one IP address, yet the entry in the DNS (Domain Name System) server has your hostname associated with a different address. For more information about checking the DNS server, see “Using the nslookup Command to Troubleshoot Name Resolution Issues,” later in this chapter. You could also check the local hosts file for the computer to see whether you’ve defined your hostname in that file with an incorrect address. However, with only a few exceptions, most computers today use DNS for name resolution, and the hosts file is becoming a relic of the past.
3. Ping another system that you know is on the local subnet. If that works, you know you can communicate with members of the local broadcast domain.
4. Ping the default gateway (also called the default route). This is the router or other device that connects your subnet to other networks. If you can’t ping the default gateway, there are two possibilities to consider. First, you might have a wrong address for the subnet you are attached to. Check the computer’s configuration to be sure you have used the correct address for the router or other host acting to forward packets for the local subnet. Second, you might have a problem with the actual gateway itself. Try pinging it from another computer to see whether that works. Of course, if the router or host that provides the default route is in close physical proximity, you can check it to see whether there is a problem. For more information about checking router problems, see Chapter 10, “Routers,” and Chapter 33, “Routing Protocols.”
5. Ping a system on a remote subnet. If this action is successful, your connectivity works through the default gateway to the target system, and your issue may be with the original target system, with the routing to a particular subnet, or with equipment on the other side of your local connection.
As you can see from these steps, it is possible to use ping to help track down various problems that can occur, from simple connectivity to name resolution. Using ping as your first step can help point you in the right direction should other tools need to be used to continue the troubleshooting effort. For example, if you can ping the local broadcast domain members, and if you can ping the default gateway, the next step is to attempt to ping hosts outside your network, perhaps on the Internet.
Note that the network administrator may disable this functionality if your company institutes a good firewall security policy. Many times the administrator for the firewall will prevent outgoing ICMP ECHO REPLY messages to keep intruders from outside the network from finding out information about computers protected by the firewall. For more information about allowing the ping utility to work through firewalls, see Chapter 45, “Firewalls.”
Note
The ping utility serves an important function in troubleshooting TCP/IP network connectivity. However, the Ping of Death, which you’ve probably heard about, does not. This attack method uses a program that creates ICMP packets that are larger in size than is allowed. If the software on the receiving end is not patched, or is a new version, it might accept this larger-than-life packet, causing part of the program memory to be overwritten as the data is stored in the allocated buffer and, then, beyond. For more information about allowing the use of ping in a secure environment, see Chapter 44, “Security Issues for Wide Area Networks.”
The traceroute Command
If you find that you cannot successfully ping a host that lies past your default gateway router, try using the traceroute (tracert for some operating systems, such as Windows) command. This command enables you to see every host that a packet passes through to get to the destination. Eventually you will find that the traceroute program cannot get past one of the routers in the path, and it is from there you should start investigating the problem. You can use this information to locate a troublesome router or other device along the network path.
If you’ve established the fact that you can’t get here from there, or that the response time is bad when using ping, try using the tracert command to determine the path that is being taken from your system to the target system. This diagnostic command is similar to ping in that it uses ICMP messages to try to locate each device through which a packet passes to reach its destination. This can provide useful information if you are not sure about the route being taken when you are trying to diagnose a sluggish response from ping. It also can help you find where along the network path the network is failing by showing each hop up until it fails if you can’t get to the target system.
For most Unix and Linux operating systems, the command to trace a route through the network is traceroute. From Windows 98 to Windows 2003, a version of this command is called tracert. No matter what the actual command name, this utility can determine each route through the network by setting the TTL (Time to Live) value in the packet, hoping to receive an ICMP TIME_EXCEEDED message from each hop the data packet takes on its path. Remember that the TTL value is the allowable number of hops a packet can take before it is discarded by IP. Thus, by setting this value, starting with one and incrementing by one for each pass, traceroute (or tracert) can get the TIME_EXCEEDED ICMP message from each router or other device through which the packet must pass. For each attempt, three packets are sent to average the time that it takes to get to that point in the network. The basic function of this utility appears in Figure 27.2.
Figure 27.2. The tracert utility manipulates the TTL value to discover host systems along a particular route.
In this figure, you can see that Computer A generates a series of ICMP ECHO REQUEST messages and sends them to Computer D. When the first packet is sent out, the TTL value is set to 1. It is decremented to zero at the first router, and an ICMP TIME EXCEEDED ICMP message is sent back to Computer A. Computer A then sends out another ICMP ECHO REQUEST packet, but this time sets the TTL value to 2. Thus, the first router passes the packet to the next router after decrementing the TTL value from 2 to 1. The second router looks at the TTL value of 1 and decrements it to zero, and once again an ICMP TIME EXCEEDED message is sent back to Computer A.
As you can see, intermediate routers drop packets when the TTL value expires. An ICMP TIME_EXCEEDED message is sent back to Host A, until the TTL value has been set to a value sufficient to reach the destination Computer D. Thus, Computer A can determine the number of hops it took to reach Computer D, assuming that it is successful in getting there.
The original traceroute utility sets the port in the UDP header to an “unreachable” port. Thus, when the TTL value is finally incremented enough so that the ICMP packet actually reaches the target system, it will return the ICMP DESTINATION UNREACHABLE message, as you can see in Figure 27.2. If the last hop you see in the traceroute output is the destination, the program has displayed all the hops between your system and the destination system. This can vary depending on the implementation of the utility.
If the last hop that is returned by this command is not the target system, you should begin investigating the system that does show up as the last hop.
Note
Various implementations of the traceroute utility might function differently than the method just described here. Some use the function of the Record-Route option in IP to attempt to trace the route. However, because the amount of space to record routes is limited, and because the Internet is much larger than it was a few years ago, the UDP method that manipulates the TTL value is probably a more reliable way to implement this utility.
The basic syntax for the traceroute command as given in RFC 2151 is
traceroute [-m #] [-q #] [-w #] [-p #] {IP_address|host_name}
![]()
-m—The maximum allowable TTL value, measured as the number of hops allowed before the program terminates (default = 30).
![]()
-q—The number of UDP packets that will be sent with each Time to Live setting (default = 3).
![]()
-w—The amount of time, in seconds, to wait for an answer from a particular router before giving up (default = 5).
![]()
-p—The invalid port address at the remote host (default = 33434).
The syntax for using tracert in Windows NT/2000/XP and Windows 2003 Servers is
tracert [-d] [-h maximum_hops] [-j host-list] [-w timeout] target_name
The more useful options include the following:
![]()
-d—Do not resolve hostnames to addresses.
![]()
-h maximum_hops—Maximum number of hops to search for target.
![]()
-j host-list—Loose source route along host-list.
![]()
-w timeout—Wait timeout milliseconds for each reply.
Of course, target name is the host computer that you are executing the tracert command for.
The following is an example of the output from executing the Windows version of tracert:
D:> tracert www.bellsouth.net
Tracing route to www.bellsouth.net [205.152.0.46]
over a maximum of 30 hops:
1 231 ms 200 ms 220 ms envlnjewsap02.bellatlantic.net.
![]() [192.168.125.189]
[192.168.125.189]
2 261 ms 160 ms 160 ms 192.168.125.158
3 180 ms 200 ms 181 ms 206.125.199.71
4 181 ms 160 ms 180 ms Hssi4-1-0.border2.teb1.IConNet.NET.
![]() [209.3.188.201]
[209.3.188.201]
5 241 ms 180 ms 180 ms POS10-0-0.core2.teb1.IConNet.NET.
![]() [204.245.71.221]
[204.245.71.221]
6 180 ms 181 ms 280 ms Hssi0-0-0.peer1.psk1.IConNet.NET.
![]() [204.245.69.174]
[204.245.69.174]
7 180 ms 181 ms 180 ms BR1.PSK1.Alter.net. [192.157.69.60]
8 180 ms 181 ms 240 ms Hssi0-1-0.hr1.nyc1.alter.net.
![]() [137.39.100.2]
[137.39.100.2]
9 180 ms 181 ms 200 ms 101.ATM2-0.XR2.NYC1.ALTER.NET.
![]() [146.188.177.90]
[146.188.177.90]
10 240 ms 181 ms 200 ms 194.ATM3-0.TR2.EWR1.ALTER.NET.
![]() [146.188.178.230]
[146.188.178.230]
11 301 ms 200 ms 200 ms 105.ATM6-0.TR2.ATL1.ALTER.NET.
![]() [146.188.136.37]
[146.188.136.37]
12 241 ms 220 ms 180 ms 198.ATM7-0.XR2.ATL1.ALTER.NET.
![]() [146.188.232.101]
[146.188.232.101]
13 201 ms 200 ms 220 ms 194.ATM11-0-0.GW2.ATL1.ALTER.NET.
![]() [146.188.232.69]
[146.188.232.69]
14 321 ms 200 ms 220 ms bs2-atl-gw.customer.alter.net. [157.130.69.106]
15 220 ms 220 ms 221 ms 205.152.2.178
16 200 ms 281 ms 200 ms 205.152.3.74
17 220 ms 220 ms 201 ms www.bellsouth.net. [205.152.0.46]
Trace complete.
As you can see, you can gain a lot of information about how your network functions by using this command. The three columns show how long it took each of the three attempts to reach the particular node for that hop. An asterisk character that is displayed in any of these time columns indicates that the ICMP packet was not returned. The hostname and address are displayed by default. If the command fails at any point, you can start tracing the network fault at the last successful hop to determine where the fault lies.
If you are using a Linux system, the following syntax may prove a useful reference. Because this is a Linux system, the command is not tracert, but instead is traceroute.
traceroute [ -dFInrvx ] [ -f first_ttl ] [ -g gateway ]
[ -i iface ] [ -m max_ttl ] [ -p port ]
[ -q nqueries ] [ -s src_addr ] [ -t tos ]
[ -w waittime ] [ -z pausemsecs ]
host [ packetlen ]
Options for the preceding commands are listed here:
![]()
-d—Starts debugging at the socket level.
![]()
-f first_ttl—Sets the TTL value for the first outgoing ICMP packet.
![]()
-F—Suppresses setting the “don’t fragment” bit.
![]()
-g—Specifies a loose source route gateway (8 maximum hops).
![]()
-i iface—For a computer with more than one network adapter, specify the network interface to obtain the source IP address for outgoing probe packets.
![]()
-m—Use this option to set the maximum TTL value used by outgoing packets. By combining this option with the option –f, you can specify numeric boundaries when trying to pinpoint a specific area of failure.
![]()
-n—Display address of each hop in numerical format instead of looking up hostnames. This can save a little time, especially when you first use the command to determine that there is a problem. Next you can allow for printing of hostnames (limiting output by possibly using other options to limit the range of routers involved) to locate a specific network node that may be causing a problem.
![]()
-P port—Use this to set the port number to use. The default is 33434.
![]()
-r—This option will bypass routing tables and send packets directly to a host on a network directly attached to the current network.
![]()
-s src_addr—Sets the source address for the outgoing ICMP packet.
![]()
-t—The type-of-service value for the ICMP packets can be set using this option. The value is a decimal number from zero to 255 (the default is zero). This might be useful in trying to determine which type of service would best handle network traffic. However, this functionality may be of lesser importance today, because of not only the new IP services offered on client and server operating systems, but also new features offered by routers, broadband modems, and so on.
![]()
-v—You guessed it. As with most other Unix/Linux commands, this causes additional text to be output during the execution of this command. Useful when debugging. Annoying when doing a quick exam!
![]()
-w—This option sets the number of seconds waiting for a response to a traceroute probe packet. The default is 5 seconds.
![]()
-z—Use this to set the time to pause between sending out ICMP packets (in milliseconds).
If you have a map of your network, you can check to determine whether the best path is being followed when using the traceroute utility—maybe a primary router is not up and running, and a backup path with a lower bandwidth is sending the packet on a different route through the network. If you use this command on a regular basis and keep an output of the information you see, you can learn to notice when a particular router used by your ISP (or possibly in your own network) is having problems.
By using both ping and tracert, you can usually discover problem areas in your network and then plan steps to remedy the problem. If the problem lies outside your network, that is, with your ISP or some other router on the Internet, resolving the situation can be more problematic. However, for troubleshooting the internal corporate network, these commands should prove very useful for basic configuration and connectivity problems.
The netstat and route Commands
On Unix, Linux, and Windows systems, the netstat command is used to obtain statistics about the TCP/IP protocols that are in use on the computer. This command is most useful when you are trying to debug network problems. The route command is also useful because it can be used to view or manipulate the routing table on a computer.
Using the netstat Command on Windows Operating Systems
The syntax for netstat for Windows NT/2000/XP and Windows 2000/2003 Servers is
netstat [-a] [-e] [-n] [-s] [-p protocol] [-r] [interval]
![]()
-a—Displays all connections and listening ports.
![]()
-e—Displays Ethernet statistics. This can be combined with the -s option.
![]()
-n—Displays addresses and port numbers in numerical form.
![]()
-p protocol—Shows connections for the protocol specified by protocol; protocol can be TCP or UDP. If used with the -s option to display per-protocol statistics, protocol can be TCP, UDP, or IP.
![]()
-r—Displays the routing table.
![]()
-s—Displays per-protocol statistics. By default, statistics are shown for TCP, UDP, and IP standard and v6 versions. The -p option can be used to specify a subset of the default.
![]()
interval—Redisplays selected statistics, pausing interval seconds between each display. Press Ctrl+C to stop redisplaying statistics. If this is omitted, netstat prints the current configuration information once.
Windows XP and Windows Server 2003 add the following switches:
![]()
-b—Lists the programs used to set up each connection or listening port. Lists protocol (TCP or UDP), local address and port number, foreign address and port number, state, and process identifier (PID).
![]()
-o—Displays the process identifier (PID) associated with each connection.
![]()
-x—When used with –b, -v lists the sequence of programs used to create a network connection or listening port for all programs. This option might take several seconds to complete. When used alone, it lists current local-to-foreign port connections by protocol type and their status.
You can investigate a lot about the protocols operating on your system by using the netstat command, as you can see from the preceding syntax options. For example, the command
netstat -r
displays the routing table that is maintained on the current host. (Note that you can also use the command route print to display the routing table information. See Chapter 33 for more information about using the route command and its command-line options.) Following is an example of the routing table as shown using netstat -r and an explanation of the data that is shown using the Windows 2003 Server version of this command:
IPv4 Route Table
===========================================================================
Interface List
0x1 ........................... MS TCP Loopback interface
0x10003 ..00 04 5a 42 53 99 ..LNE100TX Fast Ethernet Adapter(LNE100TX v4)
===========================================================================
===========================================================================
Active Routes:
Network Destination Netmask Gateway Interface Metric
0.0.0.0 0.0.0.0 192.168.1.1 192.168.1.201 20
127.0.0.0 255.0.0.0 127.0.0.1 127.0.0.1 1
192.168.1.0 255.255.255.0 192.168.1.201 192.168.1.201 20
192.168.1.201 255.255.255.255 127.0.0.1 127.0.0.1 20
192.168.1.255 255.255.255.255 192.168.1.201 192.168.1.201 20
224.0.0.0 240.0.0.0 192.168.1.201 192.168.1.201 20
255.255.255.255 255.255.255.255 192.168.1.201 192.168.1.201 1
Default Gateway: 192.168.1.1
===========================================================================
Persistent Routes:
None
In this listing you can see the basic routing table used by this computer when you issue this command. If you become familiar with what the routing table should look like, this command might help you focus troubleshooting efforts and quickly spot a problem due to an incorrect routing table entry. Another important thing to remember is that there are many virus programs that manipulate the local host’s routing table. On servers, check this table often.
Note
The –o option used by the Windows XP and Windows Server 2003 version of netstat is also available on many Linux computers.
Each line in this display starts with a destination address. When a decision is being made as to where to send a packet, this table is consulted to see whether one of these destination addresses matches the destination address of the packet in question. In the first line, the address of 0.0.0.0 might not seem to make sense. This is the entry, or the default gateway. That is, if a packet cannot be routed to its destination using any of the remaining entries in the route table, it will be sent to this address.
The second column shows the netmask for this route entry. Like a subnet mask, this mask is used to mask out portions of the destination address when a routing decision is to be made. The netmask is converted to binary. When the decision is being made as to whether a packet matches the destination address, the portions of the destination address that are in the same position as a 1 must match the packet’s destination address exactly. A netmask of 255.255.255.255 is a string of 32 ones in binary. This is used for a host address, and the packet must match the address exactly to be routed by this entry.
The next column shows the gateway. Packets that match this entry will be sent to this address. The next column—Interface—is the address of the network card or PPP adapter that the packet will be sent through. The last column—Metric—shows the number of hops the packet will take to reach its final destination.
The output for the Windows 2000/Server 2003 command is similar, but presented in a different format:
C:>netstat -r
Route Table
===========================================================================
Interface List
0x1 ........................... MS TCP Loopback interface
0x2 ...00 08 c7 ba 23 7f ...... Compaq Ethernet/FastEthernet or Gigabit NIC
===========================================================================
===========================================================================
Active Routes:
Network Destination Netmask Gateway Interface Metric
0.0.0.0 0.0.0.0 140.176.187.254 140.176.187.185 1
127.0.0.0 255.0.0.0 127.0.0.1 127.0.0.1 1
140.176.187.0 255.255.255.0 140.176.187.185 140.176.187.185 1
140.176.187.185 255.255.255.255 127.0.0.1 127.0.0.1 1
140.176.255.255 255.255.255.255 140.176.187.185 140.176.187.185 1
224.0.0.0 224.0.0.0 140.176.187.185 140.176.187.185 1
255.255.255.255 255.255.255.255 140.176.187.185 140.176.187.185 1
Default Gateway: 140.176.187.254
===========================================================================
Persistent Routes:
None
Other uses for the netstat command include showing the current state of TCP/IP ports and sockets (netstat -a) or showing the ARP table (use netstat -p on Unix or the arp command on Windows NT).
To see statistics about the specific protocols—UDP, ICMP, TCP, or IP—use the netstat -s command. This is especially helpful when you are trying to diagnose connectivity problems that are intermittent or might be due to network congestion. The output is quite lengthy, so you might want to pipe the results to a text file (netstat -s > stats.txt). What follows is an example of the data you can obtain by using the -s option with this command on a Windows NT or Windows 2000/XP or Windows 2003 Server system:
netstat –s
IP Statistics
Packets Received = 19942
Received Header Errors = 0
Received Address Errors = 2
Datagrams Forwarded = 0
Unknown Protocols Received = 0
Received Packets Discarded = 0
Received Packets Delivered = 19942
Output Requests = 19682
Routing Discards = 0
Discarded Output Packets = 0
Output Packet No Route = 0
Reassembly Required = 0
Reassembly Successful = 0
Reassembly Failures = 0
Datagrams Successfully Fragmented = 0
Datagrams Failing Fragmentation = 0
Fragments Created = 0
ICMP Statistics
Received Sent
Messages 341 257
Errors 0 0
Destination Unreachable 30 16
Time Exceeded 142 0
Parameter Problems 0 0
Source Quenchs 0 0
Redirects 91 0
Echos 34 189
Echo Replies 44 34
Timestamps 0 0
Timestamp Replies 0 0
Address Masks 0 0
Address Mask Replies 0 0
TCP Statistics
Active Opens = 454
Passive Opens = 0
Failed Connection Attempts = 4
Reset Connections = 33
Current Connections = 0
Segments Received = 6399
Segments Sent = 6359
Segments Retransmitted = 14
UDP Statistics
Datagrams Received = 13184
No Ports = 325
Receive Errors = 0
Datagrams Sent = 13048
Again, the valuable information you get using this command can be very handy when troubleshooting networking problems. For example, you can check to see whether the number of errors or dropped packets is excessive when compared to your ordinary operating environment. To understand and make good use of this type of information, you should be familiar with the protocols that are displayed, such as IP and UDP. For more information about these protocols, see Chapter 24.
To determine which protocols and port numbers are currently being used to create a connection on a system running Windows XP or Windows Server 2003, you can use netstat –o, as in the following example:
Active Connections
Proto Local Address Foreign Address State PID
TCP tiger-athlon:1032 localhost:1035 ESTABLISHED 556
TCP tiger-athlon:1032 localhost:1036 ESTABLISHED 556
TCP tiger-athlon:1032 localhost:1037 ESTABLISHED 556
TCP tiger-athlon:1035 localhost:1032 ESTABLISHED 556
TCP tiger-athlon:1036 localhost:1032 ESTABLISHED 556
TCP tiger-athlon:1037 localhost:1032 ESTABLISHED 556
To determine what program was used to create a connection when you use netstat –o, you must configure Windows Task Manager to list the PID on the Processes tab. To do this, follow these steps:
1. Open Task Manager (press Ctrl+Alt+Del).
2. Click the Processes tab.
3. Click View, Select Columns.
4. Click the box for PID (Process Identifier)
5. Click OK.
6. The PID for each process is listed after the image name (see Figure 27.3).
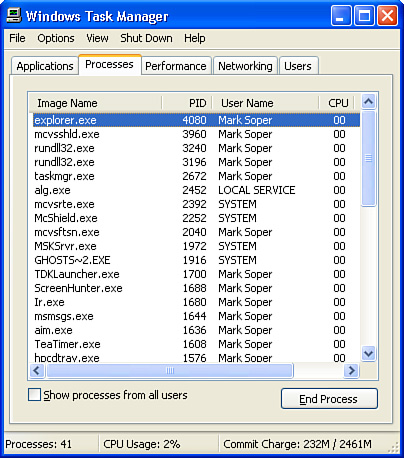
Figure 27.3. The Windows XP Task Manager after adding the PID column.
If you prefer not to modify the default appearance of Task Manager, you can use the netstat –b command to display the same type of information. However, the program used to create the connection is listed in brackets on the line following the PID. See this example:
Active Connections
Proto Local Address Foreign Address State PID
TCP tiger-athlon:1032 localhost:1035 ESTABLISHED 556
[cli.exe]
TCP tiger-athlon:1032 localhost:1036 ESTABLISHED 556
[cli.exe]
TCP tiger-athlon:1032 localhost:1037 ESTABLISHED 556
[cli.exe]
TCP tiger-athlon:1035 localhost:1032 ESTABLISHED 556
[cli.exe]
TCP tiger-athlon:1036 localhost:1032 ESTABLISHED 556
[cli.exe]
TCP tiger-athlon:1037 localhost:1032 ESTABLISHED 556
[cli.exe]
TCP tiger-athlon:netbios-ssn 192.16.0.101:1873 ESTABLISHED 4
[System]
Using the netstat Command on Unix or Linux Systems
The syntax for the netstat command varies depending on which Unix or Linux implementation you are using; however, you will see similar information, and it will be mostly the formatting that changes. For example, the syntax for netstat for the FreeBSD Unix operating system is
netstat [-AaLln] [-f address_family] [-M core] [-N system]
netstat [-bdghilmnrs] [-f address_family] [-M core] [-N system]
netstat [-bdn] [-I interface] [-M core] [-N system] [-w wait]
netstat [-p protocol] [-M core] [-N system]
netstat [-p protocol] [-i] [-I Interface]
netstat [-s] [-f address_family] [-i] [-I Interface]
where
![]()
-A—Shows the address of any protocol control blocks associated with sockets. This generally is used for debugging purposes.
![]()
-a—Shows the state of all sockets. By default, sockets used by server processes are not shown.
![]()
-b—When used with the -i (interface) option, shows the number of bytes in and out.
![]()
-d—With the -i option (interface), shows the number of packets dropped.
![]()
-f address_family—Use this to narrow down the statistics displayed to specific protocols. The values you can use here include inet, inet6, ipx, atalk, netgraph, ng, or unix.
![]()
-g—Displays multicast routing tables and interfaces. With the -s option, also shows statistics.
![]()
-h—Obsolete. Was used to show the IMP host table.
![]()
-I interface—Displays information about the specified interface interface. Can be used with the -f, -s, and -p options to narrow down the information displayed.
![]()
-i—Displays the status of interfaces that are statically configured and not located at boot time. Used with -a, multicast addresses that are in use are shown for each Ethernet and IP interface. If used with -f or the -p options, statistics are shown for the address families or protocols indicated.
![]()
-L—Displays the size of listen queues. Displays the number of unaccepted connections and the number of unaccepted incomplete connections. Also shows the number of queued connections.
![]()
-l—Causes the display to print the full IPv6 address.
![]()
-M—Uses values from a name list instead of the default file /dev/kmem.
![]()
-m—Displays statistics about memory management routines.
![]()
-N—Extracts the name list from the specified system instead of the default /kernel.
![]()
-n—Displays network addresses as numbers instead of names.
![]()
-p protocol—Specifies a protocol for which information is displayed. Protocol names are listed in the /etc/protocols file.
![]()
-s—Causes the display to show per-protocol statistical information.
![]()
-r—Displays the routing tables.
![]()
-w wait—Causes the interface statistics to be updated at intervals of wait seconds.
For Linux the capabilities of this command grow to encompass a larger number of functions. Most of the command options previously listed will work in the same manner for Linux. To find out about more complex commands that can be used with this utility to troubleshoot network problems, see the man page man netstat.
The arp Command
IP addresses and hostnames are used for the convenience of humans so that we can configure and manage a network in an orderly manner. At the lowest level, however, network cards use the hardware MAC address when they talk to each other. Remember that a computer finds out the hardware address of another computer on the local segment by using the Address Resolution Protocol (ARP). Just as a host computer keeps a table of routing information, it also keeps a cache of MAC-to-IP address translations known as the ARP table.
The arp command enables you to view the ARP table and to add or delete entries within it. Again, the syntax varies among different systems.
To show the differences you might encounter, let’s look at the Windows 2000/XP and Windows 2003 Servers and then Linux versions of this command. For Windows 2000/XP and Windows 2003 Servers the syntax is
ARP -s inet_addr eth_addr [if_addr]
ARP -d inet_addr [if_addr]
ARP -a [inet_addr] [-N if_addr]
![]()
-a inet_addr—Displays current ARP cache entries. If you specify a specific host (inet_addr), the display is restricted to information about that host.
![]()
-g—Same usage as –a.
![]()
-N if_addr—Shows ARP information about the network interface, if_addr.
![]()
-d inet_addr or –d if_addr—Deletes a host inet_addr (IP address) or if_addr (interface name) from the ARP table. Use the wildcard * (asterisk) to clear the ARP table of all host information.
![]()
-s inet_addr, eth_addr—Associates an IP address (inet_addr) with a MAC address (eth_addr).
For example, to add an address pair to the ARP table, you might use this:
arp -s 192.123.111.2 08-00-2b-34-c1-01
For Linux systems the syntax is
arp [-evn] [-H type] [i if] a [hostname]
arp [-v] [-i if] -d hostname [pub]
arp [-v] [-H type] [-i if] s hostname hw_addr [temp]
arp [-v] [-H type] [-i if] s hostname hw_addr [netmask nm] pub
arp [-v] [-H type] [-i if] Ds hostname ifa [netmask nm] pub
arp [-vnD] [-H type] [i if] f [filename]
where the command-line options are
![]()
-v—As always, this is the verbose option, which causes more information to be displayed when you enter a command.
![]()
-n, --numeric—Causes the command to show only numerical addresses instead of host, port, or user names.
![]()
-H type, --hwtype type, or –t type—Used when reading or modifying the ARP cache. This option is used to specify the underlying network hardware code (Ethernet, ARCnet, and so on).
![]()
-a [hostname], --display [hostname]—If hostname is supplied, all entries for that host are shown. If just the –a option or --display option is entered, all entries in the ARP cache table are displayed.
![]()
-d hostname, --delete hostname—Deletes records for hostname.
![]()
-D, --usedevice—The command uses the interface’s hardware address.
![]()
-i If, --device If—Selects which interface (If) to use when executing the command.
![]()
-s hostname hw_addr, --set hostname—Use this to create a manual entry for a hostname to address records in the ARP table.
![]()
-f filename, --file filename—Adds a record, like the –s option, but gets addressing information from filename. If no filename is used, /etc/ethers is used as a default.
As you can see, the arp command can be quite powerful. It should be used carefully when adding or deleting entries in the ARP table. However, for display purposes it can be easily used to determine problems of resolving hardware addresses on the local subnet or network segment.
The tcpdump Utility
If you are extremely knowledgeable about TCP/IP and are capable of understanding the bits and bytes of IP frames, you can use the tcpdump utility to capture header information from packets as they pass through the network. Because there can be a potential security problem with being able to view this information, it is not a utility that the ordinary Unix or Linux user can use. It is generally restricted to the root user or must be installed with setuid to root.
Note
When a file has “setuid to root bit” enabled, it means that the program will run with the privileges of the owner of the file, and not the privileges of the user who is running the program. In Unix or Linux systems, this feature allows the administrator to let users execute programs that perform specific tasks that require more privileges than the user has. However, the user is able to use the privileges only to run the program to accomplish a specific task. The user does not inherit the rights or privileges of the program after running it.
Because the tcpdump utility can be used to examine network packets (and thus “snoop” on network traffic), it must run with the privileges granted to the root (or superuser) account.
Many command-line parameters are associated with this utility, and you can create complex expressions that are used to evaluate which packets to intercept. You can also supply no selection criteria, and all packets will be dumped.
Some of the more useful options for the tcpdump command are listed here:
![]()
-a—Tries to convert network and broadcast addresses to names.
![]()
-c count—Exits after receiving count number of packets.
![]()
-d—Dumps the compiled packet-matching code in a human-readable form to standard output and stop.
![]()
-dd—Dumps packet-matching code as a C program fragment.
![]()
-ddd—Dumps packet-matching code as decimal numbers (preceded by a count).
![]()
-e—Displays the link level header information on each line (the Ethernet header information).
![]()
-F file—Uses the text found in file for the selection expression. If you use this option, any expression given on the command line is ignored.
![]()
-f—Prints “foreign” Internet addresses numerically rather than symbolically.
![]()
-i interface—Specifies the interface to monitor. If you do not specify this, tcpdump will select the lowest numbered configured interface, excluding loopback.
![]()
-n—Doesn’t convert host addresses, port numbers, and so on to names.
![]()
-nn—Suppresses printing of port or protocol names, and shows numbers instead.
![]()
-N—Doesn’t display domain name qualification of names.
![]()
-p—Doesn’t put network interface into promiscuous mode.
![]()
-q—Limits the amount of information displayed for a shorter listing.
![]()
-r—Reads packets from file (which was created with the -w option). Standard input is used if file is “-”.
![]()
-s—Snarfs snaplen bytes of data from each packet rather than the default of 68, which is adequate for IP, ICMP, TCP, and UDP but may truncate protocol information from name server and NFS packets.
![]()
-S—Prints absolute TCP sequence numbers.
![]()
-t—Doesn’t print a timestamp on each line.
![]()
-tt—Puts a timestamp on each line. –ttt prints a delta time between the previous and current lines.
![]()
-u—Displays undecoded NFS handles.
![]()
-U—Drops root privileges.
![]()
-v or -vv or -vvv—Gives additional information from each packet. Each of these causes the output to be more verbose.
![]()
-x—Prints each packet in hexadecimal format.
![]()
-X—Prints ASCII as well as hexadecimal format.
There are additional advanced options, but the preceding options are the basic ones. The selection expression criteria can be quite complex, and you should consult the extensive man pages for tcpdump to get the full listing of other options, expressions, and examples. The scope of the capabilities of this program is beyond this book. A couple of simple uses follow:
tcpdump host hercules
This command shows packets that are going to or coming from the system named hercules.
tcpdump ip host venus and not hercules
This command shows packets going to or coming from the system named venus, unless they are coming from or going to hercules. The output displayed by this command depends on the protocol of the packet that is intercepted.
You can download the most recent version and patches for this utility at www.tcpdump.org/. In addition, you can sign up for mailing lists that relate to this utility. Join the first list by sending an email message to the address [email protected]. This mailing list is used for announcements about the utility. The second mailing list is used for both announcements and discussions concerning the code of tcpdump. To subscribe to this mailing list, send an email to [email protected].
The source code for this program is also available for compilation on many different Unix and Linux platforms. Although it’s not a tool for a novice, tcpdump can be used by a skilled administrator to diagnose network problems. This section has given you only a brief overview of the capabilities of this simple network capture utility. After installing the software, be sure to review any readme files for up-to-date information.
The WinDump Utility
The tcpdump utility has been ported to the Windows environment and is known as WinDump. Like the tcpdump program, this program was developed by the Network Research Group of the Information and Computing Sciences Division of the Lawrence Berkeley National Laboratory. More recent versions and patches for the utility are maintained at http://www.winpcap.org/windump/. By using WinDump, you can gain a lot of information by examining network packets to troubleshoot network problems. The interface, however, is different than the command-line version of tcpdump. The WinDump utility, like tcpdump, is covered under a Berkeley-style license.
Note
A Berkeley-style license means that you can share software with others as long as you include a copy of the license. You cannot use the code to create commercial products to sell, however.
To use WinDump, you must first download and install the WinPcap Windows Packet Capture Library, available from http://www.winpcap.org/install/default.htm. The current version works with Windows 9x/Me/NT 4/2000/XP/2003 and even Windows Vista.
To make WinDump usable from any location on your system, download it into your Windows folder (C:Windows or C:WinNT on most systems). After you install WinPcap, run WinDump (WinDump.exe) from the command line.
Most of the command syntax for WinDump is similar to that of the tcpdump utility; consult the syntax listed earlier in this chapter for more help or go to the WinDump manual page at http://www.winpcap.org/windump/docs/manual.htm.
One of the most useful additions to WinDump’s syntax, compared to tcpdump’s, is the –D command switch. This lists the network adapters supported by WinDump by number and provides a description. Use the number along with the –i switch to specify to which adapter to listen. Here’s an example of the output from windump –D:
1.DeviceNPF_GenericDialupAdapter (Generic dialup adapter)
2.DeviceNPF_{A3C21A7A-2C4D-4132-9BA8-588415B4EE47} (NVIDIA nForce MCP Networki
ng Adapter Driver)
To listen to network traffic on the integrated nForce network adapter (network device 2), use the command windump –i2.
Tip
Both tcpdump and WinDump use both lowercase and uppercase command switches. Be sure to specify the correct case in your tcpdump or WinDump command, or you will get a syntax error or unexpected output.
Again, remember that examining network packets is not a job for a novice. You should first have a good understanding of the frame types seen on your network and a good understanding of the types of datagrams sent by applications and services you use. Some of the standard packets you should familiarize yourself with include DNS, ICMP, and TCP session setup and close. Depending on the services your network uses, you can quickly become familiar with the type of expected network traffic and then use this tool to look for exceptions when troubleshooting.
Using the nslookup Command to Troubleshoot Name Resolution Issues
This command is another simple command that is available with all TCP/IP implementations. Its purpose is to query a DNS name server to find out the name registration information for a particular host. By using nslookup, you can find out whether the address that is associated with the computer’s hostname is accurate. This can be handy for troubleshooting if you are trying to use one of the TCP/IP utilities, such as FTP or Telnet, to reach a particular host by name, yet find that you cannot establish a connection or that the remote system is not the one you thought it would be.
This utility can be run in two different modes. First, you can specify all the commands on a command line and get a result returned from a DNS name server (noninteractive mode). Second, you can enter “batch” mode (called interactive mode by Microsoft) and issue several commands in a row to the server. The basic syntax for the command in Windows operating systems is
nslookup [-option ...] [computer-to-find | - [server]]
Options you can use with the command are
![]()
computer-to-find—Specifies the name of the computer whose name you want to look up.
![]()
server—Specifies a DNS name server other than the default server configured on the client.
For example:
C:> nslookup www.twoinc.com
This command sends an inquiry to the default DNS server. If information is received, it will print the name of the server that the information is from and then print the IP address of the server you inquired about. For example:
C:>nslookup www.twoinc.com
Server: home8-qwest.bellatlantic.net
Address: 151.204.0.84
Non-authoritative answer:
Name: www.twoinc.com
Address: 216.65.33.219
In this example you can also see that the server that gave the response indicates that it is a non-authoritative answer. This means that the server is not the server that actually holds the domain name record for this domain, but has cached the name locally. The record for the domain is located elsewhere in the DNS hierarchy.
The nslookup command also enables you to enter several options on the command line or to use these features from within the interactive environment. When it’s used on the command line, precede each option with a minus sign (–). The options and values that can be used with Windows NT through Windows 2003 Servers are listed here:
![]()
help—Displays help text.
![]()
exit—Exits nslookup when in interactive mode.
![]()
finger [username] [> filename] | [>> filename]—Connects to the current finger server and looks up a username. You can specify a filename for the output.
![]()
ls [option] dnsdomain [> filename] | [>> filename]—Lists information about a domain. Generally this includes computer names and addresses. Suboptions to this command allow you to get other information.
![]()
lserver dnsdomain—Uses the initial server to retrieve information about dnsdomain.
![]()
root—Sets the current default server to be the root server.
![]()
server dnsdomain—Uses the current server to retrieve information about dnsdomain.
![]()
set keyword=[value]—Changes configuration settings about how nslookup works. See the help text for more information.
![]()
set all—Displays current configuration settings for the nslookup utility and shows information about the default server.
There are many set commands you can use to customize the way nslookup works. For more information, check the help text that comes with the version you are using. Using nslookup in interactive mode enables you to perform multiple hostname lookups without having to retype the nslookup command. Use the exit command to exit the interactive mode.
Other Useful Commands
The TCP/IP suite consists of several protocols and utilities that have been developed over the years. Other commands can be useful for troubleshooting. For example, the telnet command is used to establish a remote terminal session on another computer. If you are having trouble with a workstation, you can always telnet to it and perform diagnostic functions directly. This is convenient when the network is dispersed geographically. It is also possible to telnet to many networked devices, from printers to routers. This feature can enable you to resolve many remote problems without having to leave your office. Just telnet into a system and use the commands provided by that system.
Telnet also can be useful when you’re trying to resolve connectivity problems with a particular server. If you can’t ping or otherwise connect to a system, try using telnet to get to another system and try your diagnostic commands from that location in the network. Using this method to attempt to connect to a remote system by using other remote systems can help you locate the spot in the network where potential trouble lies.
Advanced users can use telnet to connect directly to ports used by specific services to enable troubleshooting for the service. For example, by using telnet to connect to a Web server on port 80, you can manually enter commands that would be sent by an Internet browser and examine the responses sent by the server. To see how this works from a Windows 2000/XP client, issue this command:
telnet www.google.com 80
This connects you to Google. After you have connected, there will be no response until you type a command. To request the index page, use the following command:
GET /index.html HTTP/1.0
Note that you must complete the command before the Web server drops your connection. This time varies on each server, but it can be rather quick. If you beat the timeout, the first part of the response will be the header. The first line is the HTTP Response code. Two common responses are 200, which means you were successful, and 404, which means the page was not found. The rest of the header information is fairly self-explanatory.
Following is an example of this:
HTTP/1.0 200 OK
Content-Length: 2532
Connection: Close
Server: GWS/2.0
Date: Mon, 06 Jan 2003 23:09:11 GMT
Content-Type: text/html
Cache-control: private
Set-Cookie: PREF=ID=67734bf5226e142a:TM=1041894551:LM=1041894551:S=E_cwh20x6SQGp
kqD; expires=Sun, 17-Jan-2038 19:14:07 GMT; path=/; domain=.google.com
![]() Response codes for Telnet are covered in detail in Chapter 25, “Basic TCP/IP Services and Applications.”
Response codes for Telnet are covered in detail in Chapter 25, “Basic TCP/IP Services and Applications.”
Next, the HTML content—the bits that would normally be rendered by the browser—of the page that you requested are displayed. I’ve trimmed the content of this section because the details are not important.
<html><head><meta http-equiv="content-type" content="text/html; charset=ISO-8859
-1"><title>Google</title>
..
..
..
©2003 Google</font><font size=-2> - Searching 3,083,32
4,652 web pages</font></center></body></html>
And then you will be disconnected:
Connection to host lost.
The ftp command can be used to move files to and from a remote system. This can be useful to retrieve the output of a diagnostic command, a log file, or perhaps a configuration file so that you can examine or edit it locally.
Depending on the importance of the server, you should consider the capabilities of both Unix/Linux and Windows operating systems to audit activities on the system. The syslog daemon on Unix/Linux computers can be configured to capture a lot of data from many sources. If troubleshooting becomes nonproductive, consider increasing the events logged by the operating system so that you might find important data that can help assist in solving the problem.
Using Network Connection Repair in Windows XP
Windows XP includes a multi-step process for repairing a network connection, replacing a series of manual steps. To start the repair process, follow these steps:
1. Open My Network Places.
2. Click View Network Connections from the Network Tasks menu.
3. Right-click the network connection that is not working and select Repair from the context menu.
The Repair option performs the following tasks in this order. The equivalent command-line options are also provided:
![]() Renews the computer’s DHCP-provided IP address; equivalent to
Renews the computer’s DHCP-provided IP address; equivalent to ipconfig /renew
![]() Flushes the Address Resolution Protocol cache; equivalent to
Flushes the Address Resolution Protocol cache; equivalent to arp –d*
![]() Reloads the NetBIOS name cache; equivalent to
Reloads the NetBIOS name cache; equivalent to nbtstat –R
![]() Refreshes the NetBIOS name; equivalent to
Refreshes the NetBIOS name; equivalent to nbtstat –RR
![]() Flushes the Domain Name System (DNS) cache; equivalent to
Flushes the Domain Name System (DNS) cache; equivalent to ipconfig /flushdns
![]() Re-registers DNS names; equivalent to
Re-registers DNS names; equivalent to ipconfig /registerdns
![]() Restarts IEEE 802.1x Authentication (starting with Service Pack 1)
Restarts IEEE 802.1x Authentication (starting with Service Pack 1)
Note
The Repair option is not available on user accounts that are not members of the Administrator or Network Configuration Operators group. For example, a Guest, Standard, or Limited User account will not list this option.
As you can see, the Repair option saves a lot of time when compared with the amount of time needed to run several command-line utilities. Keep in mind that Repair cannot solve problems caused by an invalid static IP address. It is primarily designed for systems using DHCP (server-assigned) IP addresses.