Chapter 6. Troubleshooting Platform Issues Due to BGP
The following topics are covered in this chapter:
![]() Troubleshooting High CPU due to BGP
Troubleshooting High CPU due to BGP
![]() Troubleshooting Memory Issues due to BGP
Troubleshooting Memory Issues due to BGP
![]() Troubleshooting BGP and Related Processes
Troubleshooting BGP and Related Processes
There are situations in which a router might experience high CPU utilization or a memory leak which can severely impact the services on the router or even the whole network. In some instances, BGP protocol may just be a victim of such a situation. But there can also be situations where BGP protocol is not just the victim but also the cause of the problem. These situations cause instability in the functioning of any routing protocols, including BGP. This chapter primarily focuses on troubleshooting scenarios that impact the services on the router due to high CPU conditions, high memory utilization, or a memory leak condition on the router due to BGP. This chapter also covers BGP problems caused due to resource constraints, software problems, or platform limitations.
Troubleshooting High CPU Utilization due to BGP
A high CPU condition may be seen on the router due to two primary reasons:
![]() Interrupt (Traffic)
Interrupt (Traffic)
![]() Process
Process
If the CPU utilization is high due to interrupts, it indicates that either there is traffic that is destined toward the router or the transit network traffic (traffic that is not destined to the router’s IP addresses but is only transiting the router) is not switched in hardware and is instead handled by software processes on the router. When the CPU utilization is high because of a process, this scenario means that a process is consuming too many CPU cycles and is not releasing the CPU control for other processes.
The Cisco Internetwork Operating System (IOS), IOS XR, and NX-OS platforms have different architectures and manage the underlying processes differently. Troubleshooting high CPU utilization issues that are caused by BGP requires understanding how the different operating systems handle the BGP process.
Troubleshooting High CPU due to BGP on Cisco IOS
Cisco IOS is not a multithreaded platform and uses various processes relating to BGP to perform different tasks. All the BGP functionality is spread across multiple processes that are individually threaded (not multithreaded). Table 6-1 lists the various BGP processes on Cisco IOS devices.

Of all the processes listed in Table 6-1, BGP Scanner, BGP Router, and BGP I/O are the most CPU-intensive processes; they can cause severe impact on the services running on the router and performance degradation. It is essential to understand how these processes are coupled together to provide BGP functionality. Figure 6-1 shows the functioning model of BGP processes on Cisco IOS software.

High CPU due to BGP Scanner Process
The BGP Scanner process is a low-priority process that runs every 60 seconds by default. This process checks the entire BGP table to verify the next-hop reachability and updates the BGP table accordingly in case there is any change for a path. The BGP Scanner process runs through the Routing Information Base (RIB) for redistribution purposes.
The BGP Scanner process has to run the entire BGP RIB and global RIB and consumes a lot of CPU cycles if the BGP table and the routing table are holding a large number of prefixes. For example, for routers that consume the Internet routing table from their service provider, the router installs the route into the BGP table and the global RIB. The CPU will have a high utilization rate on routers with low performance CPUs due to the BGP Scanner process. Even on the high performance CPUs that are capable of performing much faster actions, the CPU may still spike up every 60 seconds.
Example 6-1 shows the CPU utilization on the router using the command show process cpu sorted. Notice that in the output below, the BGP Scanner process is consuming most of the CPU resources. Also notice that BGP is holding large number of prefixes from two different neighbors. When there are so many prefixes being held by BGP, the spike in the CPU utilization due to BGP Scanner process may not be an abnormal condition. The CLI shows % utilization over time, so if BGP scanner has run just prior to the CLI execution, the % CPU used by BGP scanner process will be high.
The CPU utilization on the router is viewed using the command show process cpu. This command shows all the processes on the Cisco IOS router and their respective 5sec, 1Min, and 5Min average CPU utilization. The sorted keyword used with the command sorts the output based on the processes utilizing the most CPU resources.
Example 6-1 High CPU due to BGP Scanner Process
R1# show processes cpu sorted | exclude 0.00
CPU utilization for five seconds: 99%/0%; one minute: 30%; five minutes: 23%
PID Runtime(ms) Invoked uSecs 5Sec 1Min 5Min TTY Process
323 329026720 48369088 6802 93.83% 24.83% 17.73% 0 BGP Scanner
162 166795336 1070414 155825 3.67% 0.51% 0.54% 0 IP Background
321 1745832641952035493 89 0.71% 0.35% 0.38% 0 BGP Router
281 84696032 687563142 123 0.23% 0.14% 0.12% 0 Port manager per
163 65754676 168855372 389 0.15% 0.18% 0.14% 0 IP RIB Update
322 48597036 799815299 60 0.15% 0.10% 0.08% 0 BGP I/O
179 24667616 89018581 277 0.07% 0.03% 0.02% 0 CEF process
R1# show bgp ipv4 unicast summary
! Output omitted for brevity
Neighbor V AS MsgRcvd MsgSent TblVer InQ OutQ Up/Down State/PfxRcd
10.1.12.2 4 65531 13490982 346982 44061045 0 0 4d01h 274061
10.1.13.2 4 65531 342135 11710057 44061063 0 0 4d01h 5
10.1.14.2 4 65531 341966 11627860 44061063 0 0 4d01h 1
10.1.15.2 4 65531 341970 11627869 44061063 0 0 4d01h 4
192.168.10.10 4 65531 3879885 11846203 44061063 0 0 4d01h 255020
When the BGP Scanner is running, even though it is a low priority process, it may affect other low priority processes that need to run. For example, Internet Message Control Protocol (ICMP) may have to wait a longer time to gain access to the CPU. This thus causes latency and delay in ping response.
The command show processes displays the various processes and their priority on the system. The column QTy in the command output is a combination of two variables. Variable Q basically has three values. The value L refers to low priority process, H refers to high priority process, and M refers to medium priority process. The variable Ty indicates various states based on the value. All the values of various states are described in Table 6-2.

Example 6-2 illustrates the use of the show processes command that shows the BGP Scanner process is a low-priority process.
Example 6-2 High CPU due to BGP Scanner Process
R1# show processes
CPU utilization for five seconds: 0%/0%; one minute: 0%; five minutes: 0%
PID QTy PC Runtime (ms) Invoked uSecs Stacks TTY Process
323 Lsi 8892A3 9891 5107 193632416/36000 0 BGP Scanner
! Output omitted for brevity
When troubleshooting BGP Scanner issues, the platform scale should also be thoroughly checked, because in most cases it is due to an overloaded device that leads into such situations. Also, it should be ensured that there is proper ternary content addressable memory (TCAM) space available on the router.
Another important thing to verify is the routing table (RIB). Typically for IPv4 address-family, the prefixes are downloaded to RIB even on the route reflector, but for VPNv4 address-family, that is not the case. Use the show ip route summary command to verify how many routes are present in the RIB. The bigger the routing table, the longer the BGP Scanner process can take the CPU cycles.
Note
In an MPLS VPN environment, BGP Scanner performs the route import and export into a particular VPN routing and forwarding (VRF) table. The BGP scanner process also checks for conditional advertisements and ensures whether a BGP prefix should be advertised. It also performs BGP route dampening.
High CPU due to BGP Router Process
This process is invoked when BGP is first configured on the router using the router bgp autonomous-system-number command. The BGP Router process runs once per second to safeguard faster convergence. To ensure faster convergence, it can consume all the free CPU cycles. Example 6-3 shows the high CPU condition on the router due to BGP Router process.
Example 6-3 High CPU due to BGP Router Process
R2# show process cpu sorted
CPU utilization for five seconds: 98%/0%; one minute: 68%; five minutes: 68%
PID Runtime(ms) Invoked uSecs 5Sec 1Min 5Min TTY Process
185 281442004 683481796 411 98.24% 66.32% 65.09% 0 BGP Router
One scenario that can lead to high CPU utilization due to BGP Router process is huge route churn. Troubleshooting BGP route churn issues is discussed in detail in Chapter 5, “Troubleshooting Convergence Issues.” BGP will have slow convergence if the CPU is busy with other tasks of equal or higher priority. The CPU itself could be busy with BGP churn; in that case, BGP is causing the CPU utilization problems, but the convergence may not be slower. In other words, if the CPU has a certain speed, and if BGP is using all of it, this may not really affect the convergence.
High CPU Utilization due to BGP I/O Process
The BGP I/O process runs when BGP control packets are received and manages the queuing and processing of BGP packets. High CPU utilization due to BGP I/O process is less common as compared to BGP Scanner or BGP Router processes. If there are excessive packets being received in the BGP queue for a longer period, or if there is a problem with TCP, the router shows symptoms of high CPU due to BGP I/O process. Example 6-4 illustrates a high CPU condition on the router due to BGP I/O process. Note the unread input bytes by TCP.
Example 6-4 High CPU due to BGP I/O Process
R1# show process cpu sorted
CPU utilization for five seconds: 81%/4%; one minute: 82%; five minutes:82%
PID Runtime(ms) Invoked uSecs 5Sec 1Min 5Min TTY Process
322 2087098100-1504383242 0 75.33% 73.65% 74.02% 0 BGP I/O
78 66735804 235709575 283 0.49% 0.53% 0.51% 0 IP Input
! Output omitted for brevity
R1# show ip bgp vpn all neighbors | i BGP neighbor|Connnection state
BGP neighbor is 10.1.12.2, remote AS 65530, internal link
Connection state is ESTAB, I/O status: 1, unread input bytes: 0
BGP neighbor is 10.1.13.2, remote AS 65530, internal link
Connection state is ESTAB, I/O status: 1, unread input bytes: 108
BGP neighbor is 10.1.14.2, remote AS 65530, internal link
Connection state is ESTAB, I/O status: 1, unread input bytes: 0
BGP neighbor is 10.1.15.2, remote AS 65530, internal link
Connection state is ESTAB, I/O status: 1, unread input bytes: 0
! The TCB value 686B83C8 is achieved from the command show tcp brief
R2# show tcp tcb 686B83C8
Load for five secs: 79%/0%; one minute: 79%; five minutes: 81%
Connection state is ESTAB, I/O status: 1, unread input bytes: 108
Connection is ECN Disabled, Mininum incoming TTL 0, Outgoing TTL 255
Local host: 10.1.13.1, Local port: 179
Foreign host: 10.1.13.2, Foreign port: 62796
Connection tableid (VRF): 0
! Output omitted for brevity
Note
The TCP control block (tcb) value can be attained using show tcp brief command.
If the unread bytes keep incrementing, clearing the TCP session using command clear tcp tcb value resolves the issue with the TCP connection. This normalizes the CPU utilization as well. If the problem keeps happening again and again, running TCP debugs or performing packet captures may be useful.
The following steps summarize the process of troubleshooting a high CPU condition on the router due to one of the preceding BGP processes.
Step 1. Verify the BGP process causing high CPU utilization. The process consuming high CPU utilization is verified by using the show process cpu sorted command.
Step 2. Check the BGP Scanner. If the CPU has high utilization due to the BGP Scanner process, check the BGP and the routing table to verify how many routes are being learned by BGP. Elevated CPU utilization due to BGP scanner process may be normal every few seconds and should not be a problem as long as it is not causing impact to other functions of the router.
Step 3. BGP Router. If the CPU is high due to the BGP Router process, verify the BGP table version to see if there is high BGP route churns being observed. Use the command show bgp afi safi summary to view the table version information for respective address-families. The RIB can also be checked for flapping routes using the show ip route [vrf vrf-name] | include 00:00:0 command.
Step 4. Verify that the path MTU discovery is enabled. Check that the ip tcp path-mtu-discovery command is enabled on the router global configuration mode. Also ensure there is no ICMP being blocked in the path. Use the show bgp address-family unicast neighbor ip-address command to verify the MSS value for the BGP neighbor. Also, perform the ping with DF-bit set to the remote destination. IOS XR and recent IOS software have path MTU discovery enabled by default. The TCP session can be verified for path MTU discovery by verifying the TCP tcb using the command show tcp tcb.
Step 5. If the route churn is noticed—that is, if the BGP table and/or the routing table are unstable—find the source of the route churn and troubleshoot the cause of it.
Step 6. Check for unread input bytes by using TCP. Use the show tcp tcb value command to check whether there are unread input bytes by the TCP session.
Step 7. Ensure that the system has sufficient resources. Confirm that there are enough system resources (DRAM, TCAM) to accommodate the Internet routing table. Also ensure that the latest hardware is being used. New hardware allows for a better and more powerful CPU that helps in faster processing of BGP requests and updates. It is important to verify that the production routers are capable of handling the scale and platform documentation and data sheets have been consulted to ensure the same.
Troubleshooting High CPU due to BGP on IOS XR
On IOS XR, there are multiple threads running under the BGP process performing various tasks. So if the CPU is high due to BGP, it might mean that a particular thread under the BGP process is consuming the CPU cycle. Example 6-5 illustrates the use of the command show processes cpu to check the CPU utilization statistics for last 1Min, 5Min, and 15Min. Notice in the command output that the BGP process is consuming the maximum CPU resources.
Example 6-5 show processes cpu Command on IOS XR
RP/0/RSP0/CPU0:R20# show processes cpu
CPU utilization for one minute: 98%; five minutes: 98%; fifteen minutes: 98%
PID 1Min 5Min 15Min Process
1 0% 0% 0% kernel
8195 0% 0% 0% dllmgr
12290 0% 0% 0% wd-critical-mon
12295 0% 0% 0% p40x0mc
12296 0% 0% 0% pkgfs
663922 87% 88% 88% bgp
12297 0% 0% 0% serdrvr
16394 0% 0% 0% devc-pty
But this output does not yield much information on what really is happening within BGP that is causing high CPU utilization. Use the show processes bgp [detail] command to view all the threads under the bgp process and their respective CPU utilization. Example 6-6 illustrates the use of show process bgp command to view the threads consuming the most CPU cycle. From the output it is clear that thread 7 and thread 18 are consuming the most CPU resources.
Example 6-6 show processes bgp Command Output
RP/0/RSP0/CPU0:R20# show processes bgp
Job Id: 1054
PID: 663922
Executable path: /disk0/iosxr-routing-5.1.3.sp5-1.0.0/0x100000/bin/bgp
Instance #: 1
Version ID: 00.00.0000
Respawn: ON
Respawn count: 1
Max. spawns per minute: 12
Last started: Tue Oct 20 10:49:44 2015
Process state: Run
Package state: Normal
Started on config: default
Feature name: ON
Tag : default
Process group: v4-routing
core: MAINMEM
Max. core: 0
Placement: Placeable
startup_path: /pkg/startup/bgp.startup
Ready: 1.873s
Available: 85.675s
Process cpu time: 46.547 user, 1.837 kernel, 48.384 total
JID TID CPU Stack pri state TimeInState HR:MM:SS:MSEC NAME
1054 1 1 444K 10 Receive 0:00:08:0487 0:00:02:0224 bgp
1054 2 2 444K 10 Receive 305:21:48:0391 0:00:00:0000 bgp
1054 3 1 444K 10 Receive 0:00:01:0170 0:00:00:0381 bgp
1054 4 3 444K 10 Receive 305:21:44:0587 0:00:00:0000 bgp
1054 5 2 444K 10 Receive 58:10:54:0330 0:00:00:0022 bgp
1054 6 0 444K 10 Sigwaitinfo 305:21:45:0272 0:00:00:0000 bgp
1054 7 42 444K 10 Receive 29:14:41:0198 0:00:00:0028 bgp
1054 8 1 444K 10 Receive 49:05:21:0265 0:00:00:0221 bgp
!Output omitted for brevity
1054 16 1 444K 10 Receive 0:00:04:0515 0:00:04:0461 bgp
1054 17 3 444K 10 Receive 29:14:41:0199 0:00:00:0012 bgp
1054 18 37 444K 10 Receive 29:14:41:0198 0:00:00:0014 bgp
1054 19 3 444K 10 Receive 29:14:41:0184 0:00:00:0028 bgp
1054 20 1 444K 10 Receive 58:10:41:0906 0:00:00:0002 bgp
1054 21 3 444K 10 Receive 0:00:26:0826 0:00:00:0071 bgp
1054 22 3 444K 10 Receive 0:00:50:0343 0:00:36:0920 bgp
1054 23 3 444K 10 Receive 305:20:48:0097 0:00:00:0000 bgp
1054 24 2 444K 10 Receive 0:00:19:0698 0:00:00:0082 bgp
1054 25 0 444K 10 Receive 305:20:48:0097 0:00:00:0000 bgp
Although the thread consuming the most CPU resource is identified, it still does not reveal what a particular thread is doing. Each thread has a relevant threadname attached to it that can be viewed using the command show process threadname jid, where jid stands for Job Id.
Example 6-7 shows the output of show processes threadname jid output for the bgp process. Using this command, all the threads and their respective names under the bgp process are seen. The two threads in this case consuming the most CPU cycles are bgp-label thread and bgp-import thread.
Example 6-7 show processes threadname jid Command Output
RP/0/RSP0/CPU0:R20# show processes threadname 1054
JID TID ThreadName pri state TimeInState NAME
1054 1 bgp-io-control 10 Receive 0:00:02:0694 bgp
1054 2 10 Receive 305:23:23:0495 bgp
1054 3 bgp-rpki 10 Receive 0:00:01:0255 bgp
1054 4 10 Receive 305:23:19:0691 bgp
1054 5 async 10 Receive 58:12:29:0433 bgp
1054 6 10 Sigwaitinfo 305:23:20:0375 bgp
1054 7 bgp-label 10 Receive 29:16:16:0301 bgp
1054 8 bgp-mgmt 10 Receive 49:06:56:0368 bgp
1054 9 cdm_monitor_rs 10 Receive 305:23:19:0739 bgp
1054 10 bgp-rib-upd-0 10 Receive 29:16:16:0301 bgp
1054 11 lspv_lib BGPv4 10 Reply 305:23:20:0166 bgp
1054 12 bgp-rib-upd-1 10 Receive 29:16:16:0303 bgp
1054 13 cdm_monitor_rs 10 Receive 305:23:09:0530 bgp
1054 14 cdm_monitor_rs 10 Receive 305:22:59:0029 bgp
1054 15 bgp-io-read 10 Receive 0:00:08:0291 bgp
1054 16 bgp-io-write 10 Receive 0:00:08:0291 bgp
1054 17 bgp-router 10 Receive 29:16:16:0304 bgp
1054 18 bgp-import 10 Receive 29:16:16:0303 bgp
1054 19 bgp-upd-gen 10 Receive 29:16:16:0288 bgp
1054 20 bgp-sync-active 10 Receive 58:12:17:0010 bgp
1054 21 bgp-crit-event 10 Receive 0:00:01:0928 bgp
1054 22 bgp-event 10 Receive 0:00:25:0441 bgp
1054 23 bgp-mib-trap 10 Receive 305:22:23:0202 bgp
1054 24 bgp-io-ka 10 Receive 0:00:13:0184 bgp
1054 25 bgp-l2vpn-thr 10 Receive 305:22:23:0202 bgp
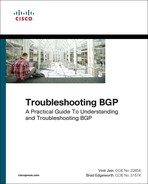
Although the names give a hint on what each thread does, it does not complete the picture. Table 6-3 elaborates the task of each thread under the bgp process.

Coming back to the problem shown in Example 6-7, the following factors can be checked on the router when the high CPU is due to the two highlighted threads:
![]() Flapping VPN prefixes
Flapping VPN prefixes
![]() Table version updates for the virtual routing and forwarding (VRF) instances
Table version updates for the virtual routing and forwarding (VRF) instances
![]() Any routing loop condition due to mutual redistribution between Route Distinguishers (RD) in the network
Any routing loop condition due to mutual redistribution between Route Distinguishers (RD) in the network
If the problem is happening due to an expected configuration as highlighted in the last point, label and import processing can be delayed by using bgp label-delay delay-in-seconds delay in milliseconds and bgp import-delay delay-in-seconds delay in milliseconds configuration commands under the address-family vpnv4 unicast section. This eases the load on the CPU as it delays the batch processing of labels and imports for VPN prefixes in VRF tables. Similarly, if the high CPU utilization condition is noticed because of other threads, troubleshooting can be done according to the task(s) performed by that thread and appropriate actions can be taken.
Troubleshooting High CPU due to BGP on NX-OS
Because NX-OS is also a multithreaded architecture like IOS XR, there are multiple threads working under the bgp process to accomplish various tasks of BGP. Though the method to troubleshoot high CPU due to BGP remains the same, it is easier to look at the thread and know what task that particular thread is supposed to do. Based on that, further investigation can be done. On Nexus platforms, to verify high CPU utilization conditions due to a particular process such as bgp, use the show processes cpu sort command.
Example 6-8 shows the high CPU utilization on the Nexus device due to the bgp process. The important information to note in the output is the Process ID (PID) field, because that value is used to further look at the thread-level information for a particular process.
Example 6-8 High CPU on Nexus Device
R20# show processes cpu sort
PID Runtime(ms) Invoked uSecs 1Sec Process
----- ----------- -------- ----- ------ -----------
7387 135 70 1935 47.5% bgp
34 390169 36175963 10 0.9% kirqd
3572 2406238 6249848 385 0.9% pltfm_config
5406 138 32 4336 0.9% adjmgr
5488 353 87 4058 0.9% netstack
5546 67783184 264737324 256 0.9% snmpd
! Output omitted for brevity
Note
Some newer versions of NX-OS may show the CPU utilization output for 5 seconds, 1 minute, and 5 minutes. Also, the output may vary a bit based on the Nexus platform.
The show system internal processes cpu command is another command equivalent to top command in Linux. This command provides an ongoing look at processor activity in real time. Example 6-9 shows the output of the show system internal processes cpu command. The command output shows that the CPU has been high due to the bgp process.
Example 6-9 Real-Time Processor Activity on Nexus
R20# show system internal processes cpu
top - 14:55:39 up 108 days, 57 min, 2 users, load average: 1.82, 1.53, 1.48
Tasks: 348 total, 1 running, 347 sleeping, 0 stopped, 0 zombie
Cpu(s): 30.4%us, 14.4%sy, 0.0%ni, 54.4%id, 0.0%wa, 0.1%hi, 0.6%si, 0.0%st
Mem: 8260784k total, 3139388k used, 5121396k free, 82360k buffers
Swap: 0k total, 0k used, 0k free, 1452676k cached
PID USER PR NI VIRT RES SHR S %CPU %MEM TIME+ COMMAND
7387 cisco 20 0 820m 24m 10m S 98.0 0.3 114481:15 bgp
9998 cisco 20 0 3600 1592 1140 R 3.8 0.0 0:00.03 top
2357 root 15 -5 114m 9860 4656 S 1.9 0.1 89:51.07 sysmgr
3210 cisco 20 0 137m 13m 6464 S 1.9 0.2 92:10.98 urib
5488 root 20 0 625m 50m 12m S 1.9 0.6 1965:49 netstack
1 root 20 0 1988 604 524 S 0.0 0.0 1:08.34 init
2 root 15 -5 0 0 0 S 0.0 0.0 0:00.00 kthreadd
3 root RT -5 0 0 0 S 0.0 0.0 0:00.98 migration/0
!Output omitted due to brevity
The CPU stats can also be checked at the thread level using the show process cpu details pid command. Example 6-10 shows the CPU utilization on a per-thread level for the bgp process.
Example 6-10 show process cpu details pid Output
R20# show process cpu detailed 7387
CPU utilization for five seconds: 1%/0%; one minute: 1%; five minutes: 1%
PID Runtime(ms) Invoked uSecs 5Sec 1Min 5Min TTY Process
----- ----------- -------- ----- ------ ------ ------ --- -----------
7387 150 61 2 0.00% 0.00% 0.00% - bgp
7388 210 10082 0 0.00% 0.00% 0.00% - bgp:active-time
7389 20 59 0 0.00% 0.00% 0.00% - bgp:bgp-cli-thr
7390 20 52 0 0.00% 0.00% 0.00% - bgp:bgp-mts
7391 0 2 0 0.00% 0.00% 0.00% - bgp:bgp-cmi
7392 20 597 0 0.00% 0.00% 0.00% - bgp:txthread-ha
7393 0 2 0 0.00% 0.00% 0.00% - bgp:bgp-soft-re
7394 0 2 0 0.00% 0.00% 0.00% - bgp:bgp-import
7395 70 1265 0 0.00% 0.00% 0.00% - bgp:bgp-peer-se
7396 1430 550 2 0.00% 0.02% 0.02% - bgp:bgp-cleanup
7397 290 10304 0 0.19% 0.01% 0.00% - bgp:bgp-session
7398 350 6531 0 0.00% 0.00% 0.00% - bgp:bgp-incomin
7399 10 16 0 0.00% 0.00% 0.00% - bgp:bgp-bestpat
7400 0 3 0 0.00% 0.00% 0.00% - bgp:bgp-vrf-bes
7401 10 160 0 0.00% 0.00% 0.00% - bgp:bgp-update-
7402 20 626 0 0.00% 0.00% 0.00% - bgp:bgp-send-up
7403 0 126 0 0.00% 0.00% 0.00% - bgp:sosend-0
7404 0 125 0 0.00% 0.00% 0.00% - bgp:sosend-1
7405 10 125 0 0.00% 0.00% 0.00% - bgp:sosend-2
7406 10 121 0 0.00% 0.00% 0.00% - bgp:sosend-3
7407 0 125 0 0.00% 0.00% 0.00% - bgp:sosend-4
7408 0 123 0 0.00% 0.00% 0.00% - bgp:sosend-5
7409 10 123 0 0.00% 0.00% 0.00% - bgp:sosend-6
7410 0 123 0 0.00% 0.00% 0.00% - bgp:sosend-7
7411 10 122 0 0.00% 0.00% 0.00% - bgp:sosend-8
7412 0 124 0 0.00% 0.00% 0.00% - bgp:sosend-9
7413 30 5140 0 0.00% 0.00% 0.00% - bgp:bgp-worker-
7414 50 180 0 0.00% 0.00% 0.00% - bgp:bgp-fd-clos
7415 0 12 0 0.00% 0.00% 0.00% - bgp:bgp-mts-con
7416 0 3 0 0.00% 0.00% 0.00% - bgp:ipv6-client
If the high CPU is due to BGP route churn, use the show bgp vrf all all summary command to verify the table version incrementing for all VRF contexts, and also use the command show routing unicast event-history add-route to view the prefixes that recently flapped.
Capturing CPU History
While troubleshooting a high CPU condition on the router (not necessarily due to BGP), it’s important to know when the problem actually started and when the device is experiencing a high CPU utilization. In most cases, SNMP keeps polling the CPU statistics, which gives a historical data of the baseline CPU utilization. But if SNMP is not configured, the Cisco platforms have support for commands to verify the CPU utilization history for up to 72 hours. Use the show processes cpu history command to verify the history for last 60 seconds, 60 minutes, and 72 hours. This command is available only on IOS and NX-OS running devices. If using SNMP to collect statistics, use SNMP OID 1.3.6.1.4.1.9.9.109.1.1.1.1.3.1 to collect total CPU utilization of the route processor.
Troubleshooting Sporadic High CPU Condition
On most instances, the high CPU condition on the router may be sporadic and may happen for few seconds before any command is captured, and the CPU normalizes again.
To investigate such issues, a very powerful tool built in to Cisco Operating Systems can be used—Embedded Event Manager (EEM). EEM is an event-driven tool that takes various trigger inputs and allows the user to set what actions can be taken when the event gets triggered. With EEM, there is an option to capture the output when a particular problem is happening and also when an event has occurred.
For example, an action can be taken when high CPU utilization is being seen on the router, or logs can be procured when a BGP session has flapped. Example 6-11 shows the EEM configuration on all the platforms. The EEM has the trigger event set for a high CPU condition and the actions include BGP show commands that can be captured when the high CPU condition is noticed.
Example 6-11 EEM Configuration for High CPU Utilization
IOS
event manager applet High_CPU
event snmp oid 1.3.6.1.4.1.9.9.109.1.1.1.1.3.1 get-type exact entry-op ge
entry-val 50 poll-interval 0.5
action 0.0 syslog msg "High CPU DETECTED"
action 0.1 cli command "enable"
action 0.2 cli command "show clock | append disk0:high_cpu.txt"
action 1.2 cli command "term length 0"
action 1.3 cli command "show process cpu sorted | append disk0:high_cpu.txt"
action 1.4 cli command "show ip bgp summary | append disk0:high_cpu.txt"
action 1.5 cli command "show clock | append disk0:high_cpu.txt"
action 1.4 cli command "show ip bgp summary | append disk0:high_cpu.txt"
IOS XR
::cisco::eem::event_register_wdsysmon timewin 5 sub1 cpu_tot op ge val 70 maxrun_
sec 600
#
# errorInfo gets set by namespace if any of the auto_path directories do not
# contain a valid tclIndex file. It is not an error just left over stuff.
# So we set the errorInfo value to null so that we don't have left
# over errors in it.
#
set errorInfo ""
namespace import ::cisco::eem::*
namespace import ::cisco::lib::*
#
# errorInf gets set by namespace if any of the auto_path directories do not
# contain a valid tclIndex file. It is not an error just left over stuff.
# So we set the errorInfo value to null so that we don't have left
# over errors in it.
#
set errorInfo ""
#Notify users that we're collecting
set output_msg "High CPU Collecting Commands"
action_syslog priority info msg $output_msg
# Set the list of commands to run
set cmd_list [list
"show proc blocked location all"
"show bgp ipv4 unicast summary"
"show bgp vrf all summary"
]
# open a cli connection
if [catch {cli_open} result] {
error $result $errorInfo
} else {
array set cli1 $result
}
# Loop through the command list (cmd_list), executing each command
foreach command $cmd_list {
append cmd_output "
XXXXXXXXXXXXXXXXXXXXXXXXXXXXXXXX "
append cmd_output $command
append cmd_output "
XXXXXXXXXXXXXXXXXXXXXXXXXXXXXXXX "
if [catch {cli_exec $cli1(fd) $command} result] {
error $result $errorInfo
} else {
append cmd_output $result
}}
#close the cli connection
if [catch {cli_close $cli1(fd) $cli1(tty_id)} result] {
error $result $errorInfo
}
set tdate [clock format [clock seconds] -format %Y%m%d%S]
set filename [format "/harddisk:/cpu-log-%s.txt" $tdate]
set outfile [open $filename w]
puts $outfile "$cmd_output"
close $outfile
#Notify users that task is completed
set output_msg "Saved data to file $filename"
action_syslog priority info msg $output_msg
NX-OS
event manager applet HIGH-CPU
event snmp oid 1.3.6.1.4.1.9.9.109.1.1.1.1.6.1 get-type exact entry-op ge
entry-val 70 exit-val 30 poll-interval 1
action 1.0 syslog msg High CPU hit $_event_pub_time
action 2.0 cli enable
action 3.0 cli show clock >> bootflash:high-cpu.txt
action 4.0 cli show processes cpu sort >> bootflash:high-cpu.txt
action 5.0 cli show bgp vrf all all summary >> bootflash:high-cpu.txt
action 6.0 cli show clock >> bootflash:high-cpu.txt
action 7.0 cli show bgp vrf all all summary >> bootflash:high-cpu.txt
Note
Refer to Cisco documentation at www.cisco.com for more details on configuring EEM on various Cisco Operating Systems.
Troubleshooting Memory Issues due to BGP
Every process and almost every piece of feature configuration consumes some amount of memory. If the feature or process starts consuming more memory than expected, then other features and processes may face a memory resource constraint. Every process on the router requires memory to execute and store its data; thus, it is crucial to have sufficient memory available for proper functioning of the router. Memory used by the BGP process depends on the following factors:
![]() Number of BGP peers
Number of BGP peers
![]() Number of BGP prefixes
Number of BGP prefixes
![]() BGP Attributes
BGP Attributes
![]() Number of paths
Number of paths
![]() Soft-reconfiguration inbound
Soft-reconfiguration inbound
![]() Neighbor Route-map, both Inbound and Outbound
Neighbor Route-map, both Inbound and Outbound
![]() Filter-list
Filter-list
If there is not enough memory on the router, BGP sessions can fail to come up or existing sessions may go down. Also, the lack of free memory from one process may cause an impact to another process running on the system. For example CEF might get disabled when BGP has consumed too much memory on the router. Example 6-12 shows syslog messages of BGP sessions going down due to lack of memory on the router. The log shows that the BGP session starts going down just after the router faces a Memory Allocation Failure condition.
Example 6-12 BGP Sessions Down due to No Memory
Aug 30 01:56:36 89.200.128.90 306: 000292: Aug 30 01:56:34.909 BST:
%SYS-2-MALLOCFAIL: Memory allocation of 65536 bytes failed from 0x6063111C
Aug 30 01:56:36 89.200.128.90 310: -Process= "BGP Router", ipl= 0, pid=133
Aug 30 01:56:36 89.200.128.90 311: -Traceback= 605807A8 606357A0 60639EDC
60631124 609ED9D0 6099F7B4 609C5B6C 609C9A98 609CB0D0 609CBB7C 609B5FEC
Aug 30 01:56:39 89.200.128.90 312: 000293: Aug 30 01:56:38.986 BST:
%BGP-5-ADJCHANGE: neighbor 10.1.12.2 Down No memory
Aug 30 01:56:39 89.200.128.90 313: 000294: Aug 30 01:56:38.986 BST:
%BGP-5-ADJCHANGE: neighbor 10.1.13.2 Down No memory
Aug 30 01:56:39 89.200.128.90 314: 000295: Aug 30 01:56:38.986 BST:
%BGP-5-ADJCHANGE: neighbor 10.1.14.2 Down No memory
In Example 6-12, there is also a log message pointing toward the BGP Router process. This log message means that the BGP Router was requesting allocation of memory that failed because of insufficient memory on the router.
The insufficient memory on the router could be due to one of the following reasons:
![]() Insufficient memory installed on the router
Insufficient memory installed on the router
![]() Memory leak condition on the router
Memory leak condition on the router
Before investigating any memory issues on the router, the first insufficient memory issues are easy to deal with. The software version running on the router has a minimum memory requirement, which should always be verified. However, for certain features, which when enabled and based on their scale, memory beyond the minimum requirement may be required, such as large BGP tables. Upgrading the DRAM on the router resolves the problem. As a best practice when deploying a router, have the router installed with maximum memory supported to allow for future growth of the network. If the router continuously keeps on increasing the memory consumption without the addition of new feature or without multiple events on the router, that’s the possible indication of memory leak on the router. Various platforms have their own set of CLI to troubleshoot memory issues.
TCAM Memory
Along with the physical memory, the other important space to verify is the TCAM memory. Routers use the TCAM space to store the forwarding information to make fast lookups and thus speed up the forwarding process. In addition, the ACL entries, QoS, and other information associated with upper-layer processing is also stored in the TCAM space. Most of the high-end routers have sufficient TCAM space, but their default configurations might require adjustments. While deploying a router, ensure that the platform not only has sufficient DRAM but also has good TCAM space.
One such example is from August 8, 2014; the Classless Inter-Domain Routing (CIDR) Report reported that the global Internet routing table had passed 512,000 routes. Multiple routers were hit, including some of the high-end routers like the Cisco 7600. On the 7600, most of the Supervisor cards, such as WS-SUP720-3BXL or RSP720-3CXL-GE, have the maximum IPv4 TCAM space for 1,000,000 routes, but the default configuration splits this space so that IPv4 has 512,000. The rest is divided among MPLS, IPv6, and multicast entries. This caused the platforms to run out of TCAM space, which caused the routers to run into a FIB Exception state that caused the overflowing route entries to be software switched.
The exception status is verified using the show mls cef exception status command. The show mls cef maximum-routes command is used to verify the current maximum routes system configuration on the 7600 series platform. Increasing the TCAM value to accommodate the increased routing table helped resolve the problem. It is also important to understand that the platform hardware limitation may differ from what the software BGP table can hold. Platform limitations should always be considered and properly understood before implementing any scaled featured in a production environment.
Troubleshooting Memory Issues on Cisco IOS Software
There are two types of memory spaces on IOS devices: Process memory and Input/Output (IO) memory. When a feature is enabled on IOS devices, such as BGP, protocol independent multicast (PIM), and so on, IOS allocates the memory from the process memory pool. When software switched traffic hits the CPU, the IO memory comes into use. The CPU allocates IO memory to temporarily store the frame. There are two primary reasons why a Cisco IOS device runs out of memory:
![]() A process not freeing up memory after the memory is no longer in use. This behavior is generally known as memory leak.
A process not freeing up memory after the memory is no longer in use. This behavior is generally known as memory leak.
![]() A process does not limit the amount of memory it allocates, eventually using up all memory space on the router/switch.
A process does not limit the amount of memory it allocates, eventually using up all memory space on the router/switch.
The first problem can be identified using the show memory debug leaks [chunks] command. This command runs through the memory and tells which process is leaking memory. Because it has to run though the whole memory, this command is intrusive and might cause service disruptions due to high CPU utilization during the execution of the command (which does not last more than 2 to 3 minutes). So it is recommended to schedule a downtime (maintenance window) to offload the traffic to a backup device before running this command. But this command is helpful if the router is about to run out of memory and the only option is to reload the router to recover from the condition. There are also a set of show commands that can be used to identify a memory leak in a nonintrusive manner. These same commands can be used to identify if a process is not limiting the amount of memory it is allocating.
Note
If a router has run out of memory due to a memory leak condition, a reload on the router helps recover from the leaked condition, but the memory will most likely leak again. Thus, identifying the process causing the memory leak is important to fix the problem.
The second problem cannot be identified so easily and requires a set of commands to investigate the problem. The first step is to ensure there is a continuous decrement in the free memory available on the router. If the memory leak is happening very frequently or the memory utilization is incrementing rapidly, perform the command collection every 10 to 15 minutes. If the leak is happening slowly (over a period of time), collect the statistics and monitor them at least every week. The command show memory statistics is used to verify the summary usage of both the process memory and IO memory, as shown in Example 6-13.
Example 6-13 show memory statistics Command Output
IOS# show memory statistics
Head Total(b) Used(b) Free(b) Lowest(b) Largest(b)
Processor 2196404 72886064 10511756 17438236 12365600 11045704
I/O 2C00000 4194304 1669276 2525028 2489984 2523744
After it is clear from the output that the free memory is dropping, it needs to be understood which process is holding the most memory and if it’s releasing the memory or not. The command show processes memory sorted shows the information of various memory pools along with per process memory consumption statistics like Allocated, Freed, and Holding. These counters are useful to understand whether the consumption is continuously incrementing or the memory is getting freed up as well. Example 6-14 demonstrates the use of show processes memory sorted command to verify increasing consumption of memory by a process. The output shows that the free process memory went down from 20692936 bytes to 19001540 bytes.
Example 6-14 show processes memory sorted Command Output
IOS# show processes memory sorted
Processor Pool Total: 72886064 Used: 52193128 Free: 20692936
I/O Pool Total: 12582912 Used: 8576324 Free: 4006588
Driver te Pool Total: 1048576 Used: 40 Free: 1048536
PID TTY Allocated Freed Holding Getbufs Retbufs Process
0 0 49649092 11944860 34657140 0 0 *Init*
100 0 74848892 55133364 18754060 0 0 Bgp Router
0 0 51087472 50258644 846184 12086456 3864680 *Dead*
67 0 599948 10784 532384 0 0 Stack Mgr Notifi
IOS# show processes memory sorted
Processor Pool Total: 72886064 Used: 53884524 Free: 19001540
I/O Pool Total: 12582912 Used: 8576324 Free: 4006588
Driver te Pool Total: 1048576 Used: 40 Free: 1048536
PID TTY Allocated Freed Holding Getbufs Retbufs Process
0 0 49649092 11944860 34657140 0 0 *Init*
100 0 81711876 60216436 20448016 0 0 Bgp Router
0 0 51139456 50313836 846184 12086456 3864680 *Dead*
After identifying the process that is increasingly consuming the memory on the router, use the command show process memory pid to get the program counter (PC) values that can then be used by Cisco Technical Assistance Center (TAC) for further investigation.
Note
A memory leak is an indication of a software defect; thus it is recommended to engage Cisco TAC to prevent the issue from happening again. A software upgrade or a patch may be required to fix the bad code causing the memory leak on the device.
From the BGP perspective, use the command show bgp afi safi summary to identify the memory consumption under each address-family. The output shows the following:
![]() Memory consumption by the network entries
Memory consumption by the network entries
![]() Number of path entries
Number of path entries
![]() Path/best path attribute entries
Path/best path attribute entries
![]() Route-map cache entries
Route-map cache entries
![]() Filter-list cache entries
Filter-list cache entries
![]() Total memory consumed by a particular address-family
Total memory consumed by a particular address-family
Example 6-15 illustrates how attaching a simple community increases the memory consumption. The first output shows there are two path/best path attribute entries consuming 304 bytes of memory and there is no BGP community entry. But as soon as a BGP community is attached, the path/best path attribute entry increases by 1, and now there is an entry for BGP community.
Example 6-15 BGP Memory Consumption
R1# show bgp ipv4 unicast summary
BGP router identifier 192.168.1.1, local AS number 65530
BGP table version is 3, main routing table version 3
2 network entries using 288 bytes of memory
2 path entries using 160 bytes of memory
2/2 BGP path/bestpath attribute entries using 304 bytes of memory
0 BGP route-map cache entries using 0 bytes of memory
0 BGP filter-list cache entries using 0 bytes of memory
BGP using 752 total bytes of memory
BGP activity 2/0 prefixes, 2/0 paths, scan interval 60 secs
Neighbor V AS MsgRcvd MsgSent TblVer InQ OutQ Up/Down State/PfxRcd
10.1.12.2 4 65530 4502 4498 3 0 0 2d20h 1
R1(config)# route-map TEST permit 10
R1(config-route-map)# set community 100:2
R1(config-route-map)# exit
R1(config)# router bgp 65530
R1(config-router)# address-family ipv4 unicast
R1(config-router-af)# neighbor 10.1.12.2 route-map TEST in
R1(config-router-af)# end
R1# show bgp ipv4 unicast summary
BGP router identifier 192.168.1.1, local AS number 65530
BGP table version is 4, main routing table version 4
2 network entries using 288 bytes of memory
2 path entries using 160 bytes of memory
3/2 BGP path/bestpath attribute entries using 456 bytes of memory
1 BGP community entries using 24 bytes of memory
0 BGP route-map cache entries using 0 bytes of memory
0 BGP filter-list cache entries using 0 bytes of memory
BGP using 928 total bytes of memory
BGP activity 2/0 prefixes, 2/0 paths, scan interval 60 secs
Neighbor V AS MsgRcvd MsgSent TblVer InQ OutQ Up/Down State/
PfxRcd
10.1.12.2 4 65530 4508 4505 4 0 0 2d20h 1
Monitor the overall memory usage of the BGP process using the commands in Example 6-15 to see if there are any changes that are causing the increase in memory or if the memory is continuously incrementing without any changes. One issue that was noticed in some old IOS software was memory utilization incrementing due to Idle neighbor sessions. As a best practice, it is recommended to shutdown the neighbors in the Idle state or remove the respective neighbor configuration if they have been down for a very long time and are supposed to stay down.
Another important factor that could lead to an increase in memory consumption is neighbor ip-address soft-reconfiguration inbound configuration, which was explained in Chapter 1, “BGP Fundamentals.” Using this configuration, BGP keeps the received routes from each of its peers in the Adj-RIB-In table, even after ingress routing policy has been applied and the routes are installed into the Loc-RIB table. Because the Adj-RIB-In is not purged and stays in memory, the memory consumption increases.
If a peer is receiving an Internet routing table, it is not a good idea to have soft-reconfiguration inbound configured. This command is useful if there are fewer routes being received by the router. The memory consumption might also vary on different IOS versions because of the code enhancements made over the years. Also, soft-reconfiguration inbound configuration has been discouraged since the introduction of BGP Soft Reset enhancement. Example 6-16 demonstrates the increase in memory consumption due to soft-reconfiguration inbound configuration.
Example 6-16 Increasing Memory Consumption due to soft-reconfiguration inbound
R1# show bgp ipv4 unicast summary
BGP router identifier 192.168.1.1, local AS number 65530
BGP table version is 5, main routing table version 5
2 network entries using 288 bytes of memory
2 path entries using 160 bytes of memory
3/2 BGP path/bestpath attribute entries using 456 bytes of memory
1 BGP community entries using 24 bytes of memory
0 BGP route-map cache entries using 0 bytes of memory
0 BGP filter-list cache entries using 0 bytes of memory
BGP using 928 total bytes of memory
BGP activity 4/2 prefixes, 5/3 paths, scan interval 60 secs
Neighbor V AS MsgRcvd MsgSent TblVer InQ OutQ Up/Down State/
PfxRcd
10.1.12.2 4 65530 1066 1068 5 0 0 16:04:58 1
R1(config)# router bgp 65530
R1(config-router)# address-family ipv4 unicast
R1(config-router-af)# neighbor 10.1.12.2 soft-reconfiguration inbound
R1(config-router-af)# end
R1# show bgp ipv4 unicast summary
BGP router identifier 192.168.1.1, local AS number 65530
BGP table version is 5, main routing table version 5
2 network entries using 288 bytes of memory
3 path entries using 240 bytes of memory
3/2 BGP path/bestpath attribute entries using 456 bytes of memory
1 BGP community entries using 24 bytes of memory
0 BGP route-map cache entries using 0 bytes of memory
0 BGP filter-list cache entries using 0 bytes of memory
BGP using 1008 total bytes of memory
1 received paths for inbound soft reconfiguration
BGP activity 4/2 prefixes, 6/3 paths, scan interval 60 secs
Neighbor V AS MsgRcvd MsgSent TblVer InQ OutQ Up/Down State/
PfxRcd
10.1.12.2 4 65530 1718 1715 5 0 0 1d01h 1
Troubleshooting Memory Issues on IOS XR
Unlike IOS, there is a maximum limit that can be allocated by each process on IOS XR. By default, the limit is 300 Mb but the process can expand its limit. For example, bgp process sets its limit to 2 Gb. Example 6-17 shows the present memory allocated and the maximum limit for each process.
Example 6-17 Memory Allocation by Processes on IOS XR
RP/0/0/CPU0:R10# run show_processes -m -h -t
JID Text Data Stack Dynamic Dyn-Limit Shm-Tot Phy-Tot Process
----- ------- ------ -------- --------- --------- -------- ------- -------
1145 400K 624K 128K 20M 2048M 22M 21M ipv6_rib
1144 400K 468K 156K 16M 2048M 22M 16M ipv4_rib
1052 1000K 5M 384K 16M 2048M 21M 22M bgp
1161 2M 1M 204K 13M 1024M 23M 15M pim6
1160 2M 1M 216K 11M 1024M 22M 13M pim
1158 472K 1M 232K 10M 512M 16M 12M igmp
1159 416K 1M 120K 10M 512M 16M 12M mld
1146 784K 920K 112K 6M 300M 20M 7M mrib
! Output omitted for brevity
The IOS XR command show processes memory is an alternate command to run show_processes -m -h -t command. The show_processes command is run on the shell and not on the router prompt.
Processes can get notification that they reached their limit, but if the process keep leaking memory and crosses its limit, it receives a signal 31 from the kernel. In this scenario, the process crashes and respawns. Every time a process crashes and respawns, the respawn counter increments in the show processes process-name command output.
On IOS XR, Watchdog System Monitor (wdsysmon) monitors how much free memory is present on each node (Route Processor [RP], LC, and so on). A router might still reach a low memory condition even when no process has reached its maximum limit. This happens when multiple processes try to allocate memory at the same time. The wdsysmon maintains multiple thresholds defined based on the % free memory available. These thresholds are seen by using the show watchdog threshold memory [default | configured] command. Example 6-18 shows the various wdsysmon thresholds on the IOS XR router.
Example 6-18 Memory Allocation by Processes on IOS XR
RP/0/0/CPU0:R10# show watchdog threshold memory configured location 0/0/CPU0
Configured memory thresholds:
Minor: 309 MB,
Severe: 247 MB
Critical: 154.780 MB
RP/0/0/CPU0:R10# show watchdog threshold memory defaults location 0/0/CPU0
Default memory thresholds:
Minor: 309 MB
Severe: 247 MB
Critical: 154.780 MB
Memory information:
Physical Memory: 3095 MB
Free Memory: 1610.335 MB
Memory State: Normal
In the case of BGP, the bgp process takes different actions when different thresholds are reached and include the following:
![]() In minor memory state, bgp can stop bringing up new peers and reduce the write limits when not set to default.
In minor memory state, bgp can stop bringing up new peers and reduce the write limits when not set to default.
![]() In severe state, bgp brings down some peers.
In severe state, bgp brings down some peers.
![]() In critical state, the bgp process shuts down. This is a severe error state and all routing protocol processes are shut down and it is required to manually bring them back up for recovery.
In critical state, the bgp process shuts down. This is a severe error state and all routing protocol processes are shut down and it is required to manually bring them back up for recovery.
The different thresholds work well in situations where a memory problem is due to scale (too many neighbors, too many prefixes, and the like) but if there is a memory leak problem, the leaking process continues to leak more memory, and the only way to recover is to restart the process.
To troubleshoot memory issues on IOS XR, the first step is to verify the show logging output from the router to see if there is any process crash due to signal 31 or if wdsysmon reports that the memory threshold is crossed. Use the show memory summary detail command output to view how much memory is in use and free memory on the node. Example 6-19 shows the output of the show memory summary detail command. The node has about 208 MB free memory available.
Example 6-19 show memory summary Output
RP/0/0/CPU0:R10# show memory summary detail location 0/0/CPU0
node: node0_0_CPU0
------------------------------------------------------------------
Physical Memory: 2.000G total
Application Memory : 1.813G (208.652M available)
Image: 62.794M (bootram: 62.794M)
Reserved: 128.000M, IOMem: 1.980G, flashfsys: 0
Shared window mfwdv6: 721.867K
Shared window ether_ea_shm: 79.171K
Shared window ether_ea_tcam: 203.378K
! Output omitted for brevity
Use the show processes memory command to identify the top users of the application memory. This commands needs to be collected from time to time as the leaking process keeps on consuming more and more memory shown under the Dynamic column of the output. If a particular process, such as bgp process, is holding the most memory, this does not mean that bgp is leaking memory on the router. The high memory utilization can be due to various reasons, like the number of neighbors or number of prefixes. The memory consumed should be periodically checked and compared to the total number of routes to be able to recognize a problem.
The commands previously mentioned can help in identifying memory issues, but they do not help in identifying if a particular process is causing a memory leak. To find a leaking process, IOS XR has an inbuilt tool that automatically computes which processes have allocated some memory between two snapshots. The show memory compare command provides this functionality in three easy steps:
Step 1. Take Initial Snapshot.
Step 2. Take the Delta Snapshot.
Step 3. Generate report on Delta from Initial Snapshot.
The show memory compare start command takes the first snapshot and saves it in the /harddisk:/malloc_dump/memcmp_start.out file. After the first snapshot is taken, wait for few minutes and then take the second snapshot using the show memory compare end command. This command saves the snapshot at the same location but with a different filename—memcmp_end.out. The final step is to compare both snapshots. The comparison is done using the show memory compare report command. After the comparison is made and the report is generated, the two files can be deleted from the disk. Example 6-20 demonstrates how memory leak can be identified using the show memory compare command.
Example 6-20 show memory compare Command
RP/0/0/CPU0:R10# show memory compare start
Sun Nov 8 07:21:01.040 UTC
Successfully stored memory snapshot /harddisk:/malloc_dump/memcmp_start.out
RP/0/0/CPU0:R10# show memory compare end
Sun Nov 8 07:24:36.545 UTC
Successfully stored memory snapshot /harddisk:/malloc_dump/memcmp_end.out
RP/0/0/CPU0:R10# show memory compare report
JID name mem before mem after difference mallocs restart/exit/new
--- ---- ---------- --------- ---------- ------- ----------------
1052 bgp 12715116 12743212 28096 68
283 licmgr 1210552 1226676 16124 29
389 tcp 1389648 1399904 10256 111
220 gsp 2837968 2847168 9200 2
315 nvgen_server 8515960 8522636 6676 258
1144 ipv4_rib 16709492 16715080 5588 48
373 sysdb_mc 2727856 2731288 3432 51
65712 exec 219660 220364 704 27
66 qnet 77472 77560 88 2
290 lpts_pa 465996 465924 -72 -1
309 netio 1165164 1164996 -168 -5
This process has to be performed multiple times to get to any conclusion. If the memory increases in the first iteration but reduces in the second or third iteration, this indicates that there might not be a memory leak. The trend needs to be monitored over a time period to determine if memory is actually leaking.
Note
After the preceding information is collected along with core files that are generated during the process, the crash can be shared with Cisco TAC for further investigation and root cause analysis.
Troubleshooting Memory Issues on NX-OS
NX-OS has different memory architecture from IOS or IOS XR. Linux by default is not designed to keep track of memory held by processes. With NX-OS, an intelligent mechanism called MTRACK is used for allocating and tracking memory held by Process IDs (PID) within the system.
In NX-OS, the total system memory is 4 GB. This system memory is further split into three regions:
![]() High Region
High Region
![]() Low Region
Low Region
![]() Preallocated
Preallocated
The preallocated region is a non-accessible memory space. The processes allocate their memory from the high region. The high region space is 3 GB in size. If the space in high region is exhausted (which is very unlikely), then the processes might use the space from low region. The low region memory space is responsible for kernel variable storage and Kernel Loadable Modules (KLM). The preallocated space and low region combine to hold 1 GB memory.
There are basically two types of memory issues that could occur on NX-OS platforms:
![]() Platform memory alerts
Platform memory alerts
![]() Process memory issues
Process memory issues
The kernel generates the platform memory alerts. The alert is first generated when a threshold called Minor threshold for total system usage or total kernel memory usage in the low region is reached. There are three thresholds defined within NX-OS: Minor, Severe, and Critical. Example 6-21 shows the alerts generated on the NX-OS platform. Use the show system internal memory-alerts-log command to view the platform memory alerts.
Example 6-21 Platform Memory Alerts
PLATFORM-2-MEMORY_ALERT:Memory Status Alert: MINOR. Usage 85% of available memory
PLATFORM-2-MEMORY_ALERT:Memory Status Alert: SEVERE. Usage 90% of available memory
PLATFORM-2-MEMORY_ALERT_RECOVERED: Memory Status Alert : SEVERE ALERT RECOVERED
PLATFORM-2-MEMORY_ALERT_RECOVERED: Memory Status Alert : MINOR ALERT RECOVERED
Use the show system resources command to investigate the cause of platform memory alerts.
The primary focus in this chapter is to investigate process memory issues. Process memory issues typically manifest themselves in the form of a crash. Each feature in NX-OS runs as a process on kernel. Any problem with an individual process does not impact other processes on the system. Though each process has its upper limit, there are no thresholds defined to notify the system that the memory is reaching its limit for a process. If the memory is exhausted, the process crashes, a core file is generated, and the process is then respawned.
Use the show processes memory [sort] command to view the processes consuming the most memory on a Nexus switch. Example 6-22 shows the sorted output of the show processes memory command. The bgp and the netstack processes are the two highest consumers as seen from the output.
Example 6-22 show processes memory sort Command
R20# show processes memory sort
PID MemAlloc MemLimit MemUsed StackBase/Ptr Process
----- -------- ---------- ---------- ----------------- ---------
6480 62111744 0 348655616 ff890870/ffffffff bgp
3530 45162496 726328806 329355264 ffe7a040/ffffffff netstack
3485 63488000 620038028 315682816 fffb27c0/ffffffff arp
4652 20865024 733660403 259649536 ffa8c050/ffffffff igmp
5323 13197312 603750566 250421248 ff832ef0/ffffffff mrib
5337 8732672 440584345 237690880 fffe4cf0/ffffffff mcastfwd
4646 12001280 583227392 233857024 fff8b4f0/ffffffff l2rib
4615 8589312 497931763 230301696 ffae16b0/ffffffff rpm
3489 5660672 490357440 228876288 ff9bdd10/ffffffff icmpv6
4778 12382208 253751052 228454400 ffb74c70/ffffffff ethpm
5326 7077888 487893286 225775616 ffdb5df0/ffffffff m6rib
! Output omitted due to brevity
The two important fields in this output are MemLimit and MemUsed. There are few processes like bgp that do not have an upper limit (MemLimit) set. The show processes memory command is useful but does not give granular information of the memory usage behind a process. To view more granular information, use the show system internal process-name mem-stats detail command. Some feature processes like bgp are not available under this command.
To view more granular information for the bgp process, use the show bgp internal mem-stats detail command. Example 6-23 shows the output of this command. The output shows various slabs like BGP IPv4 destination, BGP path, and so on. In this command, all the various address-families supported are shown as slabs and show the memory consumed under them.
Example 6-23 show bgp internal mem-stats detail Command
R20# show bgp internal mem-stats detail
bgp-65530, Memory statistics
BGP Memory status: OK
BGP memory usage stats
Private memory
Total mallocs/frees/failed : 2962/2912/0
Memory requested/allocated : 6021624/0 bytes
HWM requested/allocated : 6159416/0 bytes
Peer send buffer mallocs/reuses/frees/failed/hwm: 1709/3888/1708/0/2
Peer recv buffer mallocs/frees/failed/hwm: 4349/4349/0/1
Peer data buffer mallocs/frees/failed: 10/8/0
Peer data buffer allocated/hwm: 2/3
Shared memory
Total mallocs/frees/failed : 10028/16/0
Memory requested/allocated : 1199905/2919272 bytes
Memory requested by attr slab : 1200000
HWM requested/allocated : 1199905/2919272 bytes
Statistics of SLABs used by BGP
SLAB: BGP path slab (100 x 3000)
Slab alloc count : 100003
Slab max allocs : 100003
Slab total allocs : 100044
Slab total frees : 41
Slab total block allocs : 34
Slab block alloc failures : 0
Slab total block frees : 0
Slab max blocks : 34
SLAB: BGP IPv4 dest slab (68 x 3000)
Slab alloc count : 2
Slab max allocs : 4
Slab total allocs : 13
Slab total frees : 11
Slab total block allocs : 1
Slab block alloc failures : 0
Slab total block frees : 0
Slab max blocks : 1
!Output omitted for brevity
There is no simple method to investigate memory leaks on the NX-OS platform. The best indication of a memory leak for a process in NX-OS is a process crash. After it is known that a process is leaking memory from time to time, the memory utilization can be monitored. Debug plug-ins can be used to further diagnose the problem if needed with the assistance from Cisco TAC.
Note
Troubleshooting memory leaks on NX-OS requires debug plug-ins and is outside the scope of this book.
Restarting Process
If a process is facing memory issues, it either crashes or needs to be manually restarted to restore the process to its normal functionality. On IOS, there is no option to restart a process. A process crash actually triggers a router reload. Because IOS XR and NX-OS are distributed environments, each process is an individual entity and can be restarted. Use the process restart [job-id | process-name] command to restart the process on IOS XR. Use restart process-name instance-tag to restart an instance of the process on NX-OS. For example, use restart bgp autonomous-system-number to restart the bgp instance on NX-OS. However, some processes, like SNMP, cannot be restarted using this method. Not all processes can be restarted using this method.
Note
If BGP process is required to be restarted, BGP should be gracefully shut down first using the shutdown command under the router bgp configuration.
Summary
This chapter explained the various BGP processes functions and how different processes interact with each other. This chapter explained under what circumstances certain BGP processes and threads could cause a high CPU condition on the router, therefore producing an impact. Later, the chapter illustrated how to use different command-line tools to investigate memory leak conditions due to BGP process on various platforms. A few recommendations that can help prevent any network outages or service impact due to platform issues were also provided in this chapter, such as the following:
![]() Ensure the device has proper memory and resources to run the intended features.
Ensure the device has proper memory and resources to run the intended features.
![]() Ensure the device is running latest software release.
Ensure the device is running latest software release.
![]() Periodically baseline memory and resource utilization on the device.
Periodically baseline memory and resource utilization on the device.
![]() Maintain redundancy in place in case of a process or router restart.
Maintain redundancy in place in case of a process or router restart.
![]() Examine the scale of the network.
Examine the scale of the network.
![]() Based on the process consuming the most CPU resources, troubleshoot the problem.
Based on the process consuming the most CPU resources, troubleshoot the problem.
References
Cisco, Configuring and Managing Embedded Event Manager Policies, www.cisco.com.
Cisco, Cisco IOS EEM Command Reference, www.cisco.com.
Cisco, Troubleshooting Memory Problems, www.cisco.com.