4
Big Events, Crashes, and Panics
Of all the beliefs on Wall Street, price momentum makes efficient market theorists howl the loudest.
—James O’Shaughnessy
Rare events are always unexpected, otherwise they would not occur.
—Nassim Taleb1
Remember the Gomer Pyle character from The Andy Griffith show? I can see Gomer saying his classic TV line now:
An investment in Dunn Capital acts as a hedge against unpredictable market crises.
Dunn Capital Management
“Surprise, surprise, surprise.”
To comprehend trend following’s true impact you must look at its performance across the biggest events, bubbles and crashes of the last 50 years where it won huge profits in the zero-sum game of surprises.
While world governments and Wall Street are notorious for country wipeouts, central bank errors, corporate collapses, bank implosions, and fund blow-ups that transfer capital from losers to winners, the winners are almost always missing from after-the-fact analysis. Like clockwork, the press is over-the-top fascinated with the losers when surprises roll in. Following their lead, the public also gets caught up in the losers’ drama, oblivious to: Who were the winners and why did they win?
I’d say that Procter & Gamble did what their name says, they proctored and gambled. And now they’re complaining.
Leo Melamed
Sometimes they get close to the insight: “Each time there’s a derivatives disaster I get the same question: If Barings was the loser, who was the winner? If Orange County was the loser: Who was the winner? If Procter & Gamble was the loser: Who was the winner?”2
Prominent finance academics searching for winners often come up short, as Christopher Culp of the University of Chicago lamented: “It’s a zero-sum game. For every loser there’s a winner, but you can’t always be specific about who the winner is.”3
When big market events happen, smart people know the losers’ losses are going somewhere, but time passes and they stop thinking about it or forget the original goal. Reflecting on an implosion is not pleasant: “Fear is still in the bones of some pension fund trustees—after Mr. Leeson brought down Barings Bank. The failure of Barings Bank is probably the most often cited derivatives disaster. While the futures market had been the instrument used by Nick Leeson to play the zero-sum game and someone made a lot of money being short the Nikkei futures Mr. Leeson was buying.”4
Someone did make a lot of money trading short to Leeson’s long. But most of Main Street and Wall Street look at it through the wrong lens. Michael Mauboussin sees standard finance theory coming up short when explaining winners during high-impact times: “One of the major challenges in investing is how to capture (or avoid) low-probability, high-impact events. Unfortunately, standard finance theory has little to say about the subject.”5
The unexpected events so many bemoan are a source of outsized trend following profits. High impact and unexpected events, the black swans, have made many in this book very wealthy. One trader explains trend following’s success during uncertain times:
It often seems that trends create events more than events create trends. The event itself is usually a reflection of everyone getting it as Ed [Seykota] calls it, an aha. By this time, the trend followers usually have well-established positions.
Jason Russell6
For markets to move in tandem, there has to be a common perception or consensus about economic conditions that drives it. When a major “event” occurs in the middle of such a consensus, such as the Russian debt default of August 1998, the terrorist attacks of September 11, 2001, or the corporate accounting scandals of 2002 [and the 2008 equity market crash], it will often accelerate existing trends already in place . . . “events” do not happen in a vacuum . . . This is the reason trend following rarely gets caught on the wrong side of an “event.” Additionally, the stop loss trading style will limit exposure when it does—When this consensus is further confronted by an “event,” such as a major country default, the “event” will reinforce the crisis mentality already in place and drive those trends toward their final conclusion. Because trend following generally can be characterized as having a “long option” profile, it typically benefits greatly when these occurrences happen.7
Said more bluntly: “Even unlikely events must come to pass eventually. Therefore, anyone who accepts a small risk of losing everything will lose everything, sooner or later. The ultimate compound return rate is acutely sensitive to fat tails.”8 However, big events also generate plenty of inane analysis by focusing on the unanswerable like questions posed by Thomas Ho and Sang Lee, authors of The Oxford Guide to Financial Modeling9:
On Saturday, February 25, 1995, Mike Killian, who almost single-handedly built Barings Far East customer brokerage business over the past seven years, was awakened at 4:30 a.m. in his Portland, Ore., home. It was Fred Hochenberger from the Barings Hong Kong office.
“Are you sitting down?”
Hochenberger asked a sleepy Killian.
“No, I’m lying down.”
“Have you heard any rumors?”
Killian, perplexed, said no.
“I think we’re bust.”
“Is this a crank call?”
Killian asked.
“There’s a really ugly story coming out that perhaps Nick Leeson has taken the company down.”1010
- What do these events tell us about our society?
- Are these financial losses the dark sides of all the benefits of financial derivatives?
- Should we change the way we do things?
- Should society accept these financial losses as part of the “survival of the fittest” in the world of business?
- Should legislation be used to avoid these events?
It is not unusual to see market wins and losses positioned as a morality tale to be solved by government. This drama absolves the losers’ guilt for poor strategies (i.e., Amaranth, Bear Stearns, Bernard Madoff, LTCM, Lehman Brothers, Deutsche Bank, Valeant, etc.). Yet the market is no place for politics or social engineering. No law will ever change human nature. As Dwight D. Eisenhower noted: “The search for a scapegoat is the easiest of all hunting expeditions.”
Bottom line, trend following performance histories during the 2016 Brexit event, the 2014–2016 oil implosion, the 2008 market crash, the 2000–2002 Dot-com bubble, the 1998 Long-Term Capital Management (LTCM) crisis, the 1997 Asian contagion, and the 1995 Barings Bank and 1993 Metallgesellschaft collapses answer the all-important question: “Who won and why?”
One reason for this paucity of early information is suggested by the following part of the term trend following. The implication is one of passivity, of reaction, rather than of bold, assertive action—and human nature shows a distinct preference for the latter. Also, trend following appears to be too simple an idea to be taken seriously. Indeed, simple ideas can take a very long time to be accepted; think of the concept of a negative number, or of zero: simple to us, but problematic to our ancestors.
Stig Ostgaard Turtle
Event 1: Great Recession
The world changed as stock markets crashed during October 2008. Millions lost trillions of dollars when buy-and-hold-tight strategies imploded. The Dow, S&P, and NASDAQ fell like stones, with the carnage carrying over into 2009. Everyone felt it: jobs lost, firms going under, and fear all around. No one made money during this time. Everyone lost. That was the meme.
Hold on—is that true? It is not. There were winners during October 2008 and they made fortunes ranging from +5 percent to +40 percent in that single month. And trend following strategy was the winner. First, let me state how it did not win:
- Trend following did not know stock markets would crash in October 2008.
- Trend following did not make money from only shorting stocks in October 2008.
Trend following made money from many different markets; from oil to bonds to currencies to stocks to commodities, markets that trended up and down. It always does well in times of wild and extended price swings, in part because systems programmed into computers make calculated, emotionless buys and sells.
“We are not going to be the first to get in or the first to get out, but we are generally able to capture 80 percent of the trends,” opined a Superfund associate. For example, consider performance from January 2008 through October 2008:
- January: –2.21 percent
- February: 14.17 percent
- March: 1.59 percent
- April: –1.23 percent
- May: 6.52 percent
- June: 9.88 percent
- July: –10.26 percent
- August: –8.36 percent
- September: 2.59 percent
- October: 17.52 percent
This was not the only trend following trader winning big. Consider others during the period:
- One fund run by John W. Henry was up 72.4 percent through October 2008.
- TransTrend, a Dutch-based trend following trader managing more than $1 billion in assets, saw one of its funds go up 71.75 percent from January through November 2008.
- Clarke Capital Management saw its $72.2 million fund gain 82.2 percent through October 2008. As but one example of his winning bets, Clarke shorted crude oil when it was around $140, and then stayed with the trade down to $80 before exiting, thereby collecting the bulk of the trend.
- Trend following trader Bernard Drury started selling S&P 500 index futures short in November 2007. The index went down about 36 percent and the largest Drury fund roared up 56.9 percent through October 2008.11
- Paul Mulvaney, another trend following trader who has used a much longer timeframe in his trading (weekly bars), saw his fund post a 45.49 percent return for the month of October 2008—yes, in one month.
If you average out the returns per dollar per year on [trend following] managed futures funds, they’re between lousy and negative.
Charlie Munger
2007 Annual Shareholder Meeting
Note: Berkshire Hathaway dropped −51% over 2007–2009.
Another trend follower provided insights into his 2008 performance: “October 2008 provides a prime example of how [we] can produce gains in volatile and otherwise adverse market conditions. During this month and preceding months, [our] trading system not only profited from trends that were gaining momentum, but also responded to historic volatility by reducing or eliminating positions, and thus risk exposure, in markets in which trends were growing stale.”
How did they do it? “In February 2008, a sustained downward trend in the U.S. dollar against various currencies accelerated. This coincided with a significant rally in gold and energy markets. Many trend following trading systems . . . profited from short positions in the U.S. dollar [see Figure 4.1] and long positions in gold and energies.”
The other level of trend following is something else entirely. This is the meta-level, which sits above the tableau of material and psychological cause and effect, allowing participants to observe the behavior of the markets as a whole and to design intelligent, premeditated responses to market action. This is the level of trend following from which we as traders should—and usually do—operate.
Stig Ostgaard Turtle

FIGURE 4.1: U.S. Dollar Short Trade
They described the unfolding market chaos: “At the same time, several world stocks indices exhibited signs of weakness. By June, however, gold stumbled nearly $200 from recent highs above $1,000 per ounce [see Figure 4.2]. [We were able] to continue capturing gains in the U.S. dollar, energies, and stocks while reducing its long exposure to gold as returns in this market faltered.”

FIGURE 4.2: : Long Gold Trade
They clarified how events led to October 2008:
During July and August, profitable trends in the U.S. dollar, energies, and grains exhausted themselves. It was at this juncture that the our system repositioned itself for results in October despite short-term drawdowns during these two months. While speculative traders may have viewed the precipitous drop in energies and other commodities as an opportunity to add to their long positions, we identified the end of sustained trends in these markets and significantly reduced its positions, and therefore its risk, particularly in the U.S. dollar. Meanwhile, our system began identifying emerging trends in world treasury markets [see Figure 4.3], as well as meats and industrial metals.

FIGURE 4.3: :Long Five-Year Notes Trade
Figure 4.3 shows the patience trend following had to endure in the face of extreme volatility:
As October 2008 unfolded, my associate offered a behind-the-scenes take: “Approaching October, we were ready to take advantage of changing market conditions both because of positions we no longer held as well as positions we had entered during the subpar return periods of July and August. For example, we had avoided the potential for substantial losses from an 18.3 percent decline in gold futures and a 32 percent collapse in crude oil [see Figure 4.4] by reducing long exposure to these markets before their substantial October declines.”

FIGURE 4.4: Crude Oil Short Trade
Trend following also captured a major trend in the Nikkei 225 (see Figure 4.5):

FIGURE 4.5: Nikkei 225 Short Trade
But this is not about predictions, so when trends changed, the gears switched: “After having been short the U.S. dollar for most of the first half of 2008, by October, we had established positions designed to profit from the reversal of the U.S. dollar trend in July and August. At that point, currencies such as the British pound began to decline against the dollar [see Figure 4.6].”
It may surprise many to know that in my method of trading, when I see by my records that an upward trend is in progress, I become a buyer as soon as a stock makes a new high on its movement, after having had a normal reaction. The same applies whenever I take the short side. Why? Because I am following the trend at the time.
Jesse Livermore (1940)

FIGURE 4.6: British Pound Short Trade
Trend following realized the bulk of October profits as a result of the ability to capitalize on different market conditions while limiting losses based on a combination of diversification, flexibility, risk management, and discipline. While a substantial portion of trend following’s October profits were derived from short positions in the stock indices and world currencies, trend following also realized profits from long bond positions. It avoided major losses by reducing exposure to gold and energies as well.
Although not as large as some trend following traders in terms of assets under management, another trader offered insights into his 2008 performance. He took me through his trades where he saw monster returns while other market players gasped for air.
First he outlined a European interest rate trade (see Figure 4.7): “In the midst of the global financial crisis, we received signals on many short-term interest rates. The Euribor is a short-term interest rate futures contract traded at the EUREX. We bought on October 7 and are still long (through December 2008). Central banks around the globe began dropping interest rates to ward off equity market declines. Lower interest rates mean higher Euribor futures prices. Fundamentals did not drive our decisions.”

FIGURE 4.7: Long December 2008 Euribor Trade
He further explained how he profited from a short-term interest rate, the EuroSwiss (see Figure 4.8): “The EuroSwiss is another short-term interest rate futures contract. We entered this position well before the global equity market crash.”

FIGURE 4.8: :Long December 2008 EuroSwiss Trade
Consider his explanation about trading hogs (see Figure 4.9): “The Hog position was one of the most beautiful trends that I’ve seen in years. As the U.S. dollar rallied, nearly every commodity tied to the dollar moved violently. Although our larger portfolio gains happened in October, this position profited throughout the fall of 2008.”

FIGURE 4.9: Short December 2008 Lean Hogs Trade
Sure, people love to focus on stocks, but lumber of all things offered huge gains (see Figure 4.10): “Lumber was another great market over the fall of 2008. Lumber fell due to the housing crisis in the U.S. Lower demand means lower lumber prices. We sold the market short in the late summer and held the position until mid-November. However, it is important to keep in mind that we went short based off of price action, not fundamentals.”
Many professional speculators, including in particular exponents of the so-called Dow Theory widely publicized by popular financial journals, have adopted systems based in the main on the principle that it is advantageous to swim with the tide.
Alfred Cowles (1937)

FIGURE 4.10: Short January 2009 Lumber Trade
For you Starbucks connoisseurs, the coffee market fall 2008 was another major move (see Figure 4.11): “Although traded in London, Robusta Coffee is denominated in U.S. dollars. The move up in Robusta Coffee was helped in large part from a strengthening U.S. dollar. A higher dollar means less purchasing power in other currencies, pushing Robusta lower. My fundamental views once again mean little, we just followed the trend.”

FIGURE 4.11: Short January 2009 Robusta Coffee Trade
Perhaps no other market than the U.S. dollar was more consequential for trend following. It did not matter whether the strategy made money in the dollar going long or going short—it was agnostic to direction (see Figure 4.12): “The trend up in the U.S. dollar was cut into two segments. We saw more volatility in this contract than others, simply due to the U.S. equity markets. Although our entries and exits are tied to highs and lows in the U.S. dollar futures, moves in the U.S. equity markets influenced the price as well. The rise of this contract created opportunities in many of the other markets we trade, because they are so closely tied to the price of the dollar.”

FIGURE 4.12: Long December 2008 U.S. Dollar Trade
All you can do with trend following is take what markets give you. The goal is to make money in whatever market is trending and not fall in love with one particular market to the exclusion of another, better market opportunity.
We think that forecasting should be thought of in the light of measuring the direction of today’s trend and then turning to the Law of Inertia (momentum) for assurance that probabilities favor the continuation of that trend for an unknown period of time into the future. This is trend following, and it does not require us to don the garment of the mystic and look into the crystal balls of the future.
William Dunnigan (1954)
Day-to-Day Analysis
The market crash of 2008 offered fantastic evidence showing trend following as vastly different than the passive index mindset. Figure 4.13 shows daily data from trend follower Salem Abraham and lets you see day-to-day performance differences between his trend following fund and the S&P. For those who hear about trend trading wins in October 2008 and immediately want to scream lucky, look closely at the Abraham data. It is a great proxy for the other trend following traders as well.

FIGURE 4.13: Abraham Trading Compared to the S&P
Even though gains by the likes of Abraham and Mulvaney might make logical sense, in hindsight their performance is not easy to accept for indoctrinated EMT minds. Consider feedback from a reader attempting to sell his firm on trend following benefits:
I have been in discussions with trend following trader Mulvaney Capital Management since the summer for a company in which I was the COO. The board thought my ideas were too risky and that I tried to hit too many homeruns by potentially hiring Mulvaney. This particular [firm I was with] lost $30 million in September and October [2008]. I showed them the Mulvaney performance: $15 million invested in 1999 equated to $71 million today and $30 million over the same period equated to $142 million. After my presentation at a board meeting, I returned to my office and was told [that] next week . . . I was being eliminated as I was too big of a risk taker. My only other investment in my short tenure was with Abraham Trading and the returns equated to nearly positive 12 percent for the same time period. This was the only positive investment for the organization over that period. So much for my risk taking.
Logically, it is difficult to keep saying trend following is risky especially in the face of those risky leveraged, long-only buy and hold approaches that cratered in 2008, but Wall Street is not logical.
Conventional capital market theory is based on a linear view of the world, one in which investors have rational expectations; they adjust immediately to information about the markets and behave as if they know precisely how the structure of the economy works. Markets are highly efficient, but not perfectly so. Inefficiencies are inherent in the economy or in the structure of markets themselves . . . we believe inefficiencies in markets can be exploited through a combination of trend detection and risk management.
John W. Henry12
Event 2: Dot-com Bubble
The period from 2000–2002 was littered with volatile up-and-down markets. Although the prime story for that three-year period was the Nasdaq meltdown, several subplots unfolded, ranging from the September 11 surprise to the Enron debacle to major trend following drawdowns and subsequent recoveries to new highs. It is interesting to note how trend following performed, for example, compared to the 2002 S&P and NASDAQ (see Table 4.1).
TABLE 4.1: 2002 Performance Histories for Trend Followers
| Bill Dunn | +54.23% |
| Salem Abraham | +21.37% |
| John W. Henry | +45.06% |
| Jerry Parker | +11.10% |
| David Druz | +33.17% |
| William Eckhardt | +14.05% |
| Mulvaney Capital | +19.37% |
| S&P | –23.27 |
| NASDAQ | –31.53% |
| Dow | –16.76 |
Figures 4.14 through 4.21 show what trends they were riding to produce this performance.

FIGURE 4.14: Trend Followers and the S&P Chart, January 2002–December 2002
Source:Barchart.com

FIGURE 4.15: Trend Followers and the Dollar Chart, January 2002–December 2002
Source:Barchart.com

FIGURE 4.16: Trend Followers and the Yen Chart, January 2002–December 2002
Source:Barchart.com

FIGURE 4.17: Trend Followers and the Euro Chart, January 2002–December 2002
Source: Barchart.com

FIGURE 4.18: :Trend Followers and the T-Bond Chart, January 2002–December 2002
Source:Barchart.com

FIGURE 4.19: Trend Followers and the FTSE Chart, January 2002–December 2002
Source:Barchart.com

FIGURE 4.20: :Trend Followers and the Euro-Bund, January 2002–December 2002
Source: Barchart.com

FIGURE 4.21: Trend Followers and the DAX, January 2002–December 2002
Source: Barchart.com
Drawdowns and Recoveries
It’s no secret for the majority of 2000, trend following as a strategy was in a drawdown. It went down significantly heading into the last few months of the year (Figures 4.14 through 4.21). Some press and skeptics were eagerly calling the strategy finished, kaput.
I was not surprised when a Barron’s reporter contacted me for my opinion given the popularity of my trend following site at the time. She appeared to have it in for Henry and Dunn and was looking for confirmation that trend following was dead. I pointed out drawdowns had occurred in the past, but that over the long haul trend following has made tremendous amounts of money. She ignored those facts:
Convergent styles:
- World knowable
- Stable world
- Mean-reverting
- Short volatility
- Arbitrage-based
Divergent styles:
- World uncertain
- Unstable world
- Mean-fleeing
- Long volatility
- Trend Following
Mark S. Rzepczynski13
“John W. Henry isn’t alone in experiencing hard times. But the firm’s losses are among the most staggering . . . The company’s hardest-hit trend following trading program, called Financial & Metals, was down 18.7 percent in 1999 . . . Henry, whom one rival calls ‘our industry’s Dave Kingman,’ definitely swings for the fences. (Kingman hit 442 home runs during his 16 seasons in the majors, but he also struck out more than 1,800 times.) It’s unclear whether John W. Henry will make changes to his trading program, one he cooked up decades ago while on a vacation to Norway.”14
You have to wonder if this Barron’s reporter had taken the time to read Henry’s speech from November 2000 before writing her December article. Henry was hinting at new success around the corner: “Unfortunately, markets do not step to a drummer we control. The period we have just been through has been terrifically painful for investors, brokers, general partners, and trading advisors. Drawdowns affect everyone emotionally, psychologically, and physically when they persist. It becomes very easy to envision a scenario in which things never get better. However, experience tells us that things inevitably look bleakest before the tide turns.”15
The tide was indeed turning. On January 10, 2001, this same reporter sent me an e-mail to say she was doing a follow-up story and wanted a comment. I was impressed she was willing to set the record straight because Dunn made 28 percent in November 2000 and 29 percent in December 2000. Henry made 13 percent in November 2000 and 23 percent in December 2000. Here’s her follow-up:
Don’t be fooled by the calm. That’s always the time to change course, not when you’re just about to get hit by the typhoon. The way to avoid being caught in such a storm is to identify the confluence of factors and to change course even though right now the sky is blue, the winds are gentle, and the water seems calm . . . After all look how calm and sunny it is outside.
Thomas Friedman The World Is Flat
Wall Street’s biggest commodity-trading advisers posted a dramatic turnaround in the fourth quarter, turning last year’s heart-stopping losses into gains for the year. “This rebound is not a surprise,” says Michael Covel, of TurtleTrader.com, which tracks trend followers . . . Henry, a high-profile commodities-trading firm in Boca Raton, Florida, profiled by Barron’s last month, posted a 20.3 percent return last year in its largest trading program which was down 13.7 percent for the first nine months of the year, powered back 39.2 percent in the fourth quarter.16
How was Henry able to power back 39.2 percent in the fourth quarter of 2000 after posting a loss of 13.7 percent for the first nine months of the year? What trends did he ride? Where was his target of opportunity? The answers can be found in Enron, California, and natural gas.
After having experienced a 40.0 percent decline through September 2000, Dunn Capital Management finished 2000 with a 17.3 percent asset weighted composite return. Dunn’s 75.5 percent gain in the fourth quarter delivered $590 million to its investors; its annualized composite compound return since the firm’s inception over 26 years ago is now 24.3 percent.17
Enron, California, and Natural Gas
If you examine the natural gas market during the last few months of 2000 and almost all of 2001, you can see obvious trend trading opportunity. For trend following, the natural gas market’s massive trend up and down were the source of immense profit.
The losers of course were Enron and the State of California. Enron’s collapse is a classic case of greed, fear, and ultimately incompetence on an epic scale. From Enron’s upper management’s manipulation of the facts, to the employees who purposefully ignored the manipulations, to the State of California’s inept attempts to play energy markets, everyone should have been accountable for foolishness. That said, in the zero-sum game everyone is responsible, whether they admit it or not.
Q: Why didn’t Wall Street realize that Enron was a fraud?
A: Because Wall Street relies on stock analysts. These are people who do research on companies and then, no matter what they find, even if the company has burned to the ground, enthusiastically recommend that investors buy the stock.
Dave Barry
The Enron debacle is stunning when you consider the losers. The number of investors who deluded themselves into thinking they were on a path to quick riches is incalculable. Portfolio managers of pension funds, university endowments, individual investors . . . everyone was caught up in the exhilaration of a company that seemed to go in only one direction—up. Owners of Enron stock never stopped seeing the pot of gold. They looked the other way and suspended their disbelief to celebrate the zooming share price.
However, there was a gargantuan misstep: They had no strategy to sell when the exit time arrived as the Enron trend turned hard the other way. That Enron crash chart (see Figure 4.22) is now famous. And there was only one piece of data needed to judge Enron: the share price. At its peak the company’s stock traded at $90 a share, but it collapsed to 50¢ a share. Why would anyone with a pulse hold onto a stock that goes from $90 to 50¢? Even if Enron was the biggest scam ever propagated, hopeful investors who held on all the way down to 50¢ a share are as responsible as Jeff Skilling. Blind investors bear responsibility for not selling and losing their money. The chart was telling anyone who cared that the trend had not only changed, but Enron was going to zero and fast.

FIGURE 4.22: Enron Stock Chart
Source:Barchart.com
Not only were there massive winners and losers in Enron stock, but huge losses were also seen in natural gas during the 2000–2001 California energy crisis. Enron was a primary supplier for California natural gas. And California, bound by its own flawed deregulation schemes, freely signed long-term contracts with energy trading firms buying Enron natural gas for their electricity.
They say patience is a virtue. For me patience is synonymous with discipline. You must have the discipline to know that markets change and poor periods are followed by good period. Longevity in this business—I have seen it again and again—is measured by discipline.
John W. Henry18
Not surprisingly, with inexperienced players and bad agreements in place, Enron and the State of California forgot natural gas was just another market. Like any market it was subject to go up or down for any number of reasons. Eventually natural gas spiked up and then down in ferocious trends. Unfortunately, neither Enron nor the State of California had a plan in place to deal with price changes.
Feeling abused, California complained loudly. California Senator Diane Feinstein maintained they had no culpability in the game: “I am writing to request an additional hearing to pursue what role Enron had in the California energy crisis with respect to market manipulation and price gouging. Enron’s ability to deal in complex unregulated financial derivatives in the natural gas market while controlling a tremendous share of the gas trading market provided Enron the ability to manipulate market prices. This was very likely a key factor in driving up gas and electricity prices leading to the California energy crisis.”
It has been said the Enron crisis cost California $45 billion over two years in higher electricity costs and slowed economic growth. When you look at the charts of natural gas (see Figure 4.23) and Enron (see Figure 4.22), you have to question Feinstein’s basic understanding of markets:

FIGURE 4.23: Natural Gas Stock Chart
Source: Barchart.com
Why did California lock itself into stringent agreements with firms like Enron? Why did California, through its own deals, trade outside typical market structures? Why couldn’t they deal with a changing natural gas price? The State of California alone is at fault for its inept decisions.
Anyone at any time can trade natural gas. Anyone can hedge a natural gas position. The opportunity to speculate and hedge is there for everyone. It is not a novel concept. Trend following traders were playing the natural gas game, too, riding it up and down for profit, as Table 4.2 demonstrates.
Among the hottest funds this year [2002] is Dunn Capital Management, which is up more than 50 percent. The firm from Stuart, Florida, profited on trades on Japan’s Nikkei, Germany’s DAX, and Britain’s FTSE stock indexes, as well as on bond and Eurodollar interest-rate futures.19
The thing you have to worry about is the thing you haven’t thought about.
Howard Marks
TABLE 4.2: Trend Followers’ Performance
| Dunn Capital Management WMA | |
| October 2000: | +9.12% |
| November 2000: | +28.04% |
| December 2000: | +29.39% |
| January 2001: | +7.72% |
| John W. Henry Financials and Metals | |
| October 2000: | +9.39% |
| November 2000: | +13.33% |
| December 2000: | +23.02% |
| January 2001: | +3.34% |
| Graham Capital Management K4 | |
| October 2000: | +1.44% |
| November 2000: | +7.41% |
| December 2000: | +9.37% |
| January 2001: | +2.37% |
| Man Investments | |
| October 2000: | +4.54% |
| November 2000: | +10.30% |
| December 2000: | +10.76% |
| January 2001: | +1.49% |
| Campbell & Company Financials and Metals | |
| October 2000: | +3.19% |
| November 2000: | +5.98% |
| December 2000: | +2.38% |
| January 2001: | –1.09% |
| Chesapeake Capital | |
| October 2000: | –0.62% |
| November 2000: | +7.42% |
| December 2000: | +8.80% |
| January 2001: | –0.43% |
| Abraham Trading | |
| October 2000: | +9.51% |
| November 2000: | +8.58% |
| December 2000: | –0.18% |
| January 2001: | +2.28% |
One Enron employee lashed out at the sordid affair: “My fellow (former) colleagues have no one to blame other than themselves for allowing such disastrous losses to occur in their retirement accounts. An abdication of personal responsibility should not be rewarded. It is a sad consequence, but it is reality.”20
From private mutual fund companies like Janus to retirement funds managed by State governments, none of them had a plan for exiting Enron. They all bought the stock assuming it would only go up, but walking away was never part of their plan. “Hold on forever” was the mantra. Yet the Enron story is more profound than the tale of one company’s disaster. It is the all too typical story of inept individuals managing billions of retirement wealth. Losses in Enron were staggering:
- Japanese banks lost $805.4 million.
- Abbey National Bank lost £95 million.
- John Hancock Financial Services lost $102 million.
- British Petroleum retirement lost $55 million on Enron debt.
David Brady, a Stein Roe Focus Fund manager: “Where did I go wrong? If I learned anything, I learned the same old lessons . . . The numbers just didn’t add up. If you had looked at the numbers the balance sheet would have showed you the real problems.”
Notice he blames balance sheets and not his choices. Public retirement accounts led by essentially DMV workers recklessly bet on Enron to go up forever as well:
The best way I can explain it is that many investors believed that our returns were in some way inferior to the returns of many other hedge fund strategies, because of a perception of higher volatility, and lower absolute returns. The additional . . . benefits of low correlation, transparency, liquidity, and effective regulation somehow escaped their attention.
Campbell & Company21
- The Kansas Public Employees Retirement System had about $1.2 million invested in about 82,000 shares of Enron stock. “It was based on (Enron’s) spectacular earnings growth and many analysts recommended it as a hot stock,” said David Brant, Kansas Securities Commissioner.
- The retirement fund for the City of Fort Worth lost nearly $1 million in Enron.
- The Teacher Retirement System of Texas first invested in Enron in June 1994. It realized a net loss of approximately $23.3 million from its Enron stock holdings and $12.4 million in net unrealized losses from its current bond holdings in Enron. Jim Simms of Amarillo, a board member for six years and chairman of the board, said: “We’re human beings—when you’re investing money you’ll have some winners and some losers . . . You can’t protect yourself when you’re being fed inaccurate information . . . We had all the precautions in place.”
There were no precautions in place. No fail-safes. No stops. Enron’s fall from grace was no different than any other corporate implosion, although the losers (such as those in Table 4.3), as this quote reminds, always need to call it new to rationalize losses. However, the game never changes, even if the company names do.
TABLE 4.3: Largest Shareholders in Enron (Percent Fund in Enron Shares)
| Alliance Premier Growth (4.1%) |
| Fidelity Magellan (0.2%) |
| AIM Value (1%) |
| Putnam Investors (1.7%) |
| Morgan Stanley Dividend Growth (0.9%) |
| Janus Fund (2.9%) |
| Janus Twenty (2.8%) |
| Janus Mercury (3.6%) |
| Janus Growth and Income (2.7%) |
| Rydex Utility (8%) |
| Fidelity Select Natural Gas (5.7%) |
| Dessauer Global Equity (5.6%) |
| Merrill Lynch Focus Twenty (5.8%) |
| AIM Global Technology (5.3%) |
| Janus 2 (4.7%) |
| Janus Special Situations (4.6%) |
| Stein Roe Focus (4.2%) |
| Alliance Premier Growth (4.1%) |
| Merrill Lynch Growth (4.1%) |
An interesting aspect of the Enron fiasco was the close relationship between the Enron share price and natural gas. To lose money in Enron stock was to lose money in natural gas. They were connected at the hip. Enron acted as a derivative for natural gas. The company presented mutual funds and pension funds an opportunity to get into natural gas speculation even if their mission statement had them limited to stocks. Using Enron as a proxy, mutual and pension funds were able to ride natural gas to the top without ever taking a position in natural gas. Not only was everyone buying and holding Enron; they were, for all intents and purposes, buying and holding natural gas. The data makes the case:
All the intensive research these firms performed did not protect them, or their investors, from massive losses. It is particularly noteworthy [that] Janus, whose commercials tout their superior research efforts and skills, [held] over 16 million shares. On April 30, 2001, the last time it reported individual fund holdings, 11 Janus funds collectively owned more than 5 percent of Enron. As of Sept. 30, Janus still owned more than 5 percent of Enron. Another touter of their superior stock-picking skills is the Fidelity family of funds. As of September 30, 2001, together they owned 154 million shares. So much for the value or research [of Janus and Fidelity].
Larry Swedroe22
September 11, 2001
September 11, 2001 demonstrates unpredictable on a grand scale. How could anyone know in advance where the safe place to be was? Before considering September 11 specifically, consider Ed Seykota’s words in general: “A surprise is an event that catches someone unaware. If you are already on the trend, the surprises seem to happen to the other guys.”23
No one predicted a terrorist attack would close Wall Street for four days. Although it was difficult to stay focused on the rigors of everyday life, trend following maintained. It confronted markets as it always had—with a plan set in motion long before the unexpected event happened.
We don’t see things as they are. We see things as we are.
Anaïs Nin
Trend following was short stocks and long bonds ahead of the attack because those markets were already headed in that direction. For example, Sunrise Capital Partners noted how lucky they were to be positioned ahead of the attack. Further, Campbell & Company made the case that currency markets had followed through with continued trends. “The U.S. dollar had already begun to weaken before the attacks, hence Campbell was short that market.” Campbell had been long bonds and short a number of global stock index futures contracts ahead of the attack because of established trends.24
Although Enron, the California energy crisis, and September 11th are vivid illustrations of the zero-sum game with trend following as the winner, the story of Long-Term Capital Management in the summer of 1998 is an even better case study.
Event 3: Long-Term Capital Management
Long-Term Capital Management (LTCM) was a hedge fund that went bust in 1998. The story of who lost has been told repeatedly over the years; however, because trading is a zero-sum game, exploring the winners was the real story. LTCM is a classic saga of the zero-sum game played out in grand fashion with trend following again as the winner.
Trillion Dollar Bet, a PBS special, described how LTCM came to be. In 1973, three economists—Fischer Black, Myron Scholes, and Robert C. Merton—discovered an elegant formula that revolutionized modern finance. This mathematical Holy Grail, the Black–Scholes option pricing formula, was sparse and deceptively simple. It earned Scholes and Merton a Nobel Prize and attracted the attention of John Meriwether, the legendary bond trader of Salomon Brothers.
LTCM promised to use complex mathematical models to make investors wealthy beyond their wildest dreams. It attracted the elite of Wall Street’s investors and initially reaped fantastic profits managing money. Ultimately, theories collided with reality and sent the company spiraling out of control.25
This was not supposed to happen: “They were immediately seen as a unique enterprise. They had the best minds. They had a former vice chairman of the Federal Reserve. They had John Meriwether . . . So they were seen by individual investors, but particularly by banks and institutions that went in with them, as a ticket to easy street.”26
The most damaging consequence of the LTCM episode is, therefore, the harm done by the perception that Federal Reserve policy makers do not have the faith to take their own medicine. How can they persuade the Russians or the Japanese to let big institutions fail if they are afraid to do the same themselves?27
To understand the LTCM fiasco you again need to look at modern finance’s foundations. Merton Miller and his colleague Eugene F. Fama launched what became the efficient market theory: “The premise of the theory is that stock prices are always right; therefore, no one can divine the market’s future direction, which in turn, must be ‘random.’ For prices to be right, of course, the people who set them must be both rational and well informed.”28
In other words, Miller and Fama believed perfectly rational people would never pay more or less than any financial instrument was worth. As a fervent supporter of the efficient market theory, Myron Scholes was certain markets could not make mistakes. His associate, Robert Merton, took it a step further with his continuous-time finance theory, which essentially wrapped the financial universe into a supposedly tidy ball.29
Merton’s markets were as smooth as well-brewed java, in which prices would flow like cream. He assumed . . . the price of a share of IBM would never plunge directly from 80 to 60 but would always stop at 79¾, 79½, and 79¼ along the way.30
If LTCM’s universe was supposed to be in a tidy ball, it might have been because academic life—where Merton and Scholes pioneered their theories—was tidy. LTCM’s founders believed the market was a perfect normal distribution with no outliers, no fat tails, and no unexpected events. Problems began the moment these assumptions were accepted.
After Merton, Scholes, and Meriwether had Wall Street convinced the markets were a nice, neat, and continuous normal distribution and there was no risk and the party was on, LTCM began using mammoth leverage for the soon to come risk-free returns.
UBS said last week it would take a SFr950m ($686m) charge reflecting losses relating to its equity investment in LTCM, which was linked to an options deal that the former Union Bank of Switzerland had done with the hedge fund before merging with Swiss Bank Corporation to create the new UBS.31
Approximately 55 major banks gave LTCM financing including Bankers Trust, Bear Stearns, Chase Manhattan, Goldman Sachs, J.P. Morgan, Lehman Brothers, Merrill Lynch, Morgan Stanley, and Dean Witter. Eventually, LTCM would have $100 billion in borrowed assets and more than $1 trillion worth of exposure in markets everywhere. This type of leverage was not a problem initially—or so it seemed. Merton was even said to have remarked to Miller, “You could think of LTCM’s strategy as a gigantic vacuum cleaner sucking up nickels across the world.”
However, it was too complicated, too leveraged, and devoid of anything remotely resembling trend following risk management. The Organisation for Economic Co-operation and Development outlined a single trade example that uncovered LTCM’s overall trading strategy. It was a bet on the convergence of yield spreads between French bonds (OATs) and German bonds (bunds). When the spread between the OATs and the bunds went to 60 basis points in the forward market, LTCM decided to double its position. That deal was one leg of an even more complex convergence bet, which included hedged positions in Spanish peseta and Italian lira bonds.32
The result of all these complex convergences was no one had a clue what LTCM was up to risk-wise, including LTCM itself. Its professors ran a secretive and closed operation so convoluted that regulators and investors had no idea what, when, or how much they were trading. Not being able to price an instrument or trade freely in and out of it on a daily basis ignores what Wall Street calls transparency. Jerry Parker sees the differences between LTCM and his trading:
We’ve always had 100 percent transparency . . . The good thing about CTAs is their strategies are usually straightforward, not something that only a few people in the world can understand. We’re trend following and systems-based, something you can easily describe to a client . . . People who aren’t willing to show clients their positions are in trouble . . . One of the problems was that people put too much money in these funds such as Long-Term Capital Management. We ask for just 10 percent of risk capital, and clients know they may make 10 percent one month and lose 10 percent the next month. The ultimate error is to put a ton of money with geniuses who never lose money. When all hell breaks loose, those guys lose everything.33
Last month [August 1998], during one of the most stressful points in market performance, our largest portfolio, Financial and Metals, was up [an estimated] 17.7 percent. Of the $2.4 billion that we manage, I think just slightly over half of it is in the Financial and Metals Portfolio. This was not a direct result of the decline in the U.S. market—as I said we don’t trade in the S&P 500—but rather an example of the typical predictable investor behavior in the face of trouble. In reverting to rules of thumb, in this case, the flight to quality, global bonds rose, global stock markets plunged, and a shift in foreign exchange rates occurred. However, the magnitude of the moves was the only real surprise for us. The trends which were demonstrated during late August had been in place for weeks or months beforehand.
John W. Henry34
Even more than LTCM’s lack of transparency, the larger failure involved lightning as one critic noted: “I don’t yet know the balance between whether this was a random event or whether this was negligence on theirs and their creditors’ parts. If a random bolt of lightning hits you when you’re standing in the middle of the field, it feels like a random event. But if your business is to stand in random fields during lightning storms, then you should anticipate, perhaps a little more robustly, the risks you’re taking on.”35
The Black–Scholes option pricing formula did not factor in the randomness of human behavior—only one example of the negligence that ultimately would cause lightning bolts to zap LTCM in August and September 1998. When lightning struck LTCM, trend following was assessing the same markets—playing the zero-sum game on the other side. In hindsight, the University of Chicago professors were clearly aware of the problem as Nobel Laureate Professor Merton Miller noted: “Models that they were using, not just Black–Scholes models, but other kinds of models, were based on normal behavior in the markets and when the behavior got wild, no models were able to put up with it.”36
If only the principals at LTCM had remembered Albert Einstein’s quote that elegance was for tailors, part of his observation about how beautiful formulas could pose problems in the real world. LTCM had the beautiful formulas, but they were not for the real world. Eugene Fama, Scholes’s thesis advisor, had deep reservations about his student’s options pricing model: “If the population of price changes is strictly normal [distribution], on the average for any stock . . . an observation more than five standard deviations from the mean should be observed about once every 7,000 years. In fact, such observations seem to occur about once every three to four years.”37
For most investors, August 1998 was the month from hell. Not for William Dunn, though. His firm, Dunn Capital Management, with $900 million under management, had one of its best runs in years. He’s up 25.4 percent so far this year, and 23.7 percent in August alone.38
LTCM lost 44 percent of its capital, or $1.9 billion, in August 1998 alone. In a letter to LTCM’s 100 investors dated September 1998, John W. Meriwether wrote: “As you are all too aware, events surrounding the collapse of Russia caused large and dramatically increasing volatility in global markets throughout August. We are down 44 percent for the month of August and 52 percent for the year to date. Losses of this magnitude are a shock to us as they surely are to you, especially in light of the historical volatility of the fund.”39
At the time of Meriwether’s letter, LTCM’s history consisted of only four short years, and although its “losses of this magnitude” might have shocked LTCM, its clients, and the lender banks to whom it owed over $100 billion, those trading losses became the source of profits for trend following. Amazingly, years later, Scholes still seemed to have a problem with accepting personal responsibility for his action in the zero-sum game: “In August of 1998, after the Russian default, you know, all the relations that tended to exist in a recent past seemed to disappear.”40
Ultimately, the Fed, along with major world banks, most of which were heavily invested in LTCM, bailed the firm out. I believe if this bailout was not allowed to happen there would have been no precedent for the October 2008 bailouts, which made LTCM look like a walk in the park. The LTCM bailout stopped normal market forces. It set in motion the events of the next 10 years culminating in the fall of 2008. And the fixing of 2008, tracing back to LTCM’s fixing, brings the world up to today—waiting for the next one.
The Losers
CNN outlined LTCM losers:
- Everest Capital, a Bermuda-based hedge fund, lost $1.3 billion. The endowments of Yale and Brown Universities were invested in Everest.
- George Soros’ Quantum Fund lost $2 billion.
- High Risk Opportunity Fund, a $450 million fund run by III Offshore Advisors, went bust.
- The Tiger Fund run by Julian Robertson lost $3.3 billion in August and September of 1998.
- Liechtenstein Global Trust lost $30 million.
- Bank of Italy lost $100 million.
- Credit Suisse lost $55 million.
- UBS lost $690 million.
- Sandy Weill lost $10 million.
- Dresdner lost $145 million.
The Winners
As dramatic as the LTCM blowout story is, the real lessons you can learn are from the winners. Campbell & Company was candid:
If you look back to the early part of 1998, you will see it was a similar period in terms of industry returns. It was a very sad time all the way through July. And then out of nowhere it came, the collapse or the near-collapse of Russia in August and the LTCM crisis. All of a sudden, August was up 10 percent and September and October were up 4 percent or 5 percent, and many CTAs pulled down an 18 percent or 20 percent year out of nowhere. It’s very hard to put your head back where you were three months before that and say it looked like a very gloomy business without much of a future and all of a sudden we’re the place it’s all at. The hedge fund world had fallen apart, equities had gone into the toilet, and managed futures were king and on the front page of The Wall Street Journal. So some of this is the psychology of what we do.41
“There are two kinds of people who lose money: those who know nothing and those who know everything.” With two Nobel Prize winners in the house, LTCM clearly fits the second case.42
The Fed’s intervention was misguided and unnecessary because LTCM would not have failed anyway, and the Fed’s concerns about the effects of LTCM’s failure on financial markets were exaggerated. In the short run, the intervention helped the shareholders and managers of LTCM to get a better deal for themselves than they would otherwise have obtained.43
Trend following performance data for August and September 1998 looks like one continuous credit card swipe from LTCM to trend following—a zero-sum transfer swipe. During the exact period that LTCM lost $1.9 billion in assets, the aggregate profits (see Table 4.4) of Bill Dunn, John W. Henry, Jerry Parker, Keith Campbell, and Man exceeded $1 billion dollars.
TABLE 4.4: Trend Following Profits August–September 1998
| Dunn Capital Management WMA | |
| July 1998 | –1.37%, 575,000,000 |
| August 1998 | +27.51%, 732,000,000 |
| September 1998 | +16.8%, 862,000,000 |
| Dunn Capital Management TOPS | |
| July 1998 | –1.08%, 133,000,000 |
| August 1998 | +9.48%, 150,000,000 |
| September 1998 | +12.90%, 172,000,000 |
| John W. Henry Financials and Metals | |
| July 1998 | –0.92%, 959,000,000 |
| August 1998 | +17.50, 1,095,000,000 |
| September 1998 | +15.26, 1,240,000,000 |
| Campbell & Company Financials and Metals | |
| July 1998 | –3.68, 917,000,000 |
| August 1998 | +9.23, 1,007,000,000 |
| September 1998 | +2.97, 1,043,000,000 |
| Chesapeake Capital | |
| July 1998 | +3.03, 1,111,000,000 |
| August 1998 | +7.27, 1,197,000,000 |
| September 1998 | –0.59, 1,179,000,000 |
| Man Investments | |
| July 1998 | +1.06, 1,636,000,000 |
| August 1998 | +14.51, 1,960,000,000 |
| September 1998 | +3.57, 2,081,000,000 |
Note: Percent returns for each month and total money under management in that fund.
One of the former top executives of LTCM gave a lecture in which he defended the gamble that the fund had made. What he said was, “Look, when I drive home every night in the fall, I see all these leaves scattered around the base of the trees . . . There is a statistical distribution that governs the way they fall, and I can be pretty accurate in figuring out what that distribution is going to be. But one day, I came home and the leaves were in little piles. Does that falsify my theory that there are statistical rules governing how leaves fall? No. It was a man-made event.” In other words, the Russians, by defaulting on their bonds, did something that they were not supposed to do, a once-in-a-lifetime, rule-breaking event . . . this is just the point: In the markets, unlike in the physical universe, the rules of the game can be changed. Central banks can decide to default on government-backed securities.
Malcolm Gladwell44
Crunch the numbers on Dunn Capital Management’s World Monetary Assets (WMA) fund. Their fund made nearly $300 million for the months of August and September 1998 alone. For example, here are markets from which trend following strategy profited (see Figures 4.24–4.31).

FIGURE 4.24: Trend Followers and 10-Year T-Note, May 1998–December 1998
Source:Barchart.com
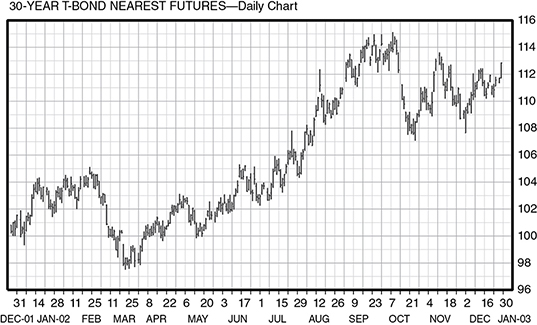
FIGURE 4.25: Trend Followers and U.S. T-Bond, May 1998–December 1998
Source:Barchart.com

FIGURE 4.26: Trend Followers and German Bund, May 1998–December 1998
Source:Barchart.com

FIGURE 4.27: Trend Followers and S&P, May 1998–December 1998
Source: Barchart.com

FIGURE 4.28: Trend Followers and Swiss Franc, May 1998–December 1998
Source: Barchart.com

FIGURE 4.29: Trend Followers and Eurodollar, May 1998–December 1998
Source: Barchart.com

FIGURE 4.30: Trend Followers and Yen, May 1998–December 1998
Source: Barchart.com

FIGURE 4.31: Trend Followers and Dollar Index, May 1998–December 1998
Source: Barchart.com
It isn’t that they can’t see the solution. It is that they can’t see the problem.
G. K. Chesterton45
LTCM’s failure lessons are now taught by all prominent business schools, but they leave out the winning lessons trend follower Jerry Parker teaches:
- Transparent—By and large, trend followers trade markets on regulated exchanges. They are not cooking up new derivatives in basements. Trend followers typically trade on freely traded markets where a price that everyone can see enables anyone to buy or sell. Trend followers have nothing in common with the derivatives fiascos that damaged Orange County or Procter and Gamble.
- Understandable—Trend following strategies can be understood by anybody. No high-level math only PhDs can comprehend.
- No rock stars—There are individuals who not only want to make money, but also want a rock star as their portfolio manager. They want to think that the strategy being used to make them money is exciting and state-of-the-art. Trend followers are not in the game for notoriety, only to win.
I always wonder what would have happened and how much more money trend following models would have made if LTCM had been allowed to implode without preferential government interference. And I asked Dunn Capital whether they thought LTCM’s bailout was proper. They replied with a one-word answer: No. Bill Dunn responded with even more clarity:
I believe the Long-Term Capital Management collapse was caused by:
- Their trading approach was based on the theory prices and relationships between prices tend to vary, but they also tend to return to their mean value over long periods of time. So in practice, they probably looked at a market (or a spread between markets) and determined what its mean value was and where the current price was in relation to their estimate of its “true mean” value. If the current price was below the mean, a “buy” was indicated, and if it was above the mean, a “sell” was indicated. (I don’t know what their exit strategy was.)
- The main problem with the above is that as market prices move further against your position, you will be experiencing losses in your open positions and your above trading approach would suggest that adding to the current position will prove to be even more profitable than originally expected. Unless this market very quickly turns and starts its anticipated return to its mean, additional losses will be suffered and the potential for profit will seem to become even greater, although elusive.
- This problem can only be overcome by either adopting a strict entry and exit strategy that is believed to promote survivability or by having a nearly unlimited amount of capital/credit to withstand the occasional extreme excursions from the mean, or better yet, adopt both of these ideas.
- But the situation became even more unstable when LTCM ventured into highly illiquid investment vehicles and also became a very major part of these very thin markets.
- In the end, they became overextended and they ran out of capital before any anticipated reversion to the mean could bail them out.
Those who cannot or will not learn from the past always set themselves up for another August–September 1998 lightening bolt. Another LTCM fiasco is always in the offing since the Black–Scholes way of life, where the world is a normal distribution, is still considered a viable approach to investing in 2017. Philip Anderson, joint winner of a Nobel Prize in Physics, sees the dangers in normal distribution thinking: “Much of the real world is controlled as much by the ‘tails’ of distributions as by means or averages: by the exceptional, not the mean; by the catastrophe, not the steady drip; by the very rich, not the ‘middle class.’ We need to free ourselves from ‘average’ thinking.”46
And breaking out from average thinking starts with hitting home runs (i.e., trend following) instead of hitting supposed sure-fire singles (i.e., LTCM).
Footnotes to LTCM
- Myron Scholes went on to form a new fund, Platinum Grove, after LTCM’s demise. With Scholes as chairman, Platinum Grove lost $600 million dollars during 2007–2008.
- A great story about LTCM hiring Goldman Sachs to assist raising cash during the crisis: “LTCM gave their derivatives positions to Goldman Sachs as part of their due diligence: ‘Goldman Sachs traders stayed up all night using the LTCM data to front-run their clients in markets around the world. Goldman, led by Jon Corzine, was in similar spread trades as LTCM, and was losing billions itself. With the LTCM data, Goldman unwound trades like a precision guided missile instead of a machine gun firing indiscriminately. Ultimately Goldman failed to raise money for LTCM, but it was mission accomplished in terms of gaining inside information. If Goldman could not save the system, it would at least save itself.’”47
Event 4: Asian Contagion
The 1997 Asian Contagion was another event where trend following won out. To this day in 2017 if you drive around Bangkok, Thailand or Kuala Lumpur, Malaysia, you can still see unfinished skyscrapers left as artifacts of yet another financial implosion. One of the biggest losers during this meltdown was infamous trader Victor Niederhoffer. Always opinionated, bombastic, and for most of his trading career, exceptionally successful, Niederhoffer’s trading demise was swift.
Niederhoffer played a big game, whether at speculating, chess, or squash. He challenged grandmasters in chess and he won repeated titles as a national squash champion. He regularly bet hundreds of millions of dollars and consistently won until Monday, October 27, 1997. That day he lost an estimated $50 million to $100 million, and his three hedge funds, Limited Partners of Niederhoffer Intermarket Fund L.P., Limited Partners of Niederhoffer Friends Partnership L.P., and Niederhoffer Global Systems S.A., bellied up.48
We make a lot more money trading at the level we do. The trade-off is volatility, but if it doesn’t cause you to perish, then you’re better off in the long run.
Dunn Capital49
On Wednesday Niederhoffer told investors in three hedge funds he runs that their stakes had been “wiped out” Monday by losses that culminated from three days of falling stock prices and big hits earlier this year in Thailand.50
Imagine receiving this letter faxed from Niederhoffer on Wednesday, October 29, 1997:
Niederhoffer seems unable to acknowledge that he, alone, was to blame for his losses in the zero-sum game. He did it. It was his strategy. No one else did it for him and using the unexpected as an excuse is no excuse. It is interesting to note his trading performance was long heralded as low risk. He made money almost every month. Compared to trend following drawdowns he was the golden boy making money as consistently as a casino. Who would want to place money with trend following and potentially tolerate a steep drawdown when they could put money with Niederhoffer, who seemed to combine similar performance with what appeared to be far less risk and almost no drawdown? That’s how the narrative looked before Niederhoffer’s flame out.
There are so many ways to lose, but so few ways to win. Perhaps the best way to achieve victory is to master all the rules for disaster, and then concentrate on avoiding them.
Victor Niederhoffer
But the idea Niederhoffer was devoid of risk disappeared quickly with his trading firm’s 1997 demise. Examine his performance numbers during that year (Table 4.5):
TABLE 4.5: Niederhoffer Performance52
| Date | VAMI | ROR | Quarter ROR | Yearly ROR | Amount Managed |
| Jan-97 | 11755 | 4.42% | |||
| Feb-97 | 11633 | –1.04% | |||
| Mar-97 | 10905 | –6.26% | –3.13% | $130.0M | |
| Apr-97 | 11639 | 6.73% | |||
| May-97 | 11140 | –4.28% | |||
| Jun-97 | 10296 | –7.58% | –5.58% | $115.0M | |
| Jul-97 | 11163 | 8.42% | |||
| Aug-97 | 5561 | –50.18% | |||
| Sep-97 | 7100 | 27.67% | –31.04% | $88.0M | |
| Oct-97 | 1 | –99.99% | |||
| Nov-97 | 1 | 0.00% | |||
| Dec-97 | 1 | 0.00% | –99.99% | –99.99% | 0 |
I felt there were very definite economic trends that were established from knowledge and the ability to know what events meant. I was looking for a way to participate in [those] major trends when they occurred, even though they were unexpected.
Bill Dunn53
When reviewing Niederhoffer’s performance meltdown (see Table 4.5), keep in mind in the last issue of The Stark Report where his performance was still listed, his ranking was as follows:
- Return: four stars
- Risk: four stars
- Risk Adjusted: four stars
- Equity: five stars54
The star rankings gave the impression Niederhoffer was risk-free. However, his trading, like LTCM’s, was predicated on a world of normal distributions. Measuring him with standard deviation as the risk measure gave an imperfect view of Niederhoffer’s true risk. Some observers were well aware of problems in Niederhoffer’s contrarian style long before the flameout. Frank J. Franiak spoke out six months earlier: “It’s a matter of time before something goes wrong.’’55
But Niederhoffer loyalists were concerned only with whether the profits were continually coming in even if his strategy was deeply flawed and potentially dangerous. His clients were enamored: “Whatever voodoo he uses, it works,” said Timothy P. Horne, chairman of Watts Industries Inc. (and a Niederhoffer customer since 1982).56
Victor Niederhoffer looked at markets as a casino where people act as gamblers and where their behavior can be understood by studying gamblers. He regularly made small amounts of money trading on that theory. There was a flaw in his approach, however. If there is a . . . tide . . . he can be seriously hurt because he doesn’t have a proper fail-safe mechanism.
George Soros57
The vast majority of Niederhoffer clients did not realize until after their accounts were toast that voodoo doesn’t work.
Niederhoffer on Trend Following
Five years after his blowout, Niederhoffer began ripping trend following: “Granted that some users of trend following have achieved success. Doubtless their intelligence and insights are quite superior to our own. But it’s at times like this, when everything seems to be coming up roses for the trend followers’ theories and reputations, that it’s worthwhile to step back and consider some fundamental questions: Is their central rule; is the trend is your friend valid? Might reported results, good or bad, be best explained as due to chance?” He added: “But first, a warning: We do not believe in trend following. We are not members of the Market Technicians Association or the International Federation of Technical Analysts or the TurtleTrader Trend Followers Hall of Fame. In fact, we are on the enemies’ lists of such organizations.”58
Niederhoffer continued: “No test of ‘the trend is your friend’ is possible, because the rule is never put forward in the form of a testable hypothesis. Something is always slippery, subjective, or even mystical about the rule’s interpretation and execution.”59 Even though the market is the ultimate arbiter (it’s always right), Niederhoffer still didn’t let go:
In my dream, I am long IBM, or priceline.com, or worst of all, Krung Thai Bank, the state owned bank in Thailand that fell from $200 to pennies while I held in 1997. The rest of the dream is always the same. My stock plunges. Massive margin calls are being issued. Related stocks jump off cliffs in sympathy. Delta hedges are selling more stocks short to rebalance their positions. The naked options I am short are going through the roof. Millions of investors are blindly following the headlines. Listless as zombies, they are liquidating their stocks at any price and piling into money market funds with an after tax yield of –1 percent. “Stop you fools!” I scream. “There’s no danger! Can’t you see? The headlines are inducing you to lean the wrong way! Unless you get your balance, you’ll lose everything—your wealth, your home!”60
In statistical terms, I figure I have traded about 2 million contracts—with an average profit of $70 per contract. This average profit is approximately 700 standard deviations away from randomness, a departure that would occur by chance alone about as frequently as the spare parts in an automotive salvage lot might spontaneously assemble themselves into a McDonald’s restaurant.
Victor Niederhoffer61
Many smart players to this day view Niederhoffer as brilliant, and I see his wisdom in some work and hope to have him on my podcast one day. But markets are unforgiving. Get the risk wrong, and it’s obituaries.
Event 5: Barings Bank
The first few months of 1995 go down as one of the most eventful periods in the history of speculative trading. The market events of that period, by themselves, could be the subject of a Harvard PhD finance course. But twenty years later, despite the enduring significance, the events have been forgotten and no Harvard class ever materialized.
What happened? A rogue trader, Nick Leeson, overextended Barings Bank in the Nikkei 225, the Japanese equivalent to the Dow, by speculating that the index would go higher. It tanked instead, and Barings—the Queen’s bank, one of the oldest, most well established banks in England—collapsed, losing $2.2 billion.
Niederhoffer is an inveterate contrarian. He feeds off panic, making short-term bets when prices get frothy. He condemns the common strategy of trend following, which helped make his buddy George Soros super-rich: “A delusion.”62
Who won the Barings Bank sweepstakes? That question was never asked by anyone—not The Wall Street Journal nor Investor’s Business Daily. Was the world interested only in a story about failure and not the slightest bit curious about where $2.2 billion went? Trend following was sitting at the table devouring Leeson’s mistakes.
The majority of traders do not have the discipline to plan 3, 6, and 12 months ahead for unforeseen changes in markets. However, planning for the unexpected is an essential ingredient of trend following strategy. Huge moves to profit from are always on the horizon if you are reacting to the market and not trying to predict it.
Despite his envy and admiration, [Nassim Taleb] did not want to be Victor Niederhoffer—not then, not now, and not even for a moment in between. For when he looked around him, at the books and the tennis court and the folk art on the walls—when he contemplated the countless millions that Niederhoffer had made over the years—he could not escape the thought that it might all have been the result of sheer, dumb luck.
Malcolm Gladwell63
Sadly, most market players only know to make decisions based on their perceptions of what the market direction will be. After they make their directional choice, they are blinded to any other option. They keep searching for validation to support their analysis even if they are losing colossal money—like Nick Leeson. Before the Kobe earthquake in early January 1995, with the Nikkei trading in a range of 19,000 to 19,500, Leeson had long futures positions of approximately 3,000 contracts on the Osaka Stock Exchange. After the Kobe earthquake of January 17, his buildup of Nikkei positions intensified and Leeson kept buying as the Nikkei sank.64
Who Won?
Observe the Nikkei 225 (see Figure 4.32) from September 1994 until June 1995. Barings’ lost assets directly padded the pockets of disciplined trend following traders.

FIGURE 4.32: Nikkei 225 September 1994–June 1995
Source: Barchart.com
A few months after Barings, John W. Henry’s performance (see Table 4.6) made the case clear:
TABLE 4.6: John W. Henry Trading Programs
| Name of Program | 01–95 | 02–95 | 03–95 |
| Financials and Metals | $648 | $733 | $827 |
| –3.8 | 15.7 | 15.3 | |
| Global Diversified | $107 | $120 | $128 |
| –6.9 | 13.5 | 8.5 | |
| Original | $54 | $64 | $73 |
| 2.1 | 17.9 | 16.6 | |
| Global Financial | $7 | $9 | $14 |
| –4.1 | 25.6 | 44.4 |
Note: Total money under management in millions with monthly percent returns.
Dean Witter (now Morgan Stanley) was Henry’s broker at the time: “I have over $250 million with Henry . . . I have been pleased to see how well the Original [Henry] Program has done so far in 1995: up over 50 percent through April 18 [1995].”65
Other trend followers brought home huge gains in February and March of 1995 (see Table 4.7). However, their winnings arguably were more from the Japanese yen trend up and down:
TABLE 4.7: 1995 Trend Following Performance
| Name | 01–95 | 02–95 | 03–95 |
| Chesapeake | $549 | $515 | $836 |
| –3.2 | –4.4 | 8.6 | |
| Rabar | $148 | $189 | $223 |
| –9.4 | 14.0 | 15.2 | |
| Campbell (Fin/Metals) | $255 | $253 | $277 |
| –4.53 | 5.85 | 9.58 | |
| Mark J. Walsh | $20 | $22 | $29 |
| –16.4 | 17.0 | 32.3 | |
| Abraham | $78 | $93 | $97 |
| –7.9 | 1.2 | 6.6 | |
| Dunn (WMA) | $178 | $202 | $250 |
| 0.5 | 13.7 | 24.4 | |
| Dunn (TOPS) | $63 | $69 | $81 |
| –7.6 | 9.9 | 22.7 | |
| Millburn Ridgefield | $183 | $192 | $233 |
| –6.5 | 8.7 | 19.4 |
Note: Total money under management in millions with monthly percent returns.
In my opinion, luck is far and away the most important determinant in our lives. Various events of infinitesimal probability—where you are born, to whom you are born, who you marry, where you take your first job, which school you choose—have an enormous impact on our lives. People tend to deny that luck is an important determinant. We like explanations. For instance, during a basketball game, there are innumerable random events. If a guy hits three in a row, he’s really hot. Most of the time, it’s random. Of course, the announcer doesn’t want to say, “Oh my! Another random event!” That’s not exciting, so he’ll give a reason. But it is just luck. Not all of our luck is good, but there is more good luck behind our performance than even I like to acknowledge.
Jim Simons66
There might be slight differences in leverage and signal timing, but even a quick glance makes clear: Immense trends equaled monster profits for almost all trend followers. Henry confirmed in 1998, albeit cryptically, his massive zero-sum Barings win:
The inflation story, of course, is not the most dramatic example. More recently Asia is another example of how one-time big events can lead to trends that offer us opportunity, and really shape our world. Whether you believe the causal story of banking excesses in Asia or not, there was a clear adjustment in the Asian economies that has been, and will continue to be, drawn out. Under these situations, it’s natural that trends will develop, and recognizing these trends allows us to capitalize on the errors or mistakes of other market participants. Because, after all, we’re involved in a zero-sum game.67
Henry and Leeson were indeed involved in the age-old zero-sum game—like in so many other historical examples. They both bellied up to the table, but there was one big difference—Henry had an actual strategy. What Leeson had nobody knows, but as long as he was making money, his bosses in England did not care. Yes, they cared after he destroyed the bank, but by then it was too late.
Event 6: Metallgesellschaft
Metallgesellschaft (MG) now has a new name and a new identity as a specialty chemicals plant and process-engineering concern. However, after 119 years of success as a German metals, trading, and construction conglomerate, it became best known for its high-profile trading loss of $1.5 billion (2.3 billion Deutsche Marks at the time).68
You know what’s coming—another zero-sum lesson in action. And while I am sure some might feel that an event this long ago holds no value—pause that thought and consider greed and fear.
The story starts with MG long crude oil futures on the New York Mercantile Exchange (NYMEX) through most of 1993. During that time period MG lost between $1.3 and $2.1 billion; the winners were trend followers. Over the course of 1993, crude oil futures (see Figure 4.33) slowly declined from May through December.

FIGURE 4.33: Crude Oil Futures, February 1993–February 1994
Source: Barchart.com
In the course of the next 12 months it became more and more obvious that other traders were formulating trading strategies that exploited MG’s need to liquidate its expiring long position. At the end of each trading month, as MG tried to liquidate its long positions by buying the offsetting shorts, other traders would add their short positions to MG’s, creating the paper market equivalent of a glut in supply that initially exceeded the number of longs, driving prices down until the market reached equilibrium. The combined force of MG’s selling its long position in the prompt contract and other traders increasing their short positions was severe downward pressure on crude prices as the prompt month contract neared expiration.69
You know the drill. There is always someone on the other side of a trade. The difficulty of course lies in determining who is on the opposite side of a position if only one side is publicly known. The fact MG lost was well known, but who won was my curiosity in the mid to late 1990s. And in the aftermath of the MG losses, a variety of explanations developed. The financial world was treated to academic mumbo jumbo from MBA students analyzing why MG lost as well as articles condemning energy futures. The actual explanation for implosion is simple: MG had zero trading strategy and lost.
One of the few things the post-mortems seem to have glossed over is the trap that MG had gotten itself into by becoming the dominant participant in the futures markets. By the fall of 1993, some traders had come to anticipate the rollovers of MG’s positions. As long as its huge position was in the market, MG hung there like a big piñata inviting others to hit it each month. The self-entrapping nature of its positions is what is missing from Edwards and Canter’s, and even Culp and Miller’s, defenses of MG.70
Trend following players had a major role in MG’s demise, and the job of explaining this was made easy with publicly available trend following performance data (see Table 4.8).
TABLE 4.8: Trend Follower Performance, June 1993–January 1994
| 6–93 | 7–93 | 8–93 | 9–93 | 10–93 | 11–93 | 12–93 | 1–94 | |
| Abraham | –1.2 | 6.6 | –5.3 | 1.2 | –6.6 | 3.5 | 12.5 | –1.45 |
| Chesapeake | 1.0 | 9.5 | 5.8 | –2.7 | –0.1 | 1.1 | 5.8 | –3.33 |
| JPD | –6.9 | 10.2 | –2.1 | –4.1 | –2.0 | 2.7 | 8.6 | –3.9 |
| Rabar | –1.3 | 14.8 | –3.9 | –4.1 | –6.0 | 5.6 | 10.1 | –10.5 |
| Saxon | –2.7 | 20.5 | –14.3 | –2.1 | –1.1 | 6.6 | 17.1 | –10.8 |
The key to explaining Table 4.8 lies in the months of July 1993, December 1993 and January 1994. Those months do not require much more than a casual glance at correlations to confirm the similarity in trend following strategies. Trend following made money in July and December and lost in January.
The academics, media, and everyone else, it seems, figured out professional traders were shorting energy markets and putting extensive pressure on MG. What the academics never found out or never seemed to be too interested to find out was who those professional traders were. The performance data was out there for everybody to look at. It wasn’t a secret. I found it on file with the United States Commodity Futures Trading Commission.
Every day trend following models dictate how many contracts or shares to trade based on total capital on hand at that time. For example, after trend following traders initiated positions and were rewarded with strong profits in July they were willing to risk those profits again. In August, with nice profits in hand, they were willing to risk those profits and still lose a fixed percentage based on original stops. They were willing to let profits on the table turn into losses. They let the market tell them when the trend was over (January 1994).
In the fall of 1993, trend followers continued to hold established short positions in crude oil futures. MG was long crude oil futures and desperately trying to stay afloat while trend followers waited like predators. However, trend followers were not short; they were aggressively short, reinvesting profits back into additional short crude oil positions as the market decreased more and more.
On the losing side of this zero-sum game, MG refused to take a loss early on. In fact, the whole MG affair would have been a footnote in trading history if they had exited after the July price decline. Instead, MG stayed in the game in hopes of an upward trend to make up for losses. They wanted to get back at the market and break even—a common psychological issue that bedevils new to pro traders to this day. But MG obviously had no inkling of the steely discipline of their trend following opponents. Not one trend follower was going to exit anytime soon. The price told them the trend was down. An exit would have violated one of trend following’s most fundamental rules, one of the most fundamental rules across all of successful trading: Let your winners run.
According to the NYMEX, MG held the futures position equivalent of 55 million barrels of gasoline and heating oil.71
As the story winds down, crude oil begins its final descent in late November and into December. At this time, MG management liquidated their positions and further fueled the November and December crude oil price drop. Ultimately, all good trends must end. And trend followers would eventually begin their crude oil futures exit in January 1994. If you look at the performance of trend followers in January 1994 (see Table 4.8), you can see what they lost for the month as they extricated themselves from their history-making profits of 1993 (see Table 4.9):
TABLE 4.9: 1993 Trend Following Returns
| Name | % Return |
| Abraham Trading | +34.29% |
| Chesapeake Capital | +61.82% |
| Man Investments | +24.49% |
| Rabar Market Research | +49.55% |
| Dunn WMA | +60.25% |
| John W. Henry | +46.85% |
| Mark J. Walsh | +74.93% |
| Eckhardt Trading | +57.95% |
“What’s one and one and one and one and one and one and one and one and one and one?”
“I don’t know,” said Alice. “I lost count.”
Lewis Carroll72
There is no shortage of big events in the past 50 years to show the prowess of trend following. However, there are rabid skeptics who suspect they know the Achilles’ heel of trend following strategy—the 1987 stock market crash.
The S&P lost 29.6 percent of its value during the 1987 crash and took until May 1989 to recover. EAFE Index, Jaguar, and Quantum performances were highly correlated to that of the broad market. Over the full period, Financial and Metals Portfolio earned nearly 260 percent on a composite basis.
John W. Henry73
Event 7: Black Monday
One of my favorite questions that I still hear to this day: “How did trend following do during the 1987 Black Monday stock crash?” “How did it do during a 20-standard-deviation event?” Their tone always says what they think the answer will be or what they hope it will be—that trend following was killed that day. I now must be the bearer of bad news for those skeptics. The fall of 1987 (see Tables 4.10 and 4.11) produced historic gains for trend following:
TABLE 4.10: October–November 1987 Stock Market Crash
| Name | % Return |
| S&P 500 | –28% |
| John W. Henry Original Investment Program | +58.2% |
| John W. Henry Financials and Metals Portfolio | +69.7% |
TABLE 4.11: Trend Following Performance 1987
| Name | % Return |
| Chesapeake Capital | +38.78% |
| JPD | +96.80% |
| Rabar | +78.20% |
| John W. Henry (Financials and Metals) | +251.00% |
| Campbell & Company (Financials and Metals) | +64.38% |
| Millburn Ridgefield | +32.68% |
| Dunn Capital Management (WMA) | +72.15% |
| Mark J. Walsh | +143% |
| Man Investments | +42.54% |
Success demands singleness of purpose.
Vince Lombardi
A speculative mania is a wonderful thing for our program. We do as much of that as possible. Unfortunately, in saying that, I sound a little bit anti–common man, man on the street. What’s bad for the general public is very good for our program.
Toby Crabel
“When you have eliminated the impossible, whatever remains, however improbable, must be the truth.”
Sir Arthur Conan Doyle74
I also pulled The Economist from March 1987, which to my fortunate surprise included quotes and references to a then 26-year-old David Harding and a then 31-year old Larry Hite. Highlights:
- Technical analysis of financial markets starts with the assumption markets follow trends determined by previous patterns of price behavior, and that rarely, if ever, move randomly.
- A chartist will attempt to discern a trend by spotting recognizable movements in the price of a security or commodity which confirm a break out, either up or down, from the range within which the price has previously been trading.
- Larry Hite compared a computer to an anvil. Ideas can be hammered out on it and discarded if they do not come up to scratch.
- David Harding’s computer system not only generates buy and sell signals; it also shows how long an investment should be held. Only 50 percent of his trades are profitable, but winners are on average 3× bigger than losers.
- 1987 critics call Harding and Hite’s trend following efforts a fad.75
I was having dinner with Larry Hite in late 2016 and I brought up that he was called a 1987 fad. But his mantra doesn’t change. What he said in 1987, he says in 2017. The evidence is in. All we can do is trust evidence, until it changes.
A main reason trend following trading has done so well for so long is because it has no quarterly performance constraints. Both Wall Street and Main Street measure success on the artificial constraints of the calendar. Trend following does not. For example, looking back at the end of 2008 you can see that without October 2008’s home run, trend following would have had a different performance profile. History now would be remembered differently.
The notion of quarterly performance measures implies you can predict the market or achieve profit targets. Quarters as a measurement might not be real, but they provide a comfortable structure for investors who mistakenly believe they can demand consistent profits. This demand for consistency has led to a constant search for the Holy Grail or hot hand, to the detriment of ever winning consistently.
Blaming derivatives for financial losses is akin to blaming cars for drunk driving fatalities.
Christopher L. Culp76
Imagine playing football where there are four quarters, and you have to score in each quarter to win. Imagine placing more importance on scoring in each quarter than winning the game. Now a great trend trader says, “I might score 28 points in any of the four quarters. I might score at any point in the game, but the object, at the end of the game, is to win.” If a trend following trader scores 28 points in the first quarter and no points in the next three quarters, and wins, who cares when he scored?
Trend followers are home run hitters taking what the market gives them no matter when it arrives. Absolute return traders have no profit targets. They view the world as a rolling return. I asked Bill Dunn how they address quarterly performance measures popular on Wall Street. I wanted to know exactly how they educate clients to appreciate big event hunting. His response: “Clients must already have an appreciation for the pitfalls of relying on short-term performance data before they can appreciate us.”
That’s blunt talk for a serious game.
On the other hand, after he retired, Julian Robertson publicly slammed his constraints, comparing them to a necessary but incompetent baseball umpire: “One of the great investors likened it to a batter not having an umpire. If you don’t have an umpire, you can wait for the fat pitch. The trouble with investing for other people, particularly in a hedge fund, is that you do have an umpire—called quarterly performance.”
Jason Gerlach, of trend following firm Sunrise Capital, provided even more event data buttressing the issues with calendar-mandated benchmarks. The S&P contrasted against a trend following index shows the historical performance differential when historical events hit:
Big money is made in the stock market by being on the right side of the major moves. The idea is to get in harmony with the market. It’s suicidal to fight trends. They have a higher probability of continuing than not.
Martin Zweig
| TIME PERIOD | EVENT | S&P 500 INDEX PERFORMANCE | BARCLAY CTA INDEX PERFORMANCE |
| 1987 Q4 | Black Monday | –22.53% | +13.77% |
| 2002 Q3 | WorldCom scandal | –17.28% | +6.77% |
| 2001 Q3 | 9/11 | –14.68% | +2.62% |
| 2011 Q3 | European debt crisis | –13.87% | +1.65% |
| 1990 Q3 | Iraq invades Kuwait | –13.75% | +5.82% |
| 2002 Q2 | Dot-com bubble | –13.40% | +8.20% |
| 2001 Q1 | Tech bear market | –11.86% | +3.75% |
| 1998 Q3 | Russian default/LTCM | –9.95% | +8.95% |
| 2008 Q1 | Credit crisis | –9.45% | +6.91% |
| 2008 Q3 | Credit crisis/bailout | –8.37% | –3.02% |
| 2000 Q4 | Dot-com bubble burst | –7.83% | +9.86% |
| 2015 Q3 | Fed policy uncertainty | –6.40% | –0.27% |
| 1999 Q3 | Y2K anxiety | –6.25% | –0.79% |
| 1994 Q1 | Fed rate hikes | –3.79% | –2.76% |
| 2007 Q4 | Credit crisis | –3.33% | +4.07% |
| 2003 Q1 | Second Gulf War | –3.15% | +0.72% |
| 1990 Q1 | Recession/oil spike | –2.99% | +5.43% |
Source: Sunrise Capital
Kieron Nutbrown, while not researching trend following, provided a chronology of financial crises and market panics dating from the Middle Ages to present day:
- 1255: Overexpansion of credit led to banking failures in 1255–62 in Italy
- 1294: Edward I default to the Ricciardi of Lucca during war with France
- 1298: Seizure of the Gran Tavola of Sienna by Philip IV of France
- 1307: Liquidation of the Knights Templar by Philip IV
- 1311: Edward II default to the Frescobaldi of Florence
- 1326: Bankruptcy of the Scali of Florence and Asti of Sienna
- 1342: Edward III default to the Florentine banks during the Hundred Years’ War
- 1345: Bankruptcy of the Bardi and Peruzzi; depression, Great crash of the 1340s
- 1380: Ciompi Revolt in Florence. Crash of the early 1380s
- 1401: Italian bankers expelled from Aragon in 1401, England in 1403, France in 1410
- 1433: Fiscal crisis in Florence after wars with Milan and Lucca
- 1464: Death of Cosimo de Medici: loans called in; wave of bankruptcies in Florence
- 1470: Edward IV default to the Medici during the Wars of the Roses
- 1478: Bruges branch of the Medici bank liquidated on bad debts
It’s frightening to think that you might not know something, but more frightening to think that, by and large, the world is run by people who have faith that they know exactly what is going on.
Amos Tversky
- 1494: Overthrow of the Medici after the capture of Florence by Charles VIII of France
- 1525: Siege of Genoa by forces of Spain and the Holy Roman Empire; coup in 1527
- 1557: Philip II of Spain restructuring of debts inherited from Charles V
- 1566: Start of the Dutch Revolt against Spain: disruption of Spanish trade
- 1575: Philip II default: Financial crisis of 1575–79 affected Genoese creditors
- 1596: Philip II default: Financial crisis of 1596 severely affected Genoese businessmen
- 1607: Spanish state bankruptcy: failure of Genoese banks
- 1619: Kipper-und-Wipperzeit: Monetary crisis at the outbreak of the Thirty Years’ War
- 1627: Spanish bankruptcy: collapse of Genoese banks and the Fuggers
- 1637: End of the Dutch Tulipmania; also, Dutch East India Company shares, canals
- 1648: French state bankruptcy, eliminated the Italian bankers
- 1652: Outbreak of the First Anglo-Dutch War: attacks by Britain on Dutch shipping
- 1666: Second Anglo-Dutch War: disruption of the Dutch spice fleet
- 1672: Rampjaar (Disaster Year) in Holland: French/English invasion
- 1696: English government debt crisis during the Nine Years’ War against France
- 1705: English crisis during the War of the Spanish Succession against France
- 1720: Collapse of the South Sea Bubble in England and Mississippi Bubble in France
- 1761: English government debt crisis over the Seven Years’ War against France
- 1769: Collapse of the Bengal Bubble in East India Company stock
- 1772: Credit Crisis in London and the American colonies
- 1783: Economic depression in Britain and America after the Revolutionary War
- 1792: Boom and bust in the First Bank of the United States after Hamilton’s refunding
- 1797: Land speculation bubble burst. Bank run in England on fear of French invasion
- 1802: Boom and bust after the Peace of Amiens between Britain and France
- 1807: Jefferson’s Embargo Act: restriction of trade with Britain
- 1812: Outbreak of the War of 1812 between America and Britain
- 1819: Land bubble burst; bank failures. Tightening by the Second Bank of the U.S.
- 1825: Emerging market (Latin America) bubble burst in London
- 1837: Collapse of bubbles in canals, cotton, and land; run on banks
- 1847: Collapse of railway boom in London (following Bank Charter Act)
- 1857: Global market panic; railway bubble; failure of Ohio Life Co.
- 1866: Failure of Overend Gurney and Co. in London; banking crisis
- 1869: Black Friday in New York: collapse of Gould and Fisk gold speculation
- 1873: Railroad bubble; Jay Cooke failure; end of silver coinage
- 1877: Great Railroad Strike: deflation and wage cuts following the Panic of 1873
- 1884: Tightening by New York City national banks; bank failures in New York
- 1893: Railroad bubble burst, bank failures, run on gold reserves; Sherman Silver Act
- 1896: Run on silver reserves; commodity price declines; National Bank of Illinois failure
There are three kinds of intelligence: one kind understands things for itself, the other appreciates what others can understand, the third understands neither for itself nor through others. This first kind is excellent, the second good, and the third kind useless.
Niccolo Machiavelli
- 1901: Cornering of Northern Pacific Railway stock
- 1907: Bankers’ Panic: cornering of United Copper Co.; failure of Knickerbocker Trust Co.
- 1910: Enforcement of Sherman Antitrust Act: breakup of Standard Oil Co.
- 1913: Drain of gold reserves to Europe in lead-up to WWI
There is no profit taking per se. We only exit on stop-losses, because profit taking would interfere with the unlimited upside potential we have, in theory, on every position. Our stop-loss policy is an actuarial model that analyzes the probability and consequences of hitting stops placed at various prices relative to the current market level. This allows us to estimate the expected loss associated with each possible exit point and hence to construct an optimal liquidation schedule.
Paul Mulvaney
- 1921: Depression of 1920–21: demobilization, monetary tightening; severe deflation
- 1929: Wall Street Crash/Black Tuesday: collapse of 1920s boom
- 1932: Great Depression trough: widespread bank failures
- 1938: Monetary and fiscal tightening following New Deal: Roosevelt Recession
- 1942: Response to Japanese/German successes in WWII
- 1948: Monetary tightening by the Federal Reserve; recession of 1949
- 1953: Monetary tightening to combat post–Korean War inflation in 1952
- 1957: Eisenhower Recession: monetary tightening to combat inflation
- 1962: Kennedy Slide/Flash Crash; Cuban Missile Crisis
- 1969: Nixon Recession: monetary and fiscal tightening to combat inflation and deficit
- 1974: Oil crisis (OPEC embargo): rising inflation and unemployment; stagflation
- 1979: Energy crisis (Iranian Revolution): monetary tightening under Paul Volcker
- 1982: Continued Fed tightening on energy crisis; defaults by Mexico, Brazil, Argentina
- 1984: Continental Illinois bank failure and seizure by the FDIC
- 1987: Black Monday: global market crash, collapse of speculative boom
- 1990: Gulf War: spike in oil price; recession of 1990–92
- 1994: Tequila Crisis: Mexico peso devaluation; Federal Reserve rate hikes
- 1998: Asia crisis (began 1997), Russia default, LTCM failure
- 2001: Collapse of Dot-com bubble; 9/11 attacks; corporate accounting scandals
- 2008: Collapse of housing bubble; Global Financial Crisis; Lehman, AIG etc. failures
In omnia paratus.
Prepared for all things.
- 2011: U.S. debt ceiling crisis and credit rating downgrade; eurozone sovereign debt crisis
- 2015: End of the Federal Reserve’s zero interest rate policy (quantitative easing ended 2014)
- 2016: Brexit
The surprise event list will never stop expanding. They say history is never the same, but it sure rhymes more often than not. That rhyming was why the following passage was added to my second edition in Fall 2005. It was commentary from The Economist circa February 2004:
The size of banks’ bets is rising rapidly the world over. This is because potential returns have fallen as fast as markets have risen, so banks have had to bet more in order to continue generating huge profits. The present situation “is not dissimilar” to the one that preceded the collapse of LTCM . . . banks are “walking themselves to the edge of the cliff.” This is because—as all past financial crises have shown—the risk-management models they use woefully underestimate the savage effects of big shocks, when everybody is trying to wriggle out of their positions at the same time . . . By regulatory fiat, when banks’ positions sour, they must either stump up more capital or reduce their exposures. Invariably, when markets are panicking, they do the latter. Because everyone else is heading for the exits at the same time, these become more than a little crowded, moving prices against those trying to get out, and requiring still more unwinding of positions. It has happened many times before with more or less calamitous consequences . . . There are any number of potential flashpoints: a rout in the dollar, say, or a huge spike in the oil price, or a big emerging market getting into trouble again. If it does happen, the chain reaction could be particularly devastating this time.77
The success of options valuation is the story of a simple, asymptotically correct idea, taken more seriously than it deserved, and then used extravagantly, with hubris, as a crutch to human thinking.
Emanuel Derman78
It seems LTCM could have survived one Nobel prize winner, but with two, they were doomed.
Frederic Townsend79
That prediction unfolded like a movie script in 2008. And it’s guaranteed to unfold again—though no one can accurately predict the next tsunami’s landfall.
Former LTCM counsel sees we are on borrowed time: “The reason to revisit the story [LTCM] now is to show how the 2008 panic was foretold by 1998’s events. Circumstances were different in 1998 and 2008, yet the dynamics were the same. Disturbingly, the next panic is now foretold by both 1998 and 2008. No lessons were learned. Elites simply expanded the bailout each time. Except next time the panic will be too large, and the bailout too small to stop it.”80 Nassim Taleb clarified further in easily understood lay terms in November 2016: “The market has been on Novocain since 2009.”
Still, numbed, and awash in zombie-film fascination, the average Joe will sit there, as Hunter S. Thompson crooned: “In a nation ruled by swine, all pigs are upward-mobile—and the rest of us are fucked until we can put our acts together: Not necessarily to Win, but mainly to keep from Losing Completely. We owe that to ourselves and our crippled self-image as something better than a nation of panicked sheep.”
Enjoy the ride. You can’t stop it.
Summary Food for Thought
- Trend following is generally on the right side of surprise.
- “It was a stunning development!”
- Value-at-risk (VAR) models measure volatility, not risk.
- Hunt Taylor: “The single worst descriptor of negative events is the hundred-year flood. Am I wrong? How many hundred-year floods have we lived through in this room? Statistically maybe we should have lived through one and we lived through seven now at this point.”
- Young America in Wall Street (1857): “The sooner the people of the United States make up their minds that the financial simoom of 1857 eclipses every other crisis since the time that Columbus was under obligations to a North American savage for a raccoon steak, the better.”
- Thomas F. Woodlock (1866–1945): “The principles of successful stock speculation are based on the supposition that people will continue in the future to make the mistakes that they have made in the past.”
- Peter Tchir: “My concern is that when something comes to bite us in the butt, it’s not going to be something we’ve traditionally looked at. And it’s going to take a while for the markets to adjust.”81
- Morgan Housel: “A normal person isn’t capable of leveraging their portfolio 100-to-1, losing everything when the market sneezes, and blaming it on a 25-sigma event. You need a PhD in physics to convince yourself of that.”
- Wolfgang Münchau: “The curse of our time is fake maths. Think of it as fake news for numerically literate intellectuals: it is the abuse of statistics and economic models to peddle one’s own political prejudice. The fakeness of the maths lies in an exaggerated inference. Economic models have their uses, as do opinion polls. They provide information to policymakers and markets. But nobody can see through the fog of the future.”
I’d rather be the second person going in the right door, then the first person going in the wrong door. React > predict.
Larry Tentarelli
Corporations make good and bad decisions every day offers one dealer. P&G made a bad trading decision. But if they came in with a Pampers diapers line that flopped, you wouldn’t have hearings in Congress, would you?82
When the mind is in a state of uncertainty, the smallest impulse directs it to either side. [Lat., Dum in dubio est animus, paulo momento huc illuc impellitur.]
Terence (Publius Terentius Afer)