25
How to GRAB a Bargain Trading Futures . . . Maybe
Mark Sleeman
My name is Mark Sleeman. I live in Auckland, New Zealand and am the sole principal of CTA firm M.S. Capital Management Limited. The next few pages detail a research project I originally undertook in conjunction with Ed Seykota in 2009 to contribute to the research on his “Trading Tribe” website (www.seykota.com). This is an updated version (September 2016). It has similar findings as the original version, but utilizes more up-to-date examples of market action to illustrate its points. The project creates and tests a computerized trading system that buys retracements and sells rallies—the opposite of how common trend following systems work. While I know that the buy-low, sell-high approach feels good to many traders, I wish to find out if it is actually profitable when subject to rigorous testing. I love to grab a bargain. The problem is my trend following system—like all trend following systems—doesn’t. It waits around until it sees a new uptrend and only then does it buy. Invariably, the buy signal comes long after the bottom. I find this extremely frustrating, and often wonder if it is possible to build a system that buys the bottoms and sells the tops. It is early January 2016 and I am watching the E-mini S&P 500 futures fall sharply against a background of plummeting oil prices and fears of a slowdown in China. Down and down the price goes. By January 20 it is at the August/September 2015 support level and I am thinking to myself, “This is cheap; I can jump in here and grab myself a bargain.” I really want to buy, but my boring old trend following system says “Stay out.” Prices jiggle sideways for a few weeks, then suddenly turn around and head up. Each day the market rallies, and each day I feel a growing knot in the pit of my stomach as I replay the situation over and over, only with me happily holding a long position, rather than watching hopelessly from the sidelines. As the price swiftly rises my feelings of anger and frustration rise with it. But, I listen to my system and do nothing. The price continues to rally. By early April the price is no longer a bargain, it is back up to resistance levels and looks expensive. I no longer want to buy, I want to sell short. But, what does my system do? It signals a buy. Reluctantly, I take the trade. Initially the market rallies for a few days, but then it starts to fall. Down and down it goes—it as if “they” know I am finally long. I watch my losses mount; the knot in my stomach a few days ago is nothing compared to what I am feeling now. I curse myself, and my system, for buying at the top. Eventually prices are looking cheap again. But is my system buying? No, it is selling. The trade is hitting its stop-loss point, and it is time to get out. Of course, prices then immediately rally again to new highs and my system goes long again. On June 24 the shock result of the Brexit vote sends prices into freefall: a heaven-sent opportunity to buy. What does my system do? It sells out. This happens one more time, with the system exiting on the big down day of September 9. I feel like an idiot; I seem to always be buying high and selling low. It is a zero-sum game, right? Someone must be making all the money that I am losing, but who? Who takes the money out of these markets? On reflection I figure it must be the “Pros.” I am sick of throwing my money away; it is time for me to figure out how the Pros trade—then I can start trading like they do! FIGURE 25.1 Trend Following System, E-Mini S&P 500 (Back-Adjusted) Just how do the Pros do it? I think about how smart operators succeed in other businesses. Then I remember the old adage that to sell right, you must first buy right. That’s it! That must be how the Pros trade. Not for them this silly game of buying at highs. I figure they wait patiently for bargains, and then pounce. All they have to do then is wait for the subsequent rally and sell. They can do this time and time again. And who are they selling to at the tops, and buying from at the bottoms? The sucker trend followers of course just like me. I decide to prove my theory by creating a computerized system that models my vision of how the Pros trade. I design it to buy when prices are cheap and sell when they are expensive. I call this the GRAB (GRab A Bargain) system. I know that markets do have trends, and I don’t want to fight them. So I include the discipline of only trading in the direction of the prevailing major trend, i.e., when the major trend is up the system trades from the long side only, buying on short-term weakness and exiting on strength; when the major trend is down it trades from the short side only, selling on short-term rallies and covering on weakness. I figure I now have the key to successful trading, so I set about building the system—feeling a rosy glow as I imagine how I am going to spend the inevitable profits. This system should pick up the bargains with regularity, then sell, just as the trend followers are getting in. The inevitable whipsaws, which normally cause me pain, are no longer a problem; rather they are a source of profit. The GRAB system is complete; to run, it requires two values (parameters), which are simply the number of days the system looks back to determine support and resistance levels (see “GRAB Trading System Details”). I set about optimizing these parameters. With experimentation I find values that allow the system to pick off the highs and lows just as I wish. FIGURE 25.2 E-Mini S&P 500 (Back-Adjusted) This looks great. Now the GRAB system is ready for back-testing. I am eager to see just how well this system performs. I select a diversified portfolio of 40 futures markets and 30 years of price history. I run the computer test and wait impatiently for the results. When I run the system, in addition to finding it buys dips and sells rallies as I expect, I notice something else that makes my blood freeze. Despite the “Pro” trading strategy, this system does not make money, it loses money. FIGURE 25.3 GRAB System; Parameter Values 40, 80 I am flabbergasted! Far from being the money machine I imagine, this system looks like a path to the poor house. To confirm the initial findings I run many more tests. The results are conclusive: The GRAB system is a loser. I do not understand this mystery: How can something that looks so good lose money? Clearly the GRAB system is not always picking off the highs and lows as I hope. As I investigate further, I see that the system behavior is highly dependent on the fit between the parameter values and the price action. If the parameters are even slightly out of sync with the price action, the system no longer works as I want. It either enters too early or not at all. When it enters too early the position loses as it rides the reaction down, often exiting just before the bottom and completely missing the subsequent move up. Often this happens several times in succession, in a similar fashion to a trend following system suffering a series of whipsaw losses. FIGURE 25.4 GRAB System; Parameter Values 40, 80 Soybean Oil (Back-Adjusted) “L”: Long Trades, “S”: Short Trades However, it is the case of the system not entering at all that really degrades the performance. The GRAB system relies on reactions against the trend to enter a move. However, the strongest trends often have the smallest reactions;
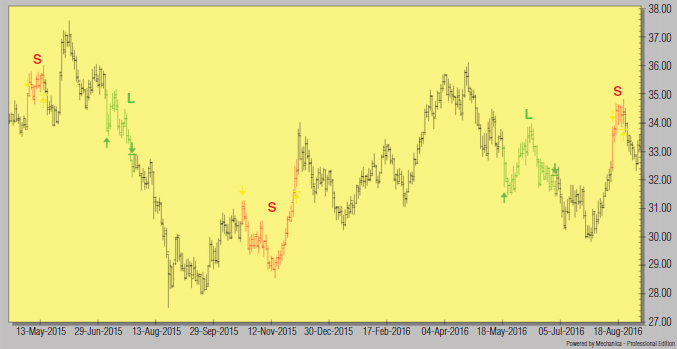
if these reactions are too small the GRAB system is not able to enter. Even if it does manage to enter the move once or twice, it quickly exits again on strength. Therefore, the GRAB system requires a series of substantial reactions to have any chance of catching a significant portion of a large move. The strongest moves often do not have deep enough reactions to allow this system to get on board, leaving it in the dust as the price rockets skywards. Note how, during the massive 2014 rally in bond prices, the GRAB system completely misses the move up in Euro German Bund prices. The enormous profits it misses out on in this case, and many others like it, wreck the system performance. FIGURE 25.5 GRAB System; Parameter Values 40, 80 Euro German Bund
(Back-Adjusted) “L”: Long Trades, “S”: Short Trades The GRAB system only works well during the rare times that its parameters are in sync with the market action. The rest of the time it either mistimes the reactions or fails to get aboard the large moves—missing out on huge profits as it sits on the sidelines. These results shatter my day-dreams of systematically picking up bargains in the futures markets. The strategy of buying cheap and selling when prices look expensive feels good to me and, I expect, to many other people. But when I test it on computer it is clearly a loser. In contrast, I often feel uncomfortable operating my trend following system, with its strategy of buying at highs and selling at lows. But, the big difference is that it is generally profitable. It appears that in futures trading (like other endeavors), profits do not come easily, because they require the trader to absolutely stick to a system that is sometimes very difficult to follow. The objective of this system is to buy weakness and sell strength, while using the discipline of always trading in the same direction as the major trend. The GRAB system uses a two-box look-back strategy. Support and resistance are defined as the lowest low and the highest high for the past N days, for both a near-box and a far-box, given that N(near) < N(far). When the price trades above far-box resistance it defines the major trend as up. The major trend remains up until the price trades below far-box support, which defines the major trend as down. When the major trend is up the system trades from the long side only; when the major trend is down it trades from the short side only. Thus far the system is similar to a support/resistance trend following system. The difference is that, within a major uptrend, GRAB buys weakness and sells strength (in a downtrend the procedure reverses). When the major trend is up, the system buys (during a reaction) on a break of near-box support, and sells (during a rally) on a break of near-box resistance, using limit orders. It keeps doing this until, rather than rallying to near-box resistance, prices break below far-box support, at which point the major trend definition changes to down and the position exits (on a stop). The system is then ready to trade short, by selling on a break of near-box resistance. See “GRAB Trading System Code” for the code behind the GRAB system. FIGURE 25.6 Near-Box Look-Back: 20 Days. Far-Box Look-Back: 100 Days, Corn (Back-Adjusted) “L”: Long Trades, “S”: Short Trades, “NBR”: Near Box Resistance, “NBS”: Near Box Support, “FBS”: Far Box Support The GRAB system is inherently different to standard trend following systems, which buy strength and sell weakness. At first glance I think it should generate a number of small profits from trading within the trend, followed by a larger loss as the trend reverses. This likely has the effect of increasing the Win/Loss rate over that of a trend following system, while reducing the Average Win/Average Loss ratio. I also believe the slippage costs should be smaller, as a result of much of the trading executing via limit orders, rather than the stop orders trend following systems use. In back-testing I find some things I do not expect (the following assumes the trend is up): The distance between the parameters defines the character of the GRAB system. When the parameters are far apart, only a small reaction against the major trend breaks near-box support, and triggers an entry. Similarly, only a small profitable move breaks near-box resistance, and triggers the exit. Conversely, the system requires a large losing move to break far-box support and signal a major trend change from up to down. This produces frequent trading, with many small wins and a few large losses. This may appeal to a trader’s desire to be “right.” FIGURE 25.7 Parameters Far Apart: Near-Box Look-Back: 20 Days. Far-Box Look-Back: 200 Days, New York Coffee (Back-Adjusted) “L”: Long Trades, “S”: Short Trades, “NBR”: Near Box Resistance, “NBS”: Near Box Support, “FBS”: Far Box Support When the parameters are close together, the GRAB system requires a large reaction against the major trend to enter a position, hence trading is less frequent. Once in a position the system requires a large profitable move to reach near-box resistance, and trigger an exit. Conversely, it requires only a small losing move to break far-box support and trigger a trend-change exit. This configuration skips many of the trend-change trades as in (1) above. This produces infrequent trading, with few winners. However the trades that do win enter very near the bottom of the reaction and exit near the top of the ensuing move. This may appeal to a trader’s desire to be “smart.” FIGURE 25.8 Parameters Close Together: Near-Box Look-Back: 110 Days. Far-Box Look-Back: 140 Days Natural Gas (Back-Adjusted) “L”: Long Trades, “S”: Short Trades, “NBR”: Near Box Resistance, “NBS”: Near Box Support, “FBS”: Far Box Support The following is the code for the grab system in a semi-English format. An apostrophe at the beginning of a line denotes a comment.Introduction
How to GRAB a Bargain Trading Futures
Following Trends Is Hard Work

Figuring Out How the Pros Do It
A Computer Model of the Pros

A Terrible Discovery

Solving the Mystery—Why Does the GRAB System Lose?
Often It Is Out of Sync with the Market
Worse Still, It Misses the Best Moves!

Maybe Being Profitable Means Being Uncomfortable?
GRAB Trading System Details
Buys on Break of Support, Sells on Break of Resistance

Testing Reveals Some Behavior I Do Not Expect
Difference between Parameter Values Defines
Character of GRAB System


GRAB Trading System Code
Indicator Setup
'GRAB System.
'Two-box system. Far box defines major trend; system trades only in same direction as major trend,
'meanwhile fading the signals of near box.
'Last trade in each trend exits at break of far box - at the same time as the trend reverses.
'All trades, except the last in the trend, use a limit order, as they are fading the near box.
'The last trade exits on a stop, as the trend changes.
'Assign entry and exit break out parameters using integers "X" and "Y".
'Set X = Far box lookback
X = 80
'Set Y = Near box lookback
Y = 40
'Create the far and near box support/resist levels.
FAR_BOX_RESISTANCE = MAX[H,X,0]
FAR_BOX_SUPPORT = MIN[L,X,0]
NEAR_BOX_RESISTANCE = MAX[H,Y,0]
NEAR_BOX_SUPPORT = MIN[L,Y,0]
'Initialize long term trend value to 0 so that it does not set until indicators up to speed.
'See if high TODAY breaks yesterday&'s look back high, or if low breaks yesterday&'s look back low.
IF FAR_BOX_RESISTANCE = 0 THEN
TREND = 0
ELSE IF HIGH >= FAR_BOX_RESISTANCE[1] THEN
TREND = 1
ELSE IF LOW <= FAR_BOX_SUPPORT[1] THEN
TREND = -1
ELSE
TREND = TREND[1]
Position Entry
'If the trend is up buy on a break of near box support.
IF TREND[1] = 1 THEN BUYLIMIT = NEAR_BOX_SUPPORT[1]
'If the trend is down sell on a break of near box resistance.
IF TREND[1] = -1 THEN SELLIMIT = NEAR_BOX_RESISTANCE[1]
Position Exit
IF LONG = 0 THEN JUMPTO[1]
'If long either, sell (at a limit) on a break up from the near box or, sell (on a stop) on a break down ‘from the far box - a change in trend from up to down.
SELLIMIT = NEAR_BOX_RESISTANCE[1]
SELLSTOP = FAR_BOX_SUPPORT[1]
JUMPTO[2]
[1]
' Vice-versa if short.
BUYLIMIT = NEAR_BOX_SUPPORT[1]
BUYSTOP = FAR_BOX_RESISTANCE[1]
[2]
Position Sizing
'Use Fixed Fractional Position sizing. Positions size inversely to the risk they present at entry.
'Set the risk budget.
RISK_BUDGET = .01
STARTDATE = 19860101
ENDATE = 20161010
STARTUPCASH = 1000000
NEWCONTRACTS = TOTALEQUITY * RISK_BUDGET / NEWRISK
Note