
Chapter 8
Pricing Strategy Implementation
Embedding Strategic Pricing in the Organization
Few challenges cause more anxiety for senior executives than the implementation of pricing strategies. Even after investing the time and energy to develop a comprehensive plan addressing price structure, segmentation, value communication, policies and price levels, those leaders often find that much of their organization can be remarkably resistant to changing their behaviors. As one senior executive, we know, remarked: “Given the attention we pour into pricing our products, why do the outcomes seem like a random walk?” This executive is not alone. Our research shows that more than 60 percent of sales and marketing managers are frustrated by their organization’s ability to improve pricing performance over time. And more than 75 percent were unsure what they should be doing to drive more effective execution of the organization’s pricing strategy.
Given such a seemingly straightforward task, why do so many organizations struggle to implement and maintain pricing strategies? Although there are many answers to this question, several factors account for the majority of the challenge. First, the inherently cross-functional nature of pricing provides many opportunities for the strategy to “come off the tracks” because there is often no clear ownership of, and responsibility for, pricing outcomes. Even when a company has a pricing function formally tasked with setting and managing prices, final decisions are often made by product managers, salespeople, or senior management negotiating with aggressive channel partners and customers. Even with years of experience, these managers often struggle to defend price points when negotiating with professional procurement organizations or when facing a competitive price cut.
A second reason that pricing strategies fail is that conflicted motivations of decision-makers translate into inconsistently applied pricing policies. Compensation plans that reward managers on revenues alone encourage ad hoc discounting and reactive pricing. Even well-intentioned sales representatives find it difficult to fight for an additional percentage point of price when that might increase the probability of losing a deal and the associated compensation. Marketers are often incented on maintaining or growing market share, which can often be accomplished most quickly through price promotions. Finance executives are often evaluated on achieving a target margin percentage, which leads them to argue against low-margin/high-volume opportunities that could increase return on investment even at the expense of return on sales. Operations executives often focus on maintaining capacity utilization even when that drives down market prices and reduces profits for all. In our experience, allowing pricing to be run by managers with conflicted incentives such as these is one of the most common reasons that pricing strategies are inconsistently implemented.
Another reason for inconsistent application of pricing strategies is that managers often do not have the necessary information and tools to make profitable pricing decisions. The advent of enterprise-wide data systems has led to an explosion of pricing data that overwhelms many managers. Often the problem is not how to get the right data, but how to translate that data into actionable information through the use of appropriate analytics. The list of possible analytics that could be used in support of pricing strategy development is much greater than the small number needed to answer any particular question. The challenge is to understand which ones are most helpful and how to get them into the hands of the appropriate decision makers. This data challenge is one of the primary drivers behind the increasingly rapid adoption of price management systems from companies such as Vendavo and Zilliant, among others. These systems can be instrumental in analyzing pricing data to deliver managerial insights across large organizations. It is not necessary for every company to have a computerized price management system to support the pricing strategy. What is necessary, however, is that managers have the right data and tools in hand to make more consistent and more profitable pricing decisions.
These common problems with incentives and information provide a good starting point for understanding what is needed to make pricing strategies stick. Implementing pricing strategy decisions requires properly addressing organizational issues related to how decisions are made and enforced as well as motivational issues that encourage managers to engage in more profitable behaviors (see Exhibit 8-1).
Organization covers the entire structure of the pricing function. It includes ownership of the decisions and the process by which those decisions are made and implemented. Motivation involves using principles, data, and analytics and performance metrics and incentives that encourage the right behaviors by both the organization and the individual. Even the best organizational structure will not lead to higher profits unless managers are motivated to change old ways in favor of more profitable behaviors. Strategic pricing requires marketing to shift from promoting features to understanding value and building price and offering structures. It requires salespeople to shift from negotiating price to selling value. It also requires operations to shift from improving the efficiency of current service operations, to designing a service organization that delivers differential value to customers. These are major changes to long-held ways of working that can be understandably uncomfortable. It is essential, therefore, to provide meaningful reasons and incentives for managers to participate actively in the new pricing processes.

EXHIBIT 8-1 The Foundation for Pricing Strategy Implementation
Effectively addressing these key elements of implementation, represented by the lower sections of the triangle in Exhibit 8-1, will go a long way toward embedding the pricing strategy within the organization. The top part of the triangle in Exhibit 8-1 represents the elements of pricing strategy that have been detailed in the previous chapters. Combining the management actions outlined in this chapter with an understanding of the opportunities and constraints presented by the company’s cost structure, its market competition, and the legal and ethical context in which it operates can lead to a pricing strategy and supporting activities that ensure consistent implementation and profitable results.
Organization
The organization of the pricing function has a major impact on the quality of pricing decisions as illustrated by a chemical company we know that struggled for years to maintain price levels even in periods of limited supply. Historically, the company’s management team had used price to maximize capacity utilization, which led them to over extend their product portfolio as they continually launched products to fill ever-smaller market niches. After years of subpar results, the company dropped their volume-driven strategy in favor of a value-based approach intended to improve margins while maintaining sufficient volumes to keep costs in line. The management team wisely recognized that the current organization would struggle with the transition to a new strategy because it involved new choices that would be difficult for many to make. So they decided to reorganize the pricing function to better support the new strategy.
The first step was the creation of small pricing committees within each business unit that were tasked with managing pricing policies and execution. Historically, major pricing decisions were managed centrally from corporate headquarters. The management team realized that each business unit operated in unique markets requiring distinct pricing policies and a decentralized decision-making approach. Endowing the business unit pricing committees with decision rights and holding them accountable for profit improved outcomes substantially as a result of market specific pricing policies and choices. The second step was to form a corporate-supported pricing council composed of representatives from the pricing committees at the business units. The council, which met on a quarterly basis, did not have a formal role in decision-making. Instead, its role was to act as a vehicle for sharing best practices and providing support to the pricing committees as they built credibility and influence. The end result of the new pricing strategy and organizational structure was an impressive $250 million profit improvement beyond the projected baseline.
Organizational Structure
Designing an organizational structure for the pricing function involves establishing formal reporting relationships for the managers responsible for managing the pricing process. It is important to recognize that no single organizational design will work for every company and market situation. The key is to ensure that structural choices are aligned with the strategic goals and activities of the business. What is the right role for a pricing function? While the specific answer will differ depending on the market context, we have identified four alternative roles for the pricing group (Exhibit 8-2) reflecting different levels of ownership of pricing decisions and processes.
The expert resource role can be effective with a centralized pricing function supporting multiple divisions where each unit operates in distinct markets. The expert resource role is especially helpful when the business units work with similar types of data yet operate in different market contexts where they face different competitors, incur different costs, or are constrained by significantly different laws. It is often adopted in fast-moving consumer markets in which large transaction data sets that require sophisticated analytics are the norm. The expert resource role is also common in business markets ranging from chemicals to manufacturing in which the capability to estimate customer value is important. In these instances, the pricing function often serves merely as an internal consulting resource supporting the divisions with specialized skills such as data analysis, project management, and building a business case for change.

EXHIBIT 8-2 Archetypal Roles for Pricing Function
The role of the pricing function begins to shift when it is asked to take control of the pricing processes and play a role that is more of a functional coordinator. Pricing in this environment may be viewed more tactically with greater emphasis placed on how the decisions are made than on what the decisions are. We have found that sales-driven organizations in areas such as technology and medical devices often ask pricing to take on this type of functional coordinator role while leaving decision rights with the senior marketing and sales executives.
The pricing function assumes a commercial partner role when it is given authority over both pricing decisions and processes. This role is relatively common in capital goods markets where price levels are highly visible and the products have complex value propositions, as well as heavily regulated markets such as pharmaceuticals. Even in these markets, it is rare that the pricing function owns all of the pricing decision rights, however. Instead, it usually works in partnership with other commercial leaders to establish and enforce price points.
The final role for the pricing function, the figurehead, occurs when the pricing organization owns the right to make key decisions, but does not have the power to enforce those decisions in the market place. Few companies would intentionally design their pricing organization in this way because it virtually ensures that pricing policies will have little credibility and be weakly enforced, if at all. Nevertheless, this type of role for pricing is all too common because it enables other functional areas to control pricing without having formal authority. This type of role for pricing often leads to the increased politicization of pricing and is not a construct that we would advocate.

Exhibit 8-3 Pricing Structure Archetypes
Another important factor to consider when designing a pricing function is the degree of centralization. More centralized pricing can be effective when a company operates within a single market or has business units operating in similar market contexts. Centralized pricing in these contexts enables the company to invest in developing a core of expertise that can be leveraged across markets. The benefits of a centralized pricing function diminish, however, when business units are operating in different markets. In those instances, it may be more productive to push decision-making out to the business units while maintaining coordination and support mechanisms more centrally.
These two dimensions of a pricing function, the role and degree of centralization, provide the underpinnings for three archetypal organizational structures for the pricing function (Exhibit 8-3). The actual choice of an organizational design may involve some combination of these archetypes because each potential choice involves trade-offs that can enhance or detract from the ability to execute the pricing strategy. Nevertheless, we have found these archetypal structures prevalent across markets.
The first archetype is the “Center of Scale” in which pricing decisions are made and managed at the corporate level. In these organizations, the role of the business unit is to collect data and enforce process compliance in support of the pricing decisions made at the corporate office. Centers of Scale-type pricing functions often assume the role of commercial partner or expert resource and are more prevalent in mature consumer markets such as automobiles and packaged goods, where maintaining consistent market prices is crucial. It only takes one adventurous product or sales manager to start a price war! One approach to preventing such an unfortunate event is to maintain pricing decisions more centrally.
The second functional archetype is the “Center of Expertise,” which is characterized by the business units maintaining control of the pricing decisions and pricing processes. In this structure, the pricing function provides a vehicle for sharing best practices and supports the development of more effective pricing strategies. The central group will often have specialized skills such as the ability to perform advanced analytics or manage projects that would not be cost effective to distribute to individual business units. Often the group assumes the role of functional coordinator. As noted previously, this team will often serve as an internal consulting function focused specifically on pricing that improves pricing outcomes through knowledge transfer. Markets with unique local conditions such as retail and telecommunications will often have functional coordinators that assist local area managers in decision-making.
The final functional archetype is the “Dedicated Support Unit” in which each business unit has a dedicated pricing group that is only loosely aligned with corporate pricing (if that function even exists). The role is typically either a functional coordinator or commercial partner. This type of structure is appropriate for diversified businesses with little overlap in market type and can be found in an array of industries, including basic materials and information technology.
There are other factors beyond centralization and mission that contribute to the choice of organizational structure for the pricing function. For example, culture is often an important consideration as illustrated by a large bank we worked with in South America. The bank, like many South American businesses, had a relationship-oriented culture that held discussion and consensus in decision-making as a core value. The company operated in similar markets across the continent, which would have suggested a more centralized structure to the pricing function. But a centralized pricing organization would not have worked for this company because it would have inhibited consensus building at the level of the business units and branches. In contrast, the decision-making culture at a company such as Microsoft is very data driven and benefits from a more centralized organization with the people and skills to perform sophisticated analyses to support strategy recommendations. The key in organizational design, then, is to understand potential trade-offs and make a thoughtful choice for an organizational structure.
Decision Rights
Formal structure is not the only consideration when organizing for a pricing; it is also necessary to allocate decision rights to managers both within and outside of the pricing function that will participate in the pricing process. Allocating decision rights ensures that each participant understands their role and the constraints on what they can and cannot do with respect to pricing. Failure to formally allocate pricing decision rights leads to more inconsistent pricing and greater conflict as managers attempt to influence pricing decisions. A business services company unwittingly ran into this problem when they created a Key Account team and gave them the right to make “strategic” discount decisions directly with the company’s largest customers. Unfortunately, the traditional sales force never had their own decision rights for pricing adjustments reduced and continued to provide their own price quotes to these same customers. Large accounts started to receive multiple prices for purchase and began to actively solicit additional quotes in hopes of getting a better deal. Although large accounts grew considerably under the key account program, average selling prices declined rapidly, along with profitability.

Exhibit 8-4 Types of Decision Rights
Decision rights, as the name implies, define the scope and role of each person’s participation in the decision-making process as illustrated in Exhibit 8-4. There are four types of decision rights. Given the large amount of data required to make pricing decisions, many managers are given “input” rights to pricing decisions. As the name implies, input rights enable an individual to provide information before the decision is made. Typically, input rights are granted to individuals from finance, forecasting, and research that provide critical data but are not responsible for commercial outcomes. In contrast to “input” rights, which can be allocated to many individuals, the “make” decision rights should belong to only one person or committee. This ensures clear accountability for pricing decisions and creates an incentive to follow up on pricing choices to ensure that they are implemented correctly.
Ratification rights provide a mechanism for senior managers to overturn pricing decisions when they conflict with broader organizational priorities. It is essential to separate “make” and “ratify” rights to ensure that senior managers can make a productive contribution to the decision-making process. Granting ratification rights to a senior manager balances the need to incorporate her strategic perspective into the decision-making process against protecting her time and ensuring that she does not get bogged down in day-to-day pricing operations. Finally, “notification” rights should be allocated to individuals that will use or be affected by the pricing decisions in other decision-making processes. For example, it is quite common to grant notification rights for pricing decisions to members of the product development team so that they can build more robust business cases for new products and services.
Pricing Processes
Once the organization structure has been established and decision rights have been defined, the final step for organizing the pricing function involves the creation of a clearly defined set of pricing processes. In many organizations, pricing processes are defined quite narrowly, including only price-setting and discount approval activities. But strategic pricing spans all of the activities that contribute to more profitable commercial outcomes. For example, the negotiation process might not be considered part of the “pricing” function, but it is one of the most critical determinants of transaction profitability. Excluding negotiations from the pricing process would leave an unmanaged gap or profit leak. Therefore, it is essential to think broadly when defining pricing processes.
How does one know when current pricing processes are not working effectively? There are a number of indicators of ineffective pricing processes:
- Frequent deviations from agreed price schedules and unclear pricing authority
- Frequent non-standard customer requests
- A large number of uncollected charges and an increased number of write-offs
- Excessive unearned discounts and waived up-charges
- Increased pricing errors
- Increased order processing and fulfillment errors
Correcting these problems can improve profits substantially, making the investment to define new pricing processes a good one. Thankfully, the steps to address these issues are fairly straightforward:
| Step 1 | Define Major Pricing Activities This step involves the definition of the major process activities such as opportunity assessment, price setting, negotiation, and contracting. The objective is to put boundaries around the commercial system so that all relevant activities affecting profitability are included. |
| Step 2 | Map Current Processes This step creates a visual depiction of the processes by which pricing decisions are currently made, as illustrated in Exhibit 8-5. Even if there are no formally defined processes currently in place, this is a critical step for finding the source of undesirable pricing outcomes. |
| Step 3 | Identify Profit Leaks This step uses a variety of pricing analytics (discussed in the next section) to identify where profit leaks are occurring in the current pricing process. |
| Step 4 | Redesign Process This final step creates a series of redesigned pricing processes for each of the major pricing activities identified in step one. In order to implement the new processes, it is frequently necessary to revise decision rights to account for new individuals included in the revised process and to account for current decision-makers from whom decision rights have been taken away. |
Motivation
Establishing clearly defined processes and decision rights ensures that pricing strategy choices will be made in a consistent and repeatable manner. But to ensure that those decisions will also maximize profits, they must be based on accurate, useful information and individuals must be motivated to act

Exhibit 8-5 Map of Decision-Making Process for a Manufacturing Company
appropriately based on it. All too often, critical pricing choices are based on anecdotal data that provide a limited, and often incorrect, understanding of market conditions. Or the reverse, when even the best analysis and decisions are undermined by poorly constructed organization and incentives.
The need for effective information became apparent to a consumer packaged goods company we know that gave increasing authority to its divisions while incenting them to improve average selling price. Through a combination of price increases and bundled offerings, the regional managers were able to increase margin percentages and hit their targets. In the process, however, they also lost sufficient volume that total profits began to fall. Unfortunately, the management team failed to recognize the profit impact of their decisions because they lacked an effective measurement system to track prices and total contribution. It wasn’t until the company missed its income targets for several quarters, causing the stock price to drop, that the management team became motivated to collect data necessary to identify the problem. It then took a significant promotional campaign and targeted rebating to get the company back to their original levels of price and profit performance.
The array of analytics that can inform pricing decisions is practically endless, covering data about product costs, cost-to-serve, purchase trends, customer value, transaction prices, and more. It is beyond the scope of this text to detail all of these analytics and demonstrate how they can best be used to improve strategy choices. Therefore, we focus on two categories that have historically proved most useful to pricing strategists: customer analytics and process analytics. In addition, we will review analytics that gage the efficacy of the pricing decision processes we described in the discussion of the pricing function earlier in this chapter.
Customer analytics focus on understanding customer motivations and behaviors that are relevant to pricing choices. We have already examined one of these analyses with the discussion of value assessment in Chapter 2. We will now focus on two additional analytics that have proven helpful in pricing strategy development: purchase trend analysis and customer profitability.
Customer Analytics
One of the biggest challenges facing pricing strategists is to spot changes in customer or competitor behaviors in time to develop an effective response. For example, it can be quite difficult to know when a competitor has cut prices in an attempt to gain market share, because those cuts are not always announced or otherwise made visible. Typically, information regarding a competitor’s price changes trickles in from customers, salespeople, and distribution partners over a period of months. By the time the noise has been filtered from the data, the damage has been done and the competitor has gained an advantage.
PERFORMANCE TREND ANALYSIS It is essential to monitor trends in market data in order to spot threats to profitability and opportunities for improved pricing. But which data should be collected? Competitive pricing data can be difficult to obtain and does not necessarily provide the most comprehensive view of market dynamics. An alternative is to track customer price and purchase volumes over time, as illustrated in Exhibit 8-6. This simple customer performance trend analysis is done at the customer level for either specific products or across product portfolios. The power of the analysis is that it suggests specific recommendations for addressing the potential problems and opportunities revealed in the purchase trends. For example, customers in the upper left-hand quadrant have seen their prices erode at a slower rate or increase, while volumes decreased. Customers with the biggest decrease in sales volume are thus demonstrating that they are price sensitive and might respond favorably to targeted discounts.
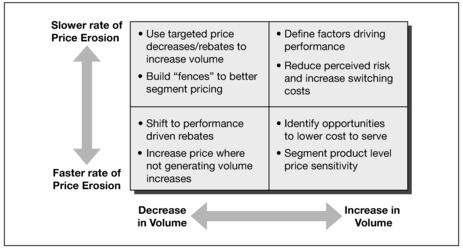
Exhibit 8-6 Performance Trend Analysis
In contrast, customers in the lower left-hand quadrant have received lower prices while also decreasing their volumes. There could be several reasons for this purchase pattern such as the entrant of a low-price competitor, a change in the customers’ own markets, or that these customers have especially aggressive procurement groups that have managed to cut better deals than other customers. Regardless of the root cause, the purchase trend analysis helps pinpoint problematic customers so that the specific problem can be identified and effective remedies can be devised.
CUSTOMER PROFITABILITY Historically, marketers have long tracked product profitability as a key metric for managing the product portfolio and allocating marketing resources. In recent years, however, customer profitability has emerged as another metric that is instrumental to marketers seeking to improve profitability. Customer profitability measures are created by assessing average prices paid by specific customers and combining them with cost-to-serve measures allocated at the customer level. Creating customer profitability measures often requires some effort, because most accounting systems do not allocate costs at the customer level. But the benefits are generally worth the effort because customer profitability analysis provides actionable guidance to improve the profitability of the customer portfolio.

EXHIBIT 8-7 Customer Profitability Map
The data in Exhibit 8-7, drawn from a financial services firm, shows one approach for analyzing customer profitability that charts each customer based on average selling price and cost-to-serve. There are opportunities for profit improvement in each quadrant, and the fact that customers are charted individually allows for highly targeted actions. The “Platinum” customers located in the upper left-hand quadrant new to be protected. They are sometimes taken for granted because pay high prices and do not incur a lot of costs. However, it is essential to understand why these customers are paying a premium and to ensure they are getting good value for that price. Otherwise, they may be lost when competitors discover them and offer a better deal. In contrast, the “Lead” customers in the lower right quadrant merit a different course of action. The most egregious of these “outlaws” (circled in Exhibit 8-7, in the lower right quadrant) must be made profitable by either reducing cost-to-serve or raising prices. Raising prices on the unprofitable customers in this quadrant can result in two outcomes; the customer pays the higher price because of the value delivered, or they defect and move to a competitor. This is a low-risk move for the company because it will increase average profitability, and, often, total profitability, regardless of the outcome.
Assessing customer profitability provides high-level guidance for pricing or cost-reduction moves that can improve company profits. Additional profit improvement opportunities can be uncovered by a more detailed individual customer profitability assessment, as illustrated in Exhibit 8-8. This analysis, which details the specific sources of revenue and cost, allows for the comparison of individual customers to segment averages to identify outliers that are consuming too many resources or not generating sufficient revenues. This individual customer profitability analysis, from the same financial services firm, was instrumental in helping management take corrective actions such as increased use of automation and the bulking of claims that helped reduce direct labor costs and processing costs and drove a 37 percent improvement in profitability.

EXHIBIT 8-8 Individual Customer Profitability
Process Management Analytics
The renowned physicist, Lord Kelvin, once noted that “if you can not measure it, you can not improve it.” This quote captures the intent behind process management analytics: to measure unsatisfactory pricing outcomes (such as profit leaks) and trace them back to the pricing process, where they can be “sealed.” Whereas customer analytics focus on strategy development, analytics reviewing the process efficacy can identify “profit leaks” in the pricing process caused by unwarranted or unmanaged discounts. Process analytics are generally performed on transaction data containing individual records of each transaction’s products, volume, prices, and discounts. The goal is to identify types of customers or transactions that are getting excessive discounts and then to trace the source of those discounts back to the pricing process in order to “seal” the profit leak by changing decision rights, developing new policies, or simply ensuring that mangers have the right data to make effective decisions. The source of the problem may range from a salesperson granting unwarranted discounts to a pricing policy that is not aligned with market conditions. The process compliance analytics we discuss below, price bands and price waterfalls, will not necessarily reveal what the corrective action for a bad outcome should be. The analytics will, however, help to pinpoint where the problem occurs, which is a useful first step toward correcting it.
PRICE BANDS Price banding is a statistical technique for identifying which customers are paying significantly more or significantly less than the band of “peer” prices for a given type of transaction. This identifies customers whose aggressive tactics enable them to earn unmerited discounts and customers who are paying more than average because they have not pushed hard enough for appropriate discounts. Exhibit 8-9 graphs the inconsistent, apparently random pattern of pricing that we often encounter at companies with flawed policies. However, the sales force or sales management team responsible might argue that there is a hidden logic to it—a method to the madness. To the extent that they are right, and sometimes they are, the pricing manager’s job is to make that logic transparent to himself and the pricing steering committee. To the extent that the variation is truly random, and therefore, damaging the firm’s profit and price integrity, the pricing committee’s job is to create policies to eliminate it.

EXHIBIT 8-9 Price Brand Analysis
There are five steps to a price band analysis:
- Identify the legitimate factors (service levels, size of orders, geographic region, customer’s business type, and so forth) that justify price variations across accounts based on value.
- Perform a regression of price levels or discount percentages against measures of those legitimate variations:
- Percent discount = f (volume, services, region, etc.) + ε
- For each observation (an actual customer account or order), use the regression equation to estimate the price or discount that this customer would have gotten if given the average discount offered by all sales reps for each of the legitimate discount factors relevant to that customer. This is the “fitted value” of the regression. Label these the “peer prices,” which are defined as the average price for transactions or customers with the same characteristics.
- Plot the actual prices customers pay and compare them to the peer prices along the regression line; examine the positive and negative differences, as illustrated in Exhibit 8-9. Plot a line one standard deviation above and one standard deviation below the “peer price” line to reveal the outliers. To the extent that price variation is caused by legitimate factors, the variables in the regression will “explain” the actual price distribution well, the R2 (called the coefficient of determination) will be high (between .8 and 1.0) and the band will be narrow. To the extent that discounting is random, or occurs for reasons that no one is willing to propose as legitimate, the R2 will be low (below .4) and the band around the fair price line will be wide.
Once the analysis is completed, the next step is to brainstorm possible causes of the random variation and identify correlations to test those hypotheses. For example, do a minority of sales reps account for most of the negative variation while a different group accounts for the positive? Is the negative-variation minority composed of the newest reps while the group accounting for the positive differences is more experienced? If so, the solution may be to document what the savvy reps know about selling value and sharing that information with the low performing group. Other explanations for the random variation could relate to the customer’s buying process (is it centralized?), indicating a need for different policies. In one case, the analysis revealed a pattern that was ultimately traced to one sales rep in a particularly corrupt market who was taking bribes for price concessions.
PRICE WATERFALLS In some companies, the possible sources of lost revenue and profit are many and poorly tracked. In a classic and oft-quoted article, two McKinsey consultants used waterfall analysis to show how simply managing the plethora of discounts can improve company profitability.1 Exhibit 8-10 illustrates this price waterfall analysis. Although the company might estimate account profitability by the invoice price, there are often many other sources

EXHIBIT 8-10 Price Waterfall Analysis
of profit leakage along the way. The “pocket price,” revenue that is actually earned after all the discounts are netted out, is often much less. More important, the amount of leakage could range from very small to absurdly high. In one case, a company that analyzed its pocket prices discovered that sales to some of its customers resulted in more leakages than the gross margin at list price! In addition to the salesperson’s commission, there was a volume incentive for the retailer, a commission for the buying group to which the retailer belonged, a co-op advertising incentive, an incentive discount for the distributor to hold inventories, an early payment discount for the distributor, a coupon for the end customer, and various fees for processing the coupons.
Agreements to let the customer pay later, to let the customer place smaller orders, to give the customer an extra service at no cost, and so on all add up. The result can become a much wider variance in pocket prices than in invoice prices. Because companies often monitor such concessions less closely than explicit price discounts, these giveaways tend to grow. This does not mean that such discounts should be stopped; they often provide valuable incentives and can be effective in hiding discounts while still maintaining the important appearance of price integrity. The danger is simply in letting them go unmanaged, without applying rigid policies on their use. For example, after discovering that sales reps waived shipping charges for customers much more often than necessary, a large distributor imposed policies to require more documentation before such orders were processed. That simple policy change resulted in tens of millions more dollars to the bottom line.
Performance Measures and Incentives
Few things have the ability to motivate individual behaviors more than performance measures tied to compensation and incentives. Yet, many companies struggle to obtain the desired results from their compensation programs as evidenced by the more than 58 percent of managers in our research who indicated that their incentive plans encourage choices that reduce company profits. This data raises the question of why it is so difficult to design effective incentive programs. The first, and often most challenging barrier, involves ensuring that performance measures motivate the right behaviors. Employees enagage in complex activities every day, and companies often get caught in the trap of trying to design metrics and incentives to guide all of them. But the inclusion of too many metrics becomes confusing for the employee and leads to a loss of focus and an increase in frustration as well-intentioned employees struggle to figure out the right thing to do.
Instead of trying to create an overly complicated set of performance metrics, companies should settle on a limited set of metrics that are tied closely to profitability and then hold people accountable for their performance against those measures. Consider the dilemma facing sales representatives, independent dealers, and manufacturers’ representatives who are compensated based on a percentage of sales. Say that the company’s margin is 10 percent on high-volume deals. A sales rep who invests twice as much time with the account, selling value and/or getting the customer to change behaviors that drive up costs, might at best be able to increase the profit earned on the deal by an additional 10 percent of sales—doubling the profitability. Even if all that increase is in price, however, the sales rep’s revenue-based commission increases by only 10 percent at most. In contrast, instead of trying to sell value, one of her colleagues spends the same amount of time selling a second deal of equal size with only a 10 percent margin. As a result, the colleague’s effort increases the company’s profit contribution by the same amount, but he earns twice as much commission for doing so. Even if the colleague has to cut the price by 5 percent to win the deal, reducing the profit by half, he still gets a bigger commission while the sales rep who spent time selling value rather than volume hears about her failure to keep pace.
Until you fix these perverse incentives associated with revenue-based measurement and compensation—driving revenue at the expense of profit—it will be difficult to get sales reps to do the right thing. The key to aligning sales incentives with those of the company is to link compensation with profitability. Exhibit 8-11 explains how to do that using a contribution margin-based formula. More than just theory, paying for profitability provides mutually beneficial sales incentives. And it encourages salespeople to pay more attention to value drivers linked to innovative product features, quality improvements, and delivery speed. Once the company aligns sales incentives, salespeople will begin clamoring for the other things they need to succeed. At one company, for example, sales reps traded in their company sedans for vehicles in which they could transport product to new customers with an urgent need, because that would contribute to follow-on sales and higher commissions.
Another challenge to the design of an effective incentive plan is the lack of alignment among performance measures across the organization. Paying salespeople based on profitability will have little impact on company profits if others with pricing decision rights are measured on market share. For example, a high-tech manufacturer we worked with had given the finance group ratification rights for price-setting to ensure that prices were set with sufficient financial prudence. One financial policy that was strictly enforced was that all products must maintain a minimum 64 percent gross margin or be eliminated from the product portfolio. The financial staff, which was evaluated on the ability to maintain gross margins, routinely vetoed requests for any prices that fell below the 64 percent threshold regardless of the market conditions or the volume. Not surprisingly, the sales organization, whose commission was based on sales volume, had a very low regard for the business acumen of the financial staff that “just didn’t get it.” Moreover, the salespeople would spend hours each week devising creative ways to work around the financial staff to get approval for high-volume, lower-margin deals.
The first step toward gaining alignment of metrics and incentives across the organization is to document current objectives and incentives for all of those that have been granted decision rights in the pricing process. That documentation enables you to highlight potential conflicts that can detract from the effective decision making. Ideally, the next step will be to change the
Exhibit 8-11 Creating a Sales incentive to Drive Profit
The key to inducing the sales force to sell value is to measure their performance and compensate them not just for sales volume, but also for profit contribution. Although some companies have achieved this by adding Rube Goldberg—like complexity to their compensation scheme, there is a fairly simple, intuitive way to accomplish the same objective. Give sales people sales goals as before, but tell them that the sales goals are set at “target” prices. If they sell at prices below or above the “target,” the sales credit they earn will be adjusted by the profitability of the sale.
The key to determining the sales credit that someone would earn for making a sale is calculating the profitability factor for each class of product.To induce salespeople to maximize their contribution to the firm, actual sales revenue should be adjusted by that profitability factor (called the sales “kicker”) to determine the sales credit. Here is the formula:
Sales Credit [Target Price k(Target Price Actual Price)] Units Sold
where k is the profitability factor (or “kicker”).
The profitability factor should equal 1 divided by the product’s percentage contribution margin at the target price, in order to calculate sales credits varying proportionally to the product’s profitability. For example, when the contribution margin is 20 percent, the profitability factor equals 5 (1.0/0.20). When a salesperson grants a 15 percent price discount, the discount is multiplied by the profitability factor of 5, reducing the sales credit by 75 percent rather than by 15 percent had there been no profitability adjustment. Consequently, when $1,000 worth of product is sold for $850, it produces only $250 of sales credit. But when $500 worth of product is sold for $550 (a 10 percent price premium), the salesperson earns $750 of sales credit ($500 5 $50).
Because salespeople are more likely to take a short-term view of profitability and can always move on to another company, the most motivating profitability factor for the firm is usually higher than the minimum kicker value based solely on the contribution margin. Obviously, the importance of this adjustment is directly related to the variable contribution margin. The larger the margin and, presumably, the greater the product’s importance to the firm, the greater the profitability factor’s ability to align what’s good for the salesperson with what’s good for the company.
This is not merely theory. As companies have moved toward more negotiated pricing, many have adopted this scheme in markets as diverse as office equipment, market research services, and door-to-door sales. Although a small percentage of salespeople cannot make the transition to value selling and profit-based compensation, most embrace it with enthusiasm. Managers should be prepared for the consequences, however, because salespeople’s complaints about the company’s competitiveness do not subside. Instead, salespeople who previously fretted about the company’s high prices begin complaining about slow deliveries, quality defects, lack of innovative product features, the need for better sales support to demonstrate value, and so on. In short, sales force attention moves from reflexive gripes about price to legitimate concerns about value drivers the company does or does not provide to customers. This is a good thing.
incentive plan so that decision-makers will share common objectives as they make pricing choices. But changing incentives can be time consuming and can involve considerable upheaval in the organization and, thus, may not always be a desirable option. In those instances, it is necessary to create policies for how pricing decisions will be made and ensure that the policy compliance is tracked with various price management analytics.
Managing the Change Process
Organizational structure, decision rights, processes, and incentives are important levers that provide managers with the opportunity to make pricing choices in different and more profitable ways. Transforming an organization into one that ascribes to and executes on the principles of strategic pricing requires that managers act in ways that may run counter to their past experience and training. Some individuals may be resistant to change because they legitimately believe that the new approach is less effective, while others may be resistant because their compensation would be adversely affected under the new approach. Regardless of the reason, individuals must to be motivated to go through a potentially uncomfortable transition process before accepting a new pricing strategy.
There are a number of levers that can be used to facilitate adoption of the new approach including clear leadership from senior management and demonstrating successes through trial projects. Successful change efforts require an integrated and consistent use of these change levers to overcome organizational inertia and effect change.
Senior Management Leadership
One of the most important actions that leaders can take to encourage adoption of strategic pricing is to truly “talk the talk and walk the walk.” All too often, senior managers indicate strong support for a new pricing strategy and then revert to ad hoc discounts the first time a customer asks for a lower price. Not only must senior leaders avoid falling back on old pricing practices, they must actively seek high-profile opportunities to demonstrate support for the new strategy. A telecommunications company we worked with had invested heavily to develop a more strategic approach to pricing in its consumer markets. The implementation plan included extensive training for the sales team and conducting a couple of high-profile negotiations with the new approach to demonstrate its effectiveness. The company seemed to be on its way to making a successful transition when the COO, who had been a tireless advocate for the strategy, began to respond to pressure from the board to meet sales targets by offering “one-time” discounts to win business. As soon as the regional sales managers learned about these discounts, they demanded the right to negotiate similar discounts. It was not long before these pricing “exceptions” became the norm across the organization and the pricing strategy was abandoned. In this example, the COO missed a critical opportunity to send a clear message about the organization’s commitment to the new strategy and, instead, began the process that left the organization stuck in its old pricing habits.
Senior managers have many opportunities to signal their support of a new pricing strategy. Specific actions they should consider include:
- Mandate a comprehensive training program to a) introduce the strategic pricing concepts and b) demonstrate what “good looks like” based on company specific examples of recent “wins” with the new approach.
- Build in regular progress review sessions with business leaders to discuss challenges and to hold individuals accountable for progress.
- Seize opportunities to communicate support for the new approach such as internal blogs, newsletters, and speeches.
- Ensure that other senior leaders are actively involved in the decision-making process so that they can understand the challenges and model desirable behaviors.
Demonstration Projects
Perhaps the most important method for helping managers understand and adopt strategic pricing is the use of demonstration projects that test the new approach and provide an example of “what good looks like.” Successful demonstration projects can be pivotal in building momentum for the new approach and should be given as much exposure as possible. They should be designed to demonstrate the strategy and provide feedback and real outcomes from the commercial teams. They should be focused and of limited duration, or they risk losing the attention of the organization and undermining interest in the new strategy. A good example is when an entertainment company tested a new pricing strategy and price points by selecting a very specific post-holiday period and one focused metric to track growth in total gross profit. By focusing on a discrete period and clearly defining success, the organization built not only interest in the new strategy, but also credibility when it quickly declared the strategy a success and began a full rollout.
A challenge that must be overcome when designing a demonstration project is how to define a baseline for measurement. Skeptical managers across the organization will ask, “How do I know if it was the pricing strategy that drove the outcomes when there are so many moving parts in the market and with our own commercial activities?” The best and quickest way to address this concern is to treat the demonstration project as a price experiment in which two similar groups of customers are selected. One group receives the new strategy and new prices while the other maintains current prices and policies. This provides an objective measure of the effect of the new strategy and builds credibility within the organization. The consumer entertainment company did a thoughtful job of defining a control sample of similar products that were used to establish a baseline against which the new strategy could be tested. The results of the test were then distributed to everyone in the sales organization through webcasts and sales meetings. The test contributed significantly to the organization’s acceptance of the new prices.
One of the major benefits of demonstration projects is that the leaders of the project often become internal champions for the change effort. There is no better spokesperson for strategic pricing than someone who has experienced the outcomes first-hand. This is especially true for pricing, where even small barriers are seen as reason for abandoning an effort and sticking with the tried and true. Having more managers express confidence in the new pricing approach legitimizes the effort and provides confidence that it can lead to success. While having the most senior leader supporting an effort can be extremely important to success, there is also great value in having junior managers’ support, as they face challenges similar to their peers, giving them strong credibility.
Summary
Implementing new strategic pricing is one of the most challenging activities facing commercial leaders today because there are so many pieces to the puzzle. In this chapter, we have outlined the major elements required to structure the pricing function and ensure that pricing decisions are made consistently across the organization. Success requires a combination of structural changes (such as process redesign and decision rights allocation) and individual motivation levers (such as incentives and metrics) that enable managers to make more profitable decisions. The degree of change is substantial, and we would be negligent if we did not acknowledge that the change process can often take years to complete. However, the data from our research clearly show that the financial results justify the effort—firms adopting the principles of strategic pricing and implementing those principles throughout the organization earn on average 24 percent higher operating incomes then their industry peers.2