
p.454
THE CHANGING GEOGRAPHY OF INNOVATION AND THE MULTINATIONAL ENTERPRISE
Davide Castellani
Introduction1
The Economic Geography literature largely recognises that there are benefits from localised interactions and exchanges of knowledge which generate what Storper and Venables (2004) characterise as the ‘local buzz’ that tends to lead to an ever-increasing geographical concentration of innovation activity in a few regions. However, it may be both unrealistic and undesirable for economic regions to rely only on ‘local buzz’ for developing their knowledge base, and successful clusters need to combine knowledge internal and external to the cluster. To this end, ‘global pipelines’ need to be established in order to allow external knowledge to flow into the clusters (Bathelt, Malmberg & Maskell, 2004; Owen-Smith & Powell, 2004). The International Business literature has long established that multinational enterprises (MNEs) – that can be conceptualised as global orchestrators of knowledge – are in a privileged position to build these pipelines by tapping into diverse knowledge clusters and thanks to their ability to de-contextualise tacit knowledge and transfer it within the MNE and across space (Castellani & Zanfei, 2006; Meyer, Mudambi & Narula, 2011; Cano-Kollmann et al., 2016).
Based on this conceptual map, this chapter provides descriptive evidence of the changing geography of inventive activity and the role of MNEs in international research and development (R&D), with quite an extensive geographical coverage. On the one hand, OECD REGPAT data on 1,482 regions in 39 countries allow us to describe the changing patterns in patenting activity over 32 years, from 1980 until 2011. On the other, fDi Markets data on over 110,000 investment projects referring to the period 2003–2014, in more than 10,000 cities in 184 different countries, allow us to characterise the geographical concentration of MNEs activities, with special reference to their international R&D.
The rest of the chapter is organised as follows. The next section briefly articulates the conceptual map described earlier. Then we describe the data used in the analysis, and the following section presents the empirical evidence. The final section concludes.
p.455
‘Local buzz’, ‘global pipelines’ and the role of MNEs in global innovation
The role of ‘local buzz’ and ‘global pipelines’ in the changing geography of innovation
Recent research in the geography of innovation has established several stylised and commonly accepted facts including: (i) innovation is spatially concentrated, and (ii) knowledge spillovers are geographically localised (Feldman & Kogler, 2010). The literature has emphasised that while effective knowledge transfer requires a combination of cognitive, organisational, social and institutional proximity (Boschma, 2005; Balland, Boschma & Frenken, 2015), ‘the high level of embeddedness of local firms in a very thick network of knowledge sharing, which is supported by close social interactions and by institutions building trust and encouraging informal relations among actors’ (Breschi & Malerba, 2001, p. 819) boosts the success of local knowledge production and circulation processes. Technological spillovers are held to be easier in compact spaces for a number of reasons. As Marshall (1927) himself pointed out, information is likely to flow more easily because of the natural tendency of people in the same trade to share ideas and discuss and demonstrate improvements. Experimentation is also easier; it is easier to try out new ideas because there is rapid feedback (from demanding customers), and firms are more likely to be able to find the complementary knowledge, resources and assets they need in order to bring their ideas to fruition. Storper and Venables (2004) characterise this localised flow of specialised, highly tacit knowledge as the ‘buzz’ that distinguishes economically dynamic centres of innovation. In their view, ‘local buzz’, refers to the ‘information and communication ecology created by face-to-face contacts, co-presence and co-location of people and firms within the same industry and place or region’ (Bathelt, Malmberg & Maskell, 2004, p. 38). Actors continuously contribute to and benefit from the diffusion of information, gossip and news by just ‘being there’ (Gertler, 2003). ‘Local buzz’ generates opportunities for the transmission of sticky, non-articulated, tacit forms of knowledge between firms located there, and leads to innovation becoming more clustered over time.
However, it may be both unrealistic and undesirable for economic regions to rely only on ‘local buzz’ for developing their knowledge base. Indeed, few, if any, local economies are likely to be completely self-sufficient in terms of the knowledge base from which they draw (Gertler, 2008). Knowledge internal to the cluster eventually needs to be integrated with knowledge external to the cluster. Following Owen-Smith and Powell (2004), Bathelt, Malmberg and Maskell (2004) address these non-local knowledge flows through the concept of global pipelines, which refer to channels of communication used in the interaction between firms in different knowledge-producing centres located at a distance from one another. They argue that ‘global pipelines’ can ‘pump’ information about markets and technologies into the cluster, making the ‘buzz’ more dynamic, by providing access to a more variegated set of knowledge pools from which to draw.
But how (and how much) knowledge is transferred in these global pipelines? How can the obstacles of ‘not being there’ be overcome? (Gertler, 2003, 2008). The Economic Geography literature has not reached a well-developed understanding of how knowledge is supposed to flow across long distances via global pipelines, or under what circumstances this is more – or less – likely to be the case.
At the most basic level, pipelines can be created by firms and organisations, or through personal networks. Lorenzen and Mudambi (2013) examine the role of migrant diasporas in facilitating the creation of such pipelines, with reference to the cases of the movie and IT clusters of Bollywood and Bangalore in India. Maskell, Bathelt and Malmberg (2006) point out the role of temporary clusters, emerging from the participation in trade fairs, exhibition, conventions congresses and conferences. Gertler (2008) discusses how communities of practices, which are defined as groups of workers informally bound together by shared experience, expertise and commitment to a joint enterprise, can be vehicles for supporting learning at a distance. These communities mediate in the joint production and diffusion/transmission of knowledge within and between organisations. Furthermore, they allow some degree of relational proximity, which facilitates knowledge flows across regional and national boundaries. As Gertler (2008) notes, the formation of communities of practice can be encouraged in large MNEs with ‘distributed’ knowledge bases and multiple sites of innovation, and supported by advanced means of electronically mediated communication, to overcome the friction of geographical separation. Indeed, as the next section will argue, the view of the MNEs as global orchestrators of geographically dispersed knowledge have long been established in the International Business literature.
p.456
MNE as global orchestrators of knowledge
There has been a long-standing literature which has identified MNEs as being important actors who transfer technology across international borders (Dunning & Lundan, 2008). Initially, the emphasis in the literature was on the role of foreign direct investment (FDI) as a means whereby firms with an advantage in technology could exploit that advantage in overseas markets. The existence of significant market failures in markets for technology creates a bias in favour of internalisation (Buckley & Casson, 1976).
This view of the MNE is confirmed by the fact that MNEs are key actors in global R&D expenditures, and the bulk of R&D is concentrated in the home country of the MNE (Belderbos, Leten & Suzuki, 2013). However, a discernible trend has emerged going back at least to the 1980s, but accelerating in recent years, for MNEs to disperse their R&D activity geographically (Dunning & Lundan, 2009). This internationalisation of R&D has been driven by demand and supply factors. On the one hand, there are often locational advantages for MNEs to establish overseas R&D operations to tailoring the firm’s product or service more closely to local tastes (Narula & Zanfei, 2005). On the other, the increasing importance of knowledge-based assets as a source of competitive advantage (Hitt, Hoskisson & Him, 1997) has seen an increased focus on location in particularly fertile regions, which are leading centres of knowledge generation and innovation (Cantwell & Iammarino, 2003; Cantwell, 2017). This has been reflected in the increased use of competence-creating mandates to MNE subsidiaries and an increased emphasis on balancing greater autonomy for subsidiaries with the smooth coordination of activities in increasingly complex MNE networks (Cantwell & Mudambi, 2005). Tapping into localised sources of innovation requires conscious effort by MNEs to build suitable business relationships, rather than simply relying on some passive process of osmosis. Cantwell argues that MNEs create portfolios of locational assets which bear a complementary and synergistic relation to each other (Cantwell, 2009).
MNEs are thus becoming global orchestrators of knowledge. By tapping into diverse knowledge clusters, and thanks to their ability to de-contextualise tacit knowledge and transfer it within the MNE and across space (Cantwell & Santangelo, 1999; Castellani & Zanfei, 2006; Meyer, Mudambi & Narula, 2011), they create institutional proximity that allows connections between knowledge sources and to share tacit knowledge across locations despite geographical distance (Almeida, Song & Grant, 2002; Cano-Kollmann et al., 2016; Hannigan, Perri & Scalera, 2016). In other words, MNE are privileged actors to connect clusters (Iammarino & McCann, 2013) and build global pipelines between them.
p.457
But, in order to act as conduits of knowledge between clusters, MNEs need to locate R&D in dispersed locations. Despite the fact that the world is increasingly inter-connected, national borders and distance still matter (Ghemawat, 2016). This begs the question of ‘How far are MNEs willing to go with their R&D in order to be close to the knowledge cluster?’ Castellani, Jimenez and Zanfei (2013) address this question, and argue that on the one hand, concentration of knowledge in few geographically concentrated clusters reduces the set of possible available locations where specific bits of knowledge can be sourced. This may leave the MNE no choice but to locate R&D in a relatively remote location. On the other, the relative unimportance of transport costs in the case of knowledge inputs and outputs, combined with the fact that MNEs have developed routines and organisational structures that enable them to codify, process and transfer (codified and tacit) knowledge across national boundaries and within their internal networks (Gupta & Govindarajan, 1991; Kogut & Zander, 1992; Cantwell & Santangelo, 1999; Zanfei, 2000; Almeida, Song & Grant, 2002; Ambos & Ambos, 2009; Alcácer & Zhao, 2012), makes it more likely that MNEs set up R&D labs in relatively more remote locations. Using data on R&D and manufacturing investments of 6,320 firms in 59 countries, Castellani, Jimenez and Zanfei (2013) find that geographic distance has a lower negative impact on the probability of setting up R&D than manufacturing plants. Furthermore, once having accounted for measures of institutional proximity (such as, belonging to the same trade area or sharing similar religious attitudes and language), MNEs are equally likely to set up R&D labs in nearby or in more remote locations.
Data
Later in this chapter we will highlight some patterns in the geography of inventive activity for the regions of the world from the OECD Regional Innovation Dataset and of the R&D activities of MNEs based on cross-border investment project from the fDi Markets database. Below are brief descriptions of the two sources.
OECD Regional Innovation Dataset (REGPAT)
Data on the inventive activity of regions is drawn from REGPAT, which is part of the OECD Regional Innovation Dataset, and can be retrieved from http://stats.oecd.org.2 REGPAT covers 34 OECD countries, plus 10 non-OECD member countries (Brazil, Colombia, Costa Rica, China, India, Indonesia, Latvia, Lithuania, Russia and South Africa). For the purpose of this analysis, data on Costa Rica, Greece, Indonesia and Slovenia could not be used.
The OECD has classified two levels of subnational units. This classification has been officially established and is relatively stable in all member countries, and is used by many countries as a framework for implementing regional policies. The more aggregate level is Territorial Level 2 (TL2), which covers the first administrative tier of subnational government, while a more fine-grained geographical disaggregation is available at Territorial Level 3 (TL3). The OECD regional typology is primarily based on a criterion which identifies rural communities according to population density. A community is defined as rural if its population density is below 150 inhabitants per km2 (500 inhabitants for Japan and Korea to account for the fact that the national population density exceeds 300 inhabitants per km2). Thus, each TL3 region has been classified as: Predominantly Urban (PU), Intermediate (IN), Predominantly Rural (PR). The vast majority of the latter group of regions are also classified as to whether they are close to a city, or are relatively remote. For these regions, REGPAT allows the tracking of the patent applications. For the purposes of this analysis, we use information from 1980 to 2011 on: Patent Cooperation Treaty (PCT) applications (fractional count by inventor and priority year), number of patents with more than one co-inventor, and the share of co-inventors within the same region, the same country, or foreign. Data on patents have been complemented with information on population. Since data on regional population are not available on the OECD regional dataset prior to the year 2000, we extrapolated regional population using country-wide data, based on the share of each region in a country’s population in the latest available year. For Germany, since data was not available from http://stats.oced.org on population at the same level of disaggregation as for patents, we retrieved data from national sources for 2015 and used the share of regions in national population in that year to extrapolate regional population based on country-wide population for the period 1980–2011.3
p.458
Table 27.1 Basic information on the sample of regions

Source: Author’s elaboration on OECD Regional Innovation Database (stats.oecd.org).
Table 27.1 shows that we have a total of 1,482 regions, of which 86.7% are TL3. For eight countries (Brazil, Canada, China, India, Israel, Portugal, Russia and South Africa) data is available at TL2. Among TL3 regions, 22.9% are urban, 22.5% are rural but close to a city, and the remaining 54.6% are either intermediate or rural-remote. Despite being obviously larger (the median population is over 2.5 million), TL2 are not necessarily patenting more. They account for less than 8% of overall patents, and the median region has only 4 patents per year. On the contrary, patenting activity is overwhelmingly concentrated in urban areas (55.4% of all patents and a median of 22 patents). TL3 regions classified as intermediate, or close to a city, account for 34.1% of overall patents, and have median patents of 10 and 8 respectively.
fDi Markets
f Di Markets is a database produced by fDi Intelligence, a division of the Financial Times Ltd, which tracks cross-border greenfield investments across different industries and countries worldwide. According to the Financial Times Ltd, the information about cross-border investment projects is collected through a variety of sources, such as thousands of media sources, over 2,000 industry organisations and investment agencies, and data purchased from market research and publication companies (more details at www.fdimarkets.com/). fDi Markets is now a widely used source of information for activities of MNEs around the world, both by international organisation such as the UN (UNCTAD, 2016) and academic researchers (D’Agostino, Laursen & Santangelo, 2012; Castellani & Pieri, 2013, 2016; Crescenzi, Pietrobelli & Rabellotti, 2013; Belderbos et al., 2016; Castellani & Lavoratori, 2017; Castellani & Santangelo, 2017; Crescenzi & Iammarino, 2017; Damioli & Vertesy, 2017, among others).
p.459
We have access to a database containing 111,310 investment projects referring to the period 2003–2014, in 184 different countries. For each one of these projects fDi Markets reports information about the investing company name (and its parent), home country and city of the parent company, the industry and the business activity involved in the project, as well as the location of project destination (host country and city). The database contains projects in 17 different types of business activity which, for the purposes of our analysis, we grouped into 5 categories: Coordination activities, R&D-related activities, Production activities, Support services and Advanced services.
The bulk of investments are in Advanced services (including Business services and Sales and Marketing) and production activities, 47.8% and 30.0% respectively. Support services activities account for about 10% of the projects, while R&D-related activities account for 7% and investments aimed to establish global, country or regional headquarters are 5.4% of all investments.
Results
‘Local buzz’ and the geographic concentration of inventive activity
Using REGPAT data we are able to provide a quite detailed picture of the changing geography of inventive activity. In Figures 27.1 and 27.2 we offer a first glance into this evolution, by showing that the number of regions with at least one patent has increased threefold in the period 1980–2011, from fewer than 500 in 1980 to about 1,500 in 2010. The average number of patents per patenting region in each year has increased exponentially over the same period, from a handful in the 1980s to well over 100 after the year 2000. The geographical concentration of the patenting activity is enormous.
The lower panel of Table 21.1 shows the figures for ten largest countries in terms of overall patenting activity, revealing that these countries account for roughly 90% of worldwide patents (with the top three countries, the US, Japan and Germany accounting for over 60%). But countrywide data hide an even higher concentration in a few locations in each country. Figure 27.3 shows that in the first five years of this analysis, the top 100 patenting regions (out of approximately 800, that is roughly 12% of all the patenting regions) accounted for about 70% of the world’s patents. To appreciate the magnitude of this concentration, consider that these top 100 regions accounted for about 10% of the world’s population in the same period. In last period of this analysis (2006–2011), Figure 27.4 reveals that the top 100 regions still account for 70% of patenting but, on the one hand, the number of patenting regions has increased to almost 1,500 thus pointing to a higher concentration. On the other, the top 100 regions in terms of patenting account for 20% of the world’s population, that is twice as much than in the 1980s. This suggests looking at the distribution of patenting per million population, to control for the effect of the increase in the size of regions on their patenting activity.
p.460

Figure 27.1 Number of regions with a least one patent, 1980–2011
Source: Author’s elaboration on OECD Regional Innovation Database (stats.oecd.org).

Figure 27.2 Average number of patents per region, 1980–2011
Source: Author’s elaboration on OECD Regional Innovation Database (stats.oecd.org).
p.461
In Figure 27.5 we show that behind the increase in average patenting per region shown in Figure 27.2, there is a great regional heterogeneity. In fact, the median number of patents per region slightly increases over time, but does not exhibit an exponential growth, standing well below 50 even at the end of the period. Instead, the 75th percentile and the extreme values of the distribution reach close to 100 and over 200, respectively. In other words, few regions appear to have increased their patenting activity dramatically, thus leading to an apparent increase in overall patenting activity, which instead has been very much concentrated in a few locations.

Figure 27.3 Regional concentration of patents, 1980–1984
Source: Author’s elaboration on OECD Regional Innovation Database (stats.oecd.org).

Figure 27.4 Regional concentration of patents, 2006–2011
Source: Author’s elaboration on OECD Regional Innovation Database (stats.oecd.org).
p.462
In Figure 27.6 we provide further evidence of the changing distribution of regional patent activity (per million population). The chart depicts the kernel density4 of patent per million inhabitants in six different five-year periods. Interestingly, while the distribution in 1980–1984 appears quite symmetrical and relatively shifted to the left, in 1985–1989 we can observe a slight shift to the right (suggesting an increase in average patenting per region), but also an increase in the variance and a thickening left tail. From the beginning of the 1990s, a singular pattern merges: the left tail of the distribution – that is regions with approximately fewer than 2.5 patents per population5 – does not seem to change over time, but the distribution becomes ever more skewed to the right and with increased variance. This suggests that, over time, some regions with more significant patenting activity keep increasing their rate of inventive activity, while others lag behind. This is consistent with the idea that inventive activity benefits from the ‘local buzz’ stemming from clustering: the more regions engage in innovative activities, the more they create positive externalities for further innovation. Interestingly, a large regional heterogeneity in patenting activity is not a feature of a few countries. Indeed, most countries exhibit a large regional variety in the number of patents per million inhabitants.6
The changing distribution of patenting suggests that previous inventive activity is a major predictor of future activity. We test this conjecture first by showing transition matrices7 of regions according to their quintile of the patents per million inhabitants, and then with slightly more rigorous regression analyses.

Figure 27.5 Box-plot of number of patents per million inhabitants per region, 1980–2011
Source: Author’s elaboration on OECD Regional Innovation Database (stats.oecd.org).
p.463

Figure 27.6 Kernel density of the regional distribution of patents per million inhabitants, 1980–2011 (five-year intervals)
Source: Author’s elaboration on OECD Regional Innovation Database (stats.oecd.org).
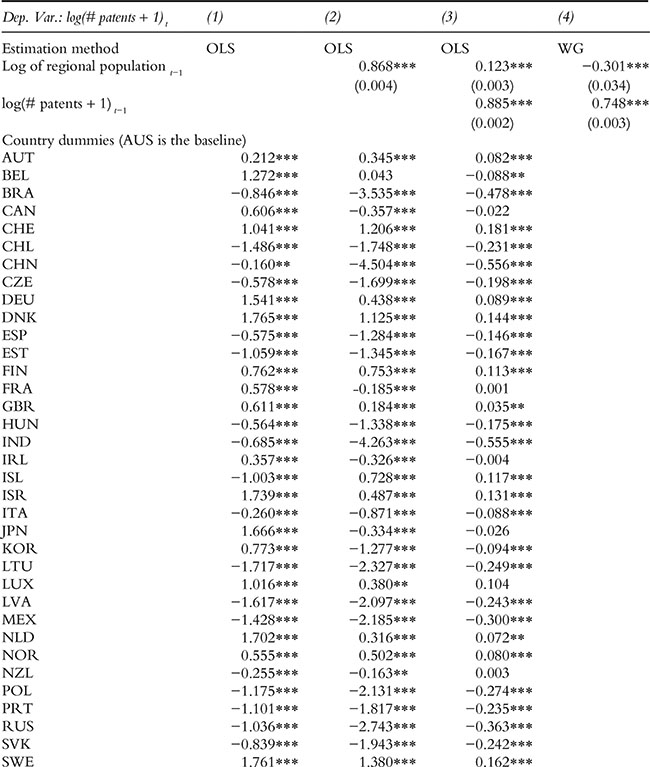
Table 27.2 tabulates regions according to the quintiles of the distribution in patents per million inhabitants they are in year t−1 and in year t, where t denotes a five-year interval during 1980–1984. Results reveal that regions are extremely likely to remain in the same quintile: percentages along the diagonal of the transition matrix range from 60.89% to 80.8%. However, the probability of moving upwards or downwards is not negligible. For example, regions in the 4th quintile in t−1 have a 21.4% probability of falling to the third quintiles in the next five-year period, and a 16.7% probability of moving to the top percentile. Table 27.3 provides more evidence consistent with this result, this time using yearly data and controlling for other sources of regional heterogeneity. We estimate the following regression:
Table 27.2 Transition matrix of regions, by quintiles of number of patents per million inhabitants, 1980–2011 (five–year periods)

Source: Author’s elaboration on OECD Regional Innovation Database (stats.oecd.org).
p.464
pit = α + βpi,t-1 + δxit + µj + θt + εit
(1)
where pit denotes the log of 1 + number of patents with inventors from region i at time t, xit denotes regional population, µj and θt denote country and time fixed effects respectively.
Table 27.3 Regressions of the number of patents by region, 1980–2011 (five-year periods)
p.465

Source: Author’s elaboration on OECD Regional Innovation Database (stats.oecd.org).
This regression provides some information on the degree of persistence of regional patenting activity, or the extent to which regional patents are explained by previous patenting activity, once controlled for the size of a region and country characteristics. We estimate equation (1) with OLS and present results in column (2) of Table 27.3. In column (4) we estimate the same equation using region fixed effects (within-group estimator). While we cannot interpret such estimates as strictly causal, due to endogeneity issues, it is generally accepted that true coefficients will be in the range of values between OLS, which will tend to yield slightly upward biased estimates, and the within-group, which will tend to return downward biased estimates. Table 27.3 suggests that persistence is quite high, and comprised between 0.885 and 0.748. Figure 27.7 and Figure 27.8 are based on estimates retrieved from the variants of equation (1). In particular, we allow the persistence effect to change over time, by interacting past patents with year dummies, using OLS and within-group estimators respectively (equation (2)).
pit = α + ΣLi = 1 γi (pit-1 × Di)+ δxit + µj + θt + εit
(2)
Results suggest that persistence has increased quite rapidly over the 1980s and remained relatively stable thereafter. This implies that the importance of clustering of innovation has been consistently high for more than two decades now, suggesting that, conditional on size, country and even other unobserved regional characteristics, current patenting strongly depends on previous inventive activity.
In sum, the analysis of global inventive activity over three decades suggests that the number of regions that participate in the global production of innovation has substantially increased, but the bulk of these activities remains very concentrated in a few locations, which are not necessarily the largest. This is consistent with the idea that innovation benefits from the ‘local buzz’ stemming from clustering of innovators, and this favours a persistence of innovation in a few locations.

Figure 27.7 Time varying coefficients of the persistence in regional patenting activity, OLS estimates (with country fixed effects)
Source: Author’s elaboration on OECD Regional Innovation Database (stats.oecd.org).
p.466

Figure 27.8 Time varying coefficients of the persistence in regional patenting activity, within-group estimates
Source: Author’s elaboration on OECD Regional Innovation Database (stats.oecd.org).
‘Global pipelines’ and the increasing need to collaborate with distant partners in inventive activity
While the ‘local buzz’ argument predicts that innovation would tend to be concentrated in few locations that persistently produce more innovative output than others, the ‘global pipelines’ argument suggests that clusters need to favour the influx of external knowledge, in order to further enrich the local knowledge base. We try to provide some evidence of this mechanism by looking at the dynamics of co-inventions. In particular, we exploit the information available in REGPAT on the share of co-invented regional patents with co-inventors located within the region, within the country (but outside the region) or abroad. Figure 27.9 shows that in each of the five-year periods from 1980 until 2011, the co-invention with partners located within the region is by far the highest. The median value ranges from close to 60% in 1980–1984 to roughly 50% in 2005–2011. This confirms the importance of ‘being there’ (Gertler, 2003). In order to exchange knowledge, geographical proximity is vital. However, it is quite interesting to notice that international collaboration in inventive activity has increased substantially over time. Figure 27.9 reveals that the median share of such long-distance co-inventing activities remained close to zero for the best part of the 1980s, and then consistently increased to about 8% over the 2000s. Most notably, a significant heterogeneity across regions is evidenced, with the 75th percentile reaching over 15% of international collaboration in patenting activity and extreme values over 35%. This is confirmed by Figure 27.10, showing the kernel densities of the share of co-patenting with foreign inventors over time. It is quite evident that the right tail has become constantly fatter. Therefore, more than showing a trend of increasing international collaboration, data suggest that some regions have increased their degree of co-patenting with foreign inventors. Interestingly, substantial heterogeneity exists in most countries (to save space, data are not shown, but they are available from the authors upon request).
In sum, data on co-invention confirm the importance of proximity for exchanging knowledge, but also reveal that some regions are increasingly setting up global pipelines. These results are consistent with other evidence from the UK, showing that geographical proximity is only weakly linked to collaboration among inventors (Crescenzi, Nathan & Rodríguez-Pose, 2016). At the current stage of the analysis it is not possible to ascertain whether such global pipelines are established by the top performing regions where ‘global pipelines’ complement ‘local buzz’, or rather by laggard locations that use ‘global pipelines’ to substitute for limited ‘local buzz’.
p.467

Figure 27.9 Box-plot of the propensity to co-patent, by location of the co-inventor, 1980–2011 (five-year periods)
Source: Author’s elaboration on OECD Regional Innovation Database (stats.oecd.org).

Figure 27.10 Kernel density of the regional propensity to co-patent with foreign co-inventors, 1980–2011 (five-year intervals)
Source: Author’s elaboration on OECD Regional Innovation Database (stats.oecd.org).
p.468
Emerging economies and the regional patterns of inventive activity
In this section, we uncover some evidence on the role of emerging economies in shaping the regional patterns of inventive activity. Given that the sample is largely based on OECD countries plus some emerging and transition economies, we have decided to group countries as to whether they are:
a Core OECD countries that joined the OECD prior to 1980. This group of countries includes the traditionally advanced economies, such as Australia, Austria, Belgium, Canada, Denmark, Finland, France, Germany, Iceland, Ireland, Italy, Japan, Luxembourg, Netherlands, New Zealand, Norway, Portugal, Spain, Sweden, Switzerland, Turkey, United Kingdom, United States.
b Other OECD countries that joined OECD in the period considered in this analysis (1980–2011), and include Chile, Czech Republic, Estonia, Hungary, Israel, Mexico, Poland, Korea, Slovakia.
c Non-OECD countries, which include Brazil, China, India, Latvia (that joined OECD only in 2016), Lithuania, Russia, South Africa.
Table 27.4 Patenting activity, by groups of countries and five-year periods, 1980–2011

p.469

Source: Author’s construction.
Notes:
Other OECD countries joined OECD between 1980–2011: Chile, Czech Republic, Estonia, Hungary, Israel, Mexico, Poland, Korea, Slovakia.
Non-OECD countries: Brazil, China, India, Latvia (joined OECD in 2016), Lithuania, Russia, South Africa.
The latter two groups may be considered emerging or recently industrialised economies.
Core OECD are countries that joined OECD before 1980: Australia, Austria, Belgium, Canada, Denmark, Finland, France, Germany, Iceland, Ireland, Italy, Japan, Luxembourg, Netherlands, New Zealand, Norway, Portugal, Spain, Sweden, Switzerland, Turkey, United Kingdom, United States.
Table 27.4 provides some descriptive statistics on the patterns of inventive activities in these groups of countries. First, it shows the dynamics of the number of patenting regions. While the number of patenting regions has increased across the board, emerging regions involved in patenting activity increased approximately ten-fold (from 29 to 239 ‘Other OECD’ and from 16 to 178 ‘Non-OECD’ regions). Second, this increased participation in inventive activity is mirrored in a substantial share of patents in more recent decades. In the second half of the 2000s the share of patents in core OECD regions dropped to 85.5%, as compared to 98% in the 1980s. Similarly, by the end of the period under consideration, the number of patents per patenting region in the core OECD regions is twice the corresponding figure in non-OECD countries in the sample, while in the 1980s they were between five and ten times larger. Third, these figures partly reflect the dramatic increase in population in some of these emerging countries. When the number of patents is normalised by population, the gap between the core OECD countries and the non-OECD group remains fairly large. Despite an increase that brought the average number of patents per population from below 1 until the early 1990s to close to 4 by the end of the 2000s, still the more advanced countries have more than 20 times more patents per million inhabitants. Fourth, the increase in patenting activity in emerging economies appears to be very heterogeneous across regions: the coefficient of variation, that is the standard deviation as a proportion of the mean, is above 3 in ‘Other OECD’ countries and around 2 for ‘Non-OECD’ countries, from the 1990s onwards. This suggests that in emerging countries the variability in regional patenting activity is substantially larger than in more advanced economies. This is consistent with a higher disparity in economic development across regions within the former group of countries. Fifth, the propensity to engage in international co-inventions reveals opposite dynamics over time for different groups of countries. On the one hand, the core OECD regions exhibit a consistent increase in the importance of co-patenting with foreign inventors. On the other, emerging economies exhibit generally a higher share of international co-patenting, with a somewhat decreasing, although volatile, trend. This suggests that global pipelines may be necessary both in late coming clusters in emerging economies to provide an initial boost to local knowledge creation that eventually spurs the ‘local buzz’ effect, and in established clusters in advanced economies to provide external knowledge to complement knowledge internal to the cluster.
MNEs and the location of international R&D activities
The empirical analysis so far has highlighted the fact that few locations in the world account for a disproportionate amount of global inventive activity, and that regions increasingly engage in long-distance collaborations for innovation. The data do not allow us to ascertain to what extent such international collaborations are in fact driven by MNEs locating in a certain region. In fact, it is quite possible that the presence of a subsidiary of an MNE spurs co-invention with local firms, and the inventors’ team also includes some researcher engaged in the other labs within the MNE (in the home country or elsewhere). Indeed, earlier we argued that MNEs are privileged actors for establishing global pipelines linking different local clusters. In this section, we will provide some evidence broadly consistent with this view. The analysis will rely on data on cross-border R&D-related investments from the fDi Markets database. Figure 27.11 provides some evidence matching the extreme geographical concentration of patenting activity. Likewise, activities of MNEs are extremely concentrated. fDi Markets does not provide directly information on TL2 and TL3 regions, so we use cities as the geographical unit of analysis here. Business services are the most geographically concentrated activity, but R&D is also quite concentrated in a few locations. For example, 5% of about 1,600 cities attracting at least one investment in R&D and Design, Development & Testing over the period 2003–2014 (that is roughly 80 cities), received 60% of all R&D-related centres established in the period. This degree of concentration is not dissimilar from the concentration of patenting activity, although unfortunately at this stage we are not able to match the cities to TL2 and TL3 regions, so we cannot ascertain the degree of overlap between the geographical distribution of patents and cross-border R&D investments.
p.470
Table 27.5 Cross-border investment projects and average distance, by main business activity, 2003–2014

Source: Author’s elaboration on fDi Markets.

Figure 27.11 Concentration of cross-border investment projects by city, 2003–2014
Source: Author’s elaboration on fDi Markets.
p.471
However, the evidence is consistent with the idea that MNEs may be locating their R&D in order to tap into clusters providing specific and advanced sources of knowledge. According to the theoretical arguments laid out earlier, MNEs may need to travel long distances to tap into such clusters. Consistent with this argument, Table 27.5 shows that the distance between the home and host city is the largest when MNEs locate R&D activities abroad: 7,771 km vs an average distance of 6,347 km (22.4% higher) and 5,707 km in the case of production-related investments (36% higher). More robust evidence along these lines is provided in Castellani, Jimenez and Zanfei (2013).
Concluding remarks
Building on a sketched conceptual framework that links Economic Geography and International Business literature, this chapter has highlighted that the geography of innovation is shaped by forces leading to increasing geographical concentration of innovative activities, benefiting from localised interactions and exchanges of knowledge (the ‘local buzz’ argument). However, successful clusters need to combine knowledge internal and external to the cluster. To this end, ‘global pipelines’ need to be established to allow external knowledge to flow into the clusters. Such pipelines can be the result of links between both individuals and institutions. International collaboration in patenting activity and MNEs can play a key role in building these pipelines. In particular, MNEs can be conceptualised as global orchestrators of knowledge. By tapping into diverse knowledge clusters and thanks to their ability to de-contextualise tacit knowledge and transfer it within the MNE and across space, they create institutional proximity that allows connections between knowledge sources and to share tacit knowledge across locations despite geographical distance. But, in order to act as conduits of knowledge between clusters, MNEs need to locate R&D in dispersed locations.
Using this conceptual map, we have provided descriptive evidence of the changing geography of inventive activity and the role of MNEs’ international R&D activities, with quite an extensive geographical coverage. On the one hand, OECD REGPAT data on 1,482 regions in 39 countries allowed us to describe the changing patterns in patenting activity over 32 years, from 1980 until 2011. On the other, fDi Markets data on 111,310 investment projects referring to the period 2003–2014, in more than 10,000 cities in 184 different countries, allow us to characterise the geographical concentration of MNEs’ activities, with special reference to their international R&D.
Results confirm the widely established fact that innovation is geographically concentrated, but highlight some important nuanced findings. First, the number of regions involved in patenting has increased threefold since the 1980s. This increase is largely due to innovative activity starting in emerging countries, but even in core-OECD countries the number of regions with some inventive activity has increased by more than 35% over the past three decades. Second, despite this increase in the number of regions’ patenting, 70% of inventions come from the top 100 regions. While large emerging regions have become more important in overall patenting, advanced economies still overwhelmingly dominate in terms of patents per inhabitant. Third, although the hierarchy of the top patenting regions is not immobile, the propensity to patent is quite dependent on previous innovation. This leads to an increasingly fat-tailed distribution of patenting and high heterogeneity in patenting activity. Not surprisingly, this geographical diversity in patterns of innovation is markedly more evident in emerging countries, but it is a feature of most advanced countries as well. Fourth, international collaboration in patenting has been steadily on the rise over the last three decades. This seems to be the result of a combination of the higher incidence of innovation from emerging countries, where co-invention with foreign partners is systematically higher (although on a downward trend), and a non-negligible increase in the importance of co-inventions across national borders in core-OECD regions (which almost doubled over time). Fifth, international R&D investments of MNEs are indeed also very concentrated in a few locations, which can also be quite distant from the MNEs’ headquarters’ location.
p.472
Overall, the findings are consistent with our conceptual map, and, in particular, they highlight that ‘local buzz’ is crucial for the development of knowledge in local economies, and it leads to persistence in innovative activities. However, ‘global pipelines’ are also becoming a crucial element for the successful development of local knowledge, by ‘pumping’ information about markets and technologies into the cluster, making the ‘buzz’ more dynamic, and providing access to a more variegated set of knowledge pools from which to draw. This is evidenced by the increased role of cross-border co-invention which, interestingly, seems to characterise both clusters in emerging economies that may use such ‘global pipelines’ to catch-up, and by clusters in advanced economies, which may use them to revive their knowledge base and keep up with increased competition for innovation. Finally, the evidence suggests that MNEs can play a key role in bridging knowledge across clusters, and they indeed locate their R&D labs in few centres of excellence, and in doing this, they overcome the cost of managing activities quite dispersed in geographic space.
Much needs to be done in the area of research, and in particular, we believe that this chapter could spur further analyses on the factors underlying the engagement of regions in cross-border inventions, or more generally, the establishment of ‘global pipelines’. Key questions to be addressed are: Are the most innovative regions also engaging in international collaboration to further their lead in knowledge production? Or instead, to what extent are global pipelines a means to catch-up? Furthermore, by combining data on R&D investments by MNEs and patenting activity at the same local level, one could assess the extent to which MNEs are attracted to innovative regions, and/or contribute to it. In this respect, a key question to be addressed is about the role of MNEs in establishing such long-distance collaboration in patenting: Are these truly collaborations across borders, or are they mediated by the presence of subsidiaries of foreign MNEs in the local economies?
Notes
1 The author is extremely grateful to Gary Cook for his editorial role and for precious suggestions that helped shape this manuscript.
2 REGPAT has been extensively used for geographical analysis of patenting activity, but, to the best of our knowledge, very few studies use it to describe worldwide patterns of inventive activity. Examples in this direction are Usai (2011) for a truly worldwide analysis similar to the one carried out in this work; Crescenzi, Rodríguez-Pose and Storper (2007, 2012) provide pairwise comparisons of large countries and economic areas such as the US and Europe and China and India.
3 I am thankful to Bjorn Jindra for providing these data.
4 Kernel densities are a non-parametric way to estimate the probability density function of a random variable. In a nutshell, kernel density estimation is a way to smooth observed frequencies of a variable, to provide an indication of the density in a population based on a finite data sample. Each point of a kernel density can be interpreted as the probability to observe a certain value of a variable x (on the horizontal axis).
p.473
5 Values on the horizontal axis of Figure 27.6 are natural logarithms of the number of patents per million inhabitants, therefore a value of 1 corresponds to approximately 2.5 patents per million inhabitants.
6 To save space, data are not shown, but they are available from the authors upon request.
7 A transition matrix provides information on the probability that individuals move from one state to another over time. In this case, the matrix is based on the five quintiles of the regional distribution of patents by five-year periods, and indicates the probability that a region that is a certain quintile of the distribution in one period, is the same or another quintile in the next period.
References
Alcácer, J. & Zhao, M. (2012) ‘Local R&D strategies and multilocation firms: The role of internal linkages’, Management Science, 58, pp. 734–753.
Almeida, P., Song, J. & Grant, R.M. (2002) ‘Are firms superior to alliances and markets? An empirical test of cross-border knowledge building’, Organization Science, 13, pp. 147–161.
Ambos, T.C. & Ambos, B. (2009) ‘The impact of distance on knowledge transfer effectiveness in multinational corporations’, Journal of International Management, 15, pp. 1–14.
Balland, P.A., Boschma, R. & Frenken, K. (2015) ‘Proximity and innovation: From statics to dynamics’, Regional Studies, 49, pp. 907–920.
Bathelt, H., Malmberg, A. & Maskell, P. (2004) ‘Clusters and knowledge: Local buzz, global pipelines and the process of knowledge creation’, Progress in Human Geography, 28, pp. 31–56.
Belderbos, R., Leten, B. & Suzuki, S. (2013) ‘How global is R&D? Firm-level determinants of home-country bias in R&D’, Journal of International Business Studies, 44, pp. 765–786.
Belderbos, R., Sleuwaegen, L., Somers, D. & De Backer, K. (2016) ‘Where to locate innovative activities in global value chains’, OECD Science, Technology and Industry Policy Papers, No. 30. Paris: OECD.
Boschma, R. (2005) ‘Proximity and innovation: A critical assessment’, Regional Studies, 39, pp. 61–74.
Breschi, S. & Malerba, F. (2001) ‘The geography of innovation and economic clustering: Some introductory notes’, Industrial and Corporate Change, 10, pp. 817–833.
Buckley, P.J. & Casson, M. (1976) The Future of the Multinational Enterprise. New York: Springer.
Cano-Kollmann, M., Cantwell, J., Hannigan, T.J., Mudambi, R. & Song, J. (2016) ‘Knowledge connectivity: An agenda for innovation research in International Business’, Journal of International Business Studies, 47, pp. 255–262.
Cantwell, J. (2009) ‘Location and the multinational enterprise’, Journal of International Business Studies, 40, pp. 35–41.
Cantwell, J. (2017) ‘Innovation and International Business’, Industry and Innovation, 24, 41–60.
Cantwell, J. & Iammarino, S. (2003) Multinational Corporations and European Regional Systems of Innovation. London: Routledge.
Cantwell, J. & Mudambi, R. (2005) ‘MNE competence-creating subsidiary mandates’, Strategic Management Journal, 26, pp. 1109–1128.
Cantwell, J. & Santangelo, G.D. (1999) ‘The frontier of international technology networks: Sourcing abroad the most highly tacit capabilities’, Information Economics and Policy, 11, pp. 101–123.
Castellani, D., Jimenez, A. & Zanfei, A. (2013) ‘How remote are R&D labs? Distance factors and international innovative activities’, Journal of International Business Studies, 44, pp. 649–675.
Castellani, D. & Lavoratori, K. (2017) ‘The lab and the plant. Offshore R&D and co-location with production activities’. Paper presented at the 2017 R&D Management Conference, Leuven 1–5 July 2017.
Castellani, D. & Pieri, F. (2013) ‘R&D offshoring and the productivity growth of European regions’, Research Policy, 42, pp. 1581–1594.
Castellani, D. & Pieri, F. (2016) ‘Outward investments and productivity: Evidence from European regions’, Regional Studies, 50, pp. 1945–1964.
Castellani, D. & Santangelo, G. (2017) ‘Quo Vadis? Cities and the location of MNEs activities along the value chain’, Paper presented at the 44th AIB-UK&I Conference and 6th Reading Conference, Reading, 6–8 April 2017.
Castellani, D. & Zanfei, A. (2006) Multinational Firms, Innovation and Productivity. Cheltenham, UK: Edward Elgar.
p.474
Crescenzi, R. & Iammarino, S. (2017) ‘Global investments and regional development trajectories: The missing links’, Regional Studies, 51, pp. 97–115.
Crescenzi, R., Nathan, M. & Rodríguez-Pose, A. (2016) ‘Do inventors talk to strangers? On proximity and collaborative knowledge creation’, Research Policy, 45, pp. 177–194.
Crescenzi, R., Pietrobelli, C. & Rabellotti, R. (2013) ‘Innovation drivers, value chains and the geography of multinational corporations in Europe’, Journal of Economic Geography, 14, pp. 1053–1086.
Crescenzi, R., Rodríguez-Pose, A. & Storper, M. (2007) ‘The territorial dynamics of innovation: A Europe–United States comparative analysis’, Journal of Economic Geography, 7, pp. 673–709.
Crescenzi, R., Rodríguez-Pose, A. & Storper, M. (2012) ‘The territorial dynamics of innovation in China and India’, Journal of Economic Geography, 12, pp. 1055–1085.
D’Agostino, L.M., Laursen, K. & Santangelo, G.D. (2012) ‘The impact of R&D offshoring on the home knowledge production of OECD investing regions’, Journal of Economic Geography, 13, pp. 145–175.
Damioli, G. & Vertesy, D. (2017) ‘The seductive power of Irish rain. Location determinants of foreign R&D investments in European regions’. Paper presented at the 2017 R&D Management Conference, Leuven 1–5 July 2017.
Dunning, J.H. & Lundan, S. (2008) Multinational Enterprises and the Global Economy. Cheltenham, UK: Edward Elgar.
Dunning, J.H. & Lundan, S. (2009) ‘The internationalization of corporate R&D: A review of the evidence and some policy implications for home countries’, Review of Policy Research, 26, pp. 13–33.
Feldman, M.P. & Kogler, D. (2010) ‘Stylized facts in the geography of innovation’, in Hall, B. & Rosenberg, N. (Eds.), Handbook of the Economics of Innovation. Volume 1. Amsterdam: Elsevier, pp. 381–410.
Gertler, M. (2003) ‘Tacit knowledge and the Economic Geography of context, or the undefinable tacitness of being (there)’, Journal of Economic Geography, 3, pp. 75–99.
Gertler, M. (2008) ‘Buzz without being there? Communities of practice in context’, in Amin, A. & Roberts, J. (Eds.), Community, Economic Creativity, and Organization. Oxford, UK: Oxford University Press, pp. 203–226.
Ghemawat, P. (2016) The Laws of Globalization and Business Applications. Cambridge, UK: Cambridge University Press.
Gupta, A.K. & Govindarajan, V. (1991) ‘Knowledge flows and the structure of control within multinational corporations’, Academy of Management Review, 16, pp. 768–792.
Hannigan, T.J., Perri, A. & Scalera, V.G. (2016) The Dispersed Multinational: Does Connectedness Across Spatial Dimensions Lead to Broader Technological Search? Working paper No. 11. Department of Management, Università Ca’Foscari Venezia.
Hitt, M.A., Hoskisson, R.E. & Him, H. (1997) ‘International diversification: Effects on innovation and firm performance in product diversified firms’, Academy of Management Journal, 40, pp. 767–798.
Iammarino, S. & McCann, P. (2013) Multinationals and Economic Geography: Location, Technology and Innovation. Cheltenham, UK: Edward Elgar.
Kogut, B. & Zander, U. (1992) ‘Knowledge of the firm, combinative capabilities, and the replication of technology’, Organization Science, 3, pp. 383–397.
Lorenzen, M. & Mudambi, R. (2013) ‘Clusters, connectivity and catch-up: Bollywood and Bangalore in the global economy’, Journal of Economic Geography, 13, pp. 501–534.
Marshall, A. (1927) Industry and Trade. London: Macmillan.
Maskell, P., Bathelt, H. & Malmberg, A. (2006) ‘Building global knowledge pipelines: The role of temporary clusters’, European Planning Studies, 14, pp. 997–1013.
Meyer, K.E., Mudambi, R. & Narula, R. (2011) ‘Multinational enterprises and local contexts: The opportunities and challenges of multiple embeddedness’, Journal of Management Studies, 48, pp. 235–252.
Narula, R. & Zanfei, A. (2005) ‘Globalisation of innovation’, in Fagerberg, J., Mowery, D. & Nelson, R.R. (Eds.), Handbook of Innovation. Oxford, UK: Oxford University Press, pp. 318–345.
Owen-Smith, J. & Powell, W.W. (2004) ‘Knowledge networks as channels and conduits: The effects of spillovers in the Boston biotechnology community’, Organization Science, 15, 5–21.
Storper, M. & Venables, A.J. (2004) ‘Buzz: Face-to-face contact and the urban economy’, Journal of Economic Geography, 4, pp. 351–370.
UNCTAD (2016) World Investment Report 2016. Investor Nationality: Policy Challenges. New York and Geneva: UNCTAD.
Usai, S. (2011) ‘The geography of inventive activity in OECD regions’, Regional Studies, 45, pp. 711–731.
Zanfei, A. (2000) ‘Transnational firms and changing organisation of innovative activities’, Cambridge Journal of Economics, 24, pp. 515–554.