
16
Evidence-based forecasting1
I know of no investor or entrepreneur who has ever seen a forecast that came in exactly on the money. Some forecasts turn out too high, others too low. Forecasting is an inherently difficult task because no one has a perfect crystal ball. The future is inherently uncertain, especially in today’s rapidly changing markets. Consumer wants and needs change, buffeted by the winds of ever-changing macro trends. Competitors come and go. New technologies sweep away old ones.
Some forecasts are based on extensive and expensive research, others on small-scale enquiries, still others on uninformed hunches. Forecasting plays a central role in all kinds of planning and budgeting in all kinds of businesses and organizations. For entrepreneurs, forecasting can be crucial at some point because it’s the foundation on which every business plan is based. The forecast drives the level of expenses that will be required to operate the business. It drives the level of investment needed to produce the sales. And it tells the entrepreneur whether there’s enough revenue to be had from the opportunity to make it worthy of pursuit.
The lean start-up school argues that forecasts made too early are probably baseless, and rightly so. But eventually, if your opportunity looks like it might pan out, the time will come when you want to prepare a forecast, for your benefit or at others’ request. But how?
A forecaster’s toolkit: a tool for every forecasting setting
Before choosing a method to prepare a forecast, the entrepreneur must know first what is to be estimated or forecasted. First, there’s market potential, i.e. the likely demand from all actual and potential buyers of a product or product class. An estimate of market potential often serves as a starting point for preparing a sales forecast, about which we’ll talk more later.
For your venture, prospective investors will want to know how large the potential market for your goods or services will be in the coming years, measured perhaps in several ways: in numbers of potential users, numbers of units to be purchased and in pounds sterling, dollars or even Tanzanian shillings, if you are in Tanzania. There’s also the size of the currently penetrated market – those who are actually using goods or services like those you propose to offer. Investors will also want to know these figures – the size of the potential and penetrated markets – for the market segments you intend to serve, i.e. your target market. Clearly, though, you will not win a 100 per cent share of this market. You’ll probably also need to prepare a sales forecast, perhaps for three to five years going forward, if you get to writing a business plan. How might you do all these things?
In established organizations, there are two broad approaches for preparing a sales forecast: top-down and bottom-up. Under the top-down approach, a central person or people take the responsibility for forecasting and prepare an overall forecast, perhaps using aggregate economic data, current sales trends or other of the methods described shortly. Under the bottom-up approach – a common approach in decentralized firms – each part of the company prepares its own sales forecast, and the parts are aggregated to create the forecast for the firm as a whole. Either of these logics may be useful in preparing a sales forecast for your new venture.
For example, using the bottom-up logic, you can break your anticipated demand into pieces – either market segments or product lines – and add up the components to create the summary forecast. There are numerous advantages to using this approach. First, it will force you to think clearly about the drivers of demand for each market segment or product line and thus understand better the real potential of your opportunity and the parts thereof. Second, you will be forced to make explicit assumptions about the drivers of demand in each category, assumptions you can debate – and support with evidence gathered from your research – with prospective investors and that you and they can verify later as the business unfolds. Third, such an approach facilitates ‘What if . . .?’ planning. Various combinations of market segments and/or product lines can be combined to build a plan that looks viable.
So, what forecasting methods or tools can you choose from? There are six major evidence-based methods for estimating market potential and forecasting sales: statistical methods, observation, surveys, analogy, judgement and market tests. A seventh method, not evidenced-based – the SWAG or silly wild ass guess – is not condoned here, though there is little else to support the forecasts in many business plans.
Statistical and other quantitative methods
Statistical methods use past history and various statistical techniques, such as multiple regression and time series analysis, to forecast the future based on an extrapolation of the past. Is this method useful for entrepreneurs or new product managers charged with forecasting sales for a new product or new business? Often not, for there is no history in their venture on which to base a statistical forecast. Your business may not even exist yet.
In established firms, for established products, statistical methods are extremely useful. When Michelin, the tyre maker, wants to forecast demand for the replacement car tyre market in Europe for the next year, it can build a statistical model using factors such as the number and age of vehicles currently on the road in Europe, predictions of gross domestic product for the region, the last few years’ demand and other relevant factors to forecast market potential, as well as Michelin’s own replacement tyre sales for the current year. Such a procedure is likely to result in a considerably more accurate forecast than other methods, especially if Michelin has years of experience with which to calibrate its statistical model.
As with all forecasting methods, there are important limitations of statistical methods. The most important of these is that statistical methods generally assume that the future will look very much like the past. Sometimes this is not the case. US WEST, the regional Bell telephone company serving the Rocky Mountain and northwest regions of the USA, ran into trouble in the 1990s when its statistical models used to predict needs for telephone capacity failed to allow for the rapidly increasing use of computer modems, faxes and second lines for teenagers in American homes. Suddenly, the average number of lines per home skyrocketed, and there was not enough physical plant – cable in the ground, switches and so on – to accommodate the growing demand. Consumers had to wait, sometimes for months, to get additional lines, and they were not happy about it.2 Similarly, if product or market characteristics change, then statistical models used without adequate judgement may not keep pace. When tyre makers began producing car tyres that would last 80,000 miles instead of 30,000 to 50,000 miles, the annual demand for replacement tyres was reduced. If car manufacturers were to change the number of wheels on the typical car from four, then the old statistical models would also be in trouble.
A variety of other quantitative forecasting methods, especially for new product forecasting, have also been developed. These include methods to model mathematically the diffusion of innovation process for consumer durables,3 and conjoint analysis,4 a method to forecast the impact upon consumer demand of different combinations of attributes that might be included in a new product. For entrepreneurs who are so inclined, these methods are worth a look.
Observation
Another method for preparing an evidence-based forecast is to observe or gather existing data directly about what real consumers really do in the product market of interest. Like statistical methods, observation-based forecasting is attractive because it is based on what people actually do. To the extent that behavioural or usage data can be found from existing secondary sources – in company files, at the library or on the Internet – data collection is both faster and cheaper than if a new study has to be designed and carried out. For new-to-the-world products, however, observation is typically not possible and secondary data are not available, since the product often does not exist yet, except in concept form. Market tests, discussed later, are one way to get real purchase data about new-to-the-world products.
Surveys
Another common way to forecast sales or estimate market potential is to conduct surveys. These surveys can be done with different groups of respondents. Consumers, after being shown a statement of the product concept5 or a prototype or sample of the product, can be asked how likely they are to buy it. Buyers can also be asked about their current buying behaviour: what they currently buy, how often or how much they use. The salesforce can be asked how much they are likely to sell. Experts of various kinds – members of the distribution channel, suppliers, consultants, trade association executives and so on – can also be surveyed.
There are important limitations of surveys, however.
- What people say is not always what people do. Consumer surveys of buyer intention are always discounted heavily to allow for this fact. For one common approach to doing so, see Box 16.1.
- The people who are surveyed may not be knowledgeable, but if asked for their opinion they will probably provide it.
- What people imagine about a product concept in a survey may not be what is actually delivered once the product is launched. If consumers are asked whether they will buy an ‘old-world spaghetti sauce with home-made flavour’, they will surely provide a response. Whether they will actually like the taste and texture of the sauce that the lab develops is another story.
box 16.1
A survey of buyers’ intentions: what people say is not what they do
When Nestlé’s refrigerated foods division in the USA was considering whether to acquire Lambert’s Pasta and Cheese, a fresh pasta maker, it wanted to forecast the likely first-year sales volume if the acquisition were completed. To do so, Nestlé used a concept test in which consumers were asked, among other things, how likely they were to try the fresh pasta product. The results were as shown in the first two columns in the table below.
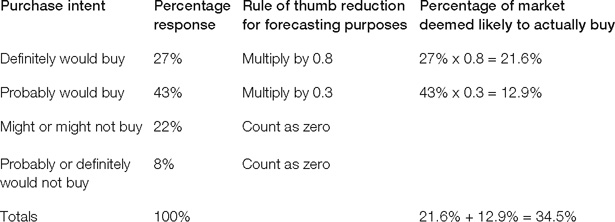
Even though 70 per cent of consumers surveyed indicated they were likely to buy, Nestlé’s experience indicated that these ‘top two box’ percentages should be cut sharply: ‘Definitely’ responses were reduced by 20 per cent, while ‘Probably’ responses were reduced by 70 per cent. ‘Maybe’ responses were considered as ‘No’. These adjustments, shown in columns three and four, reduced the 70 per cent figure by more than half, to 34.5 per cent. Most consumer product manufacturers who employ concept tests use similar rules of thumb when interpreting purchase intent data for forecasting purposes, because they have learned that what people say they will buy exceeds what they will actually buy. Similar logic is useful in a variety of forecasting situations.
Source: Based on Marie Bell and V. Kasturi Rangan, 1995, Nestlé Refrigerated Foods: Contadina Pasta and Pizza, Harvard Business School Publishing, Boston, MA.
In general, statistical and observational methods, where adequate data or settings are available in which to apply them, are superior to survey methods of forecasting, because such methods are based, at least in part, on what people have actually done or bought (e.g. the number of old cars actually on the road), while survey methods (‘Are you likely to buy replacement tyres this year?’) are based on what people say, a less reliable indicator of their future behaviour.
Analogy
An approach often used for new product forecasting where neither statistical methods nor observations are possible is to forecast the sales or market potential for a new product or new venture by analogy. Under this method, the product is compared with similar products that were introduced earlier, for which historical data are available. When Danone, the French marketer of yogurt, plans to introduce a new flavour of packaged yogurt, its managers will likely look at the sales history of earlier introductions to forecast the sales for the newest flavour. This method is also used for new-to-the-world high-technology products, for which product prototypes are often either not available or are extremely expensive to produce.
Rather than conduct surveys to ask consumers about their likelihood of buying a product they can hardly imagine (what would someone have said in 1978 about their likelihood of buying a personal computer?), forecasters consider related new product introductions with which the new product may be compared. When Apple was considering the launch of its iPod, it took note of the fact that Sony had sold some 300 million Walkmans.6
As always, there are limitations. First, the new product is never exactly like that with which the analogy is drawn. A Sony Walkman was, to be sure, a portable music device. But it was quite different from what Apple was planning its iPod to be. Second, market and competitive conditions may differ considerably from when the analogous product was launched. Such conditions need to be taken into account.
Judgement
While we hesitate to call this a forecasting method of its own, since capable and informed judgement is required for all methods, forecasts are sometimes made solely on the basis of experienced judgement or intuition. Some decision-makers are intuitive in their decision processes and cannot always articulate the basis for their intuitive judgements.
Said a footwear buyer at Nine West Group, ‘Trend forecasting is a visceral thing that cannot be trained. I rely on my sense of colour and texture, but at times I cannot explain why I feel a certain way . . . I just know.’7 Those with sufficient forecasting experience in a market they know well may be quite accurate in their intuitive forecasts. Unfortunately, it is often difficult for them to defend their forecasts against forecasts prepared by evidence-based methods when these forecasts differ. Nonetheless, the importance of experienced judgement in forecasting, whether it is used solely and intuitively or in concert with evidence-based methods, cannot be discounted.
Market tests
Market tests of various kinds are the last of the commonly used forecasting methods. Used largely for new products, market tests may be carried out under controlled experimental conditions in research laboratories, on the Internet or in live test markets with real advertising and promotion and real distribution in real stores. In one sense, market tests are what lean start-ups are all about, albeit on a very small scale. In large companies, though, use of test markets has declined over the past few decades for three reasons:
- they are expensive to carry out, since usually significant quantities of the new product must be produced and marketing activities of various kinds must be paid for;
- in today’s data-intensive environment, especially for consumer products sold through supermarkets and mass merchants, competitors can buy the data collected through scanners at the checkout and learn the results of the test market without bearing the expense to conduct it;
- competitors can engage in marketing tactics to mislead the company conducting the test, by increasing sampling programmes, offering large discounts or buy-one-get-one-free promotions, or otherwise distorting normal purchasing patterns in the category.
The coming of the Internet has made possible a new kind of market test: an offer directly to consumers online. Offers to social networks, interest groups or email lists of current customers are some of the approaches that have been tried. Entrepreneurs’ use of such techniques will likely continue to increase, due to their ability to carry out such tests quickly and at low cost.
Mathematics entailed in forecasting
Regardless of the method used, the ultimate purpose of forecasting is to generate numbers that reflect what the entrepreneur believes is the most likely outcome – or sometimes a range of outcomes, under different assumptions – in terms of future market potential or for the sales of a product, a product line or a new venture. The combination of judgement and other methods often leads to the use of either of two mathematical approaches to determine the ultimate numbers: the chain ratio calculation or the use of indices. Boxes 16.2 and 16.3 offer examples of how to apply these mathematical approaches to arrive at sales forecasts.
box 16.2
Chain ratio forecast: trial of fresh pasta
Once Nestlé’s research on fresh pasta had been completed (see Box 16.1), it used the chain ratio method to calculate the total number of households that would try their fresh pasta. The chain ratio calculation went like this.

Similar chain ratio logic is useful in a variety of forecasting settings.
Source: Based on Marie Bell and V. Kasturi Rangan, 1995, Nestlé Refrigerated Foods: Contadina Pasta and Pizza, Harvard Business School Publishing, Boston, MA.
box 16.3
Estimating market potential using indices
In many developed countries there are published indices of buying behaviour, including the ‘Annual Survey of Buying Power’ published by Sales and Marketing Management, for the USA. The buying power index (BPI) is a weighted sum of a geographical area’s percentage of national buying power for the area, based on census income data (weight 0.5), plus the percentage of national retail sales for the area (weight 0.3), plus the percentage of national population located in the area (weight 0.2). If this calculation comes to 3.50 for a given state or region, one might expect 3.5 per cent of sales in a given category (toys, power tools or whatever) to come from that geographical area.
Category development indices (CDIs) are similar indices that report the ratio of consumption in a certain category (say, restaurant sales) to population in a defined geographical area. Trade associations or trade magazines relevant to the category typically publish such indices. Ratios greater than 1.0 for a particular geographic area, say metropolitan Manchester, indicate that the area does more business than average (compared to the country as a whole) in that category.
Brand development indices (BDIs) compare sales for a given brand (say, PizzaExpress restaurants) to population. Companies that use BDIs typically calculate them for their own use. The ratio of the BDI to the CDI for a given area is an indicator of how well a brand is doing, compared to its category overall, in that area.
These various indices are useful for estimating market potential in defined geographic areas. They are, however, crude numbers, in that they do not consider differences in consumer behaviour from region to region. The CDI or BDI for snowmobiles in Austria is far higher than in Spain, for example. Attempting to rectify this imbalance by increasing the snowmobile advertising budget in Spain would be difficult!
Note that both mathematical approaches begin with some kind of an estimate of market potential (the number of households in the target market in Box 16.2; the national market potential for a product category in Box 16.3). The market potential is then multiplied by various fractional factors that, taken together, predict the portion of the overall market potential that one firm or product can expect to obtain. In Box 16.2, which shows the more detailed of the two approaches, the factors reflect the appeal of the product to consumers, as measured by marketing research data, and the company’s planned marketing programme.
Cautions and caveats in forecasting
Keys to good forecasting
There are two important keys to improving the credibility and accuracy of forecasts of sales and market potential. The first of these is to make explicit the assumptions on which the forecast is based. This way, if there is debate or doubt about the forecast, then the assumptions can be debated and data to support the assumptions can be obtained. The resulting conversation is far more useful than stating opinions about whether the forecast is too high or too low.
The second key to effective forecasting is to use multiple methods. Where forecasts obtained by different methods converge near a common figure, greater confidence can be placed in that figure. Where forecasts obtained by multiple methods diverge, the assumptions inherent in each can be examined to determine which set of assumptions can best be trusted. Ultimately, however, entrepreneurs should remember that any forecast is almost certainly wrong. Contingency plans should be developed to cope with the reality that ultimately unfolds. A key challenge for manufacturers is to be able to quickly adjust production schedules to adapt to demand that differs from the forecast.
Biases in forecasting
Entrepreneurs should recognize several sources of potential bias in the forecasts they make. First, forecasts often fall prey to what Dan Lovallo and Daniel Kahneman call the planning fallacy, a tendency to base forecasts on delusional optimism rather than on a rational weighting of possible gains and losses and their probabilities. They suggest, as an alternative, the systematic use of multiple analogues, using the actual outcomes of other similar offerings, laid out from best outcome to worst, then positioning the proposed project in that distribution.8
Second, capacity constraints are sometimes misinterpreted as forecasts. Someone planning to open a car wash that can process one car every seven minutes would probably be amiss in assuming sufficient demand to actually run at that rate all the time. A restaurant chain that is able to turn its tables twice each night, on average, must still do local market research in order to ascertain how much volume a new restaurant will really produce. Obviously, putting similar 30-table restaurants in two different trade areas with different population make-up and density with different levels of competition will result in different sales levels.
Finally, unstated but implicit assumptions can overstate a well-intentioned forecast. While 34.5 per cent of those surveyed (after adjustments, as shown in Box 16.1) may indicate their willingness to buy a new grocery product, such as fresh pasta, for such a forecast to pan out requires that consumers are actually made aware of the new product when it is introduced, and that the product can actually be found on supermarket shelves. In forecasting the likely sales of consumer goods and others to be marketed through distribution channels, entrepreneurs should not assume 100 per cent awareness and distribution coverage. Actual awareness and distribution levels should be estimated based on the planned marketing programme for the product and factored into the forecast via the chain ratio method (see Box 16.2). The difficulty in doing so with any degree of certainty is one of the reasons why many investors in early-stage companies view forecasts built in a bottom-up fashion, or those based on close analogues, as more credible than other approaches.9
If you’ve been using your The New Business Road Test app while reading this book, you may want to make note there of the forecasts you prepare. Your forecast of market potential will be useful for assessing the macro-market domain. Your forecast of your sales in the first or early years will be useful in considering the economic sustainability of your business model in the micro-industry domain.