Debugging Setup, Requirements, and Parameters
TOAD contains a powerful debugger that enables you to traverse code, view variable content, start or stop execution of code, and step in/out of called procedures. This is known as symbolic debugging.
You must have a valid Quest Software license key to use the debugger. To check the options available in your version of TOAD, click on Help, About and make sure Debugger appears in the Options line; see the mouse cursor position in Figure 4.45. To add a license key, click on Help, Register TOAD.
Figure 4.45. TOAD license options.
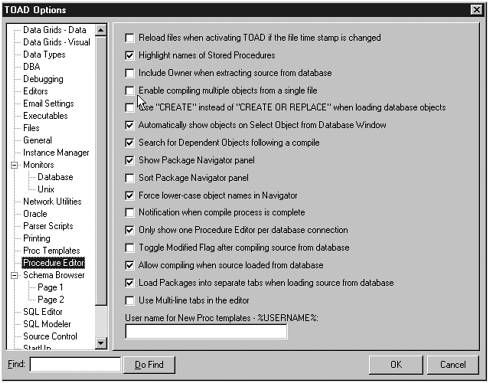
There are also some important settings to enable the debugging feature. In the TOAD Options screen, under the Procedure Editor category, make sure that Enable Compiling Multiple Objects from a Single File is NOT checked on, as illustrated in Figure 4.46.
Figure 4.46. TOAD Options settings for debugging.
TOAD relies upon the Oracle Probe API to get the debug information. Run the Oracle Probe API Version script in a SQL Editor window as seen in Figure 4.47. TOAD requires this API to be at least at the level of 2.2 (major=2, minor=2).
Figure 4.47. Oracle Probe API Version.
|
| This script as well as the Temperature scripts are available on the Web site for this book. |
|
| If you are using TOAD against an Oracle 7 database, make sure that BLANK_TRIMMING is set to TRUE in the INIT.ORA parameter file for the call stack to display properly. |