11
Transportation and Freight Management1
“Accessibility is the ultimate goal of most transportation and so is the best approach to use
—Todd Litman
Chapter Objectives
To understand:
- Freight management
- Factors impacting freight cost
- Transportation network
- Containerization

Freight Management
Transportation is an enabler to movement of products from one location to another. The movement starts at the beginning of a supply chain (i.e., suppliers) to the end of supply chain (i.e., customers). Transportation is the most visible element of logistics operation. It has significant share in logistics cost of the organization. It needs a thorough planning exercise to control it. Managing transportation cost presents many challenges. Hence, supply chain's success is closely linked to the appropriate use of transportation strategy. Transportation decisions should ensure that a firm's transportation strategy supports its competitive strategy.
In Practice…
Cargo Movement by Sea-Air Mode—A New Concept
With the change of the global scenario and to meet the logistics needs and challenges of the shippers and consignees. The NVOCC (non-vessel operating common carrier) companies were introduced which later came to be known as ‘multimodal operators’, who created SCM with new concepts to meet these requirements associating themselves with liner shipping companies who normally prefer catering port to port shipments.
In this logistic change was born what is known as the ‘sea-air movement’. This clearly means that a commodity moves from one port to another by two modes of transport, that is, making use of the SCM in multimodal transport. This proved to be a concept, which was able to meet the shipper/consignee deadlines not only with on-time deliveries but also at economical rates. The reason being, if it was moving by sea then it is slower but costs much cheaper and if it was moving through air, then it was faster but expensive. This proved to be disadvantageous for movement of textiles, automotive parts, high tech, leather items, etc.
The movement of cargo from the Far East and the South East to the United Kingdom and the United States had its own challenges with each customer having his own unique requirements. The new concept evolved was able to meet this challenge and proved to be 30–40 per cent cheaper. The sea-air cargo will always be the last to be loaded and first to be unloaded to reduce shipment time and lower the cost. Dubai became the main hub for this trade and all major logistics company set their offices there. A cost comparison will give an idea as to how this works out cheaper when compared to only air mode.
There is a consignment of 1,000 kilos of automotive parts to be moved from Mumbai to London. In the first case, moving by air mode (with cheapest airline) the costing will be Rs 1,55,000. The cargo is to be kept ready and delivered at the airport 24 h before the departure of the flight. In the second case, movement by sea-air mode for 1, 000 kg equals to 3 cbm; the freight cost from Mumbai to Dubai by sea is zero using services of NVOCCs. The other charges by local transport, handling and CHA equals to Rs 7, 250. Air freight from Dubai to Heathrow airport is Rs 70, 000. Hence, the total freight is Rs 77, 750. Since Dubai is the hub and volume cargo is always available the freight rate comes down. Today due to competitive market, Mumbai to Dubai is going on minus freight and shippers get a refund of $20 per cbm from shipping companies. Therefore, it can be seen that sea-air mode has caught up with many of the shippers in this part of the world as it saves cost and time. The mode is well protected throughout by insurance companies.
INTRODUCTION
Transportation ensures the movement of people as well as goods (manufactured or produced) from one place to another and helps in growth of trade and commerce of the country. A good transportation system is one of the pillars of the whole structure of the industry and commerce in the country.
Along with the growth of industry and commerce, the transportation system has achieved economic and social objectives. The modes of transportation are changing as per the needs of the time and it is keeping pace with the growth of science and technology across the world. However, the degree of sophistication in modes of transportation equipments varies with level of economic condition and growth of the particular region or nation. The transition from subsistence farming to commercial farming and growth of manufacturing activities widened the scope of development of transportation mode.
The result was development of four modes of transportation, that is, road, rail, air and water. The simultaneous upgradation of infrastructure took place which supported the transportation modes to achieve speed in movement. Even with the availability of sophisticated modes of transportation, the older modes still continued to serve the society though on a smaller scale.
In pre-independence India, the transportation system was mainly comprised of roads and railways, which was developed for smooth administration by the British government for communication with major ports and cities keeping in view the administrative, strategic and trade imperatives of the government ruling then. However, the focus changed after the independence to development of railways and road infrastructure to support the developmental needs of Indian economy and society. Later, slowly the seaports and airports were developed to support the industrialization in the country.
TRANSPORTATION INFRASTRUCTURE
In the movement of raw materials or products from the place of production to the place of consumption, transportation is the most important component of the logistical activity in the supply chain system. The transportation serves two purposes: one is the product movement and the second is the in-transit product storage. The movement of the product can be achieved through various modes such as road, rail, air, sea subject to the availability of and access provided by the infrastructure. The other function of transportation, that is, in-transit storage is not cost effective for a longer period of time. The guiding principle for choosing the transportation mode is the least cost per unit weight/volume of the product moved over the unit distance. However, selection of a particular mode is dependent on the availability of transportation infrastructure in the region.
In India, 60 per cent of the total cargo movement is done through road followed by rails which contributes 30 per cent of the movement; the remaining 10 per cent is shared by inland water, air and sea.
Road
Road transport is one of the promising means for agricultural and industrial advancement of the country. It is suitable for short and medium distances where other means are unable to reach. It provides door-to-door service, which is not possible by other means. Road transportation provides the basic infrastructure to bring the trade and commerce from remote rural areas to urban areas or vice versa and brings far-off villages into mainstream national life ensuring connectivity. With the manyfold growth in industrial and agricultural activities and the outputs, road transport has assumed greater importance due to growing demand for making available the right product at the right place of consumption. Today road transportation is occupying a predominant position in the transport network in the country. Road transportation offers a number of advantages which are as follows:
- Door-to-door service
- Flexibility
- Reliability
- Reach to remote places
- Speed
As far as the trucking industry in the country is concerned, it is predominantly in the unorganized private sector and bulk of truck operators are single truck owners. The operators face many irritants, like levy of multi-point octroi, traffic police checks, which impedes the free flow of goods traffic. Currently 7.0 million trucks are plying on Indian roads. The Indian road conditions not being good, the average distance travelled by truck is 250–300 kilometres per day as against 550–600 kilometres by their counterparts in developed countries. The average operating cost of the Indian truck is Rs 1.7–1.9 per km-per tonne. The major domestic cargo traffic in the country is moved on national and state highways spreading over to 34, 850 kilometres and 137, 120 kilometers length, respectively. The national highways carry nearly 40 per cent of total road traffic in India. Out of the total national highways, 2 per cent of their length is four lanes, 34 per cent is two lanes, and 64 per cent is single lane. The share of national and state highways in total roads in the country is 1.42 and 5.56 per cent, respectively, which is grossly inadequate. However, India is better placed in per capita road availability compared to Brazil, Indonesia, China, Hungary as per the road index computed by Cooper and Lybrand—India 0.58, Brazil 0.47, Indonesia 0.47, Hungary 0.41, China 0.29 and Mexico 0.27.
Railways
Railways are the principal carriers of men and material and play a major role in country's trade and commerce activities. It is a main source of supply of essential commodities, by transporting through the length and breath of the country. Across the globe, the railways have played an important role in industrialization and development of nations. It was the primary means available for movement of raw material and the finished goods and all countries in the initial stages of industrialization and development have heavily relied on railways.
The Indian Railways (IR) are operating through the network of 6, 896 railway stations across 62, 800 kilometres of route length with the route density of 138 km per 1000 sq mt of area, of which are 44, 200 km is broad gauge lines which account for 85per cent cargo movement by rail. Goods movement is done through 253, 186 wagons with total carrying capacity of 10.6 million tonnes. The IR's 96 per cent of cargo consists of bulk items such as coal, iron ore, cement, fertilizers, raw materials for steel plants, finished steel products and petroleum. Bulk cargo is transported through the railways because of cost advantage over other modes. In 2009–10, Indian railways handled 833 million tonnes of freight traffic on the above network.
To handle the increased domestic and international trade, Indian Railways have introduced the container service and goods trains to carry the box containers way back in 1967. Today IR is handling 2.5 million TEU (tonnes equivalent units of 20 ft container) of box container traffic. To increase the share of rail traffic, IR is tying up with national road carriers to provide door-to-door service to their strategic clients. The Konkan Railways have introduced a unique scheme of transporting the complete trucks loaded with cargo to the destination. This will save precious fuel which other wise would have been used by the number of trucks carrying the trainload of cargo. Road traffic may be relieved to some extent and air pollution by those trucks will be eliminated.
Sea
The shipping industry is divided into the following parts:
- Liner service
- Tramp shipping
- Industrial services
- Tanker operations
The shipping fleet across the world comprises of tankers, dry bulk carriers, container ships and special vessels. The tanker fleet accounts for 33 per cent of the total fleet while dry bulk carriers contribute 32 per cent of total in terms of million gross registered tonnes (grt).
India has 55 shipping companies, of which 19 are exclusively in coastal trade, 29 in overseas trade while remaining are in both. Indian shipping has very high dependence on international trade with 95 per cent of overseas cargo by volume and 77 per cent by value moving by sea. Crude oil, oil products, iron ores, coal, food grains and steel are some major products transported through sea.
In shipping, India ranks sixth in Asia and fifteenth in world merchant shipping trade. At present, Indian shipping industry comprises of 510 ships of which 240 are overseas fleet and 270 are coastal ships including 70 offshore support vessels and about 25 supply vessels for offshore services and 12 dredges. The Indian shipping companies (SCI and Essar) are slowly moving from ‘carrying business’ to become a complete sea logistics solution providers, thereby maximizing shareholders wealth through focus on energy (oil) transportation business and moving upward in the value chain by providing one stop integrated logistics solution and value addition by providing their client web-based logistics solutions.
In India, 95 per cent of international trade and 85 per cent of domestic sea trade is handled by 12 major ports. Indian ports handled around 272 million tonnes of both domestic and international cargo in 2009–10 through 12 major and 187 small ports. This sector will continue to play a major role in Indian economy as India's export is likely to grow by 15 per cent and imports by 14 per cent. There will be major imports of POL, LNG and LPG in the near future and these will require better storage and handling facilities at the Indian ports.
Air
Compared to all other modes of transport, air transport is less hazardous in nature. Air transportation is a costly affair and it is used only for highly respiring and transpiring commodities and items, whose life is short and value is high. Even though the cargo handled by air is growing at the rate of 15–16 per cent, it is insignificant as compared to cargo handled by other modes of transportation. The air cargo traffic is handled by 8 international airports, 87 domestic airports and 28 civilian airports (shared with defence). After the domestic air services were liberalized in 1994, there was a sudden increase in the number of air transport operators to 7 scheduled private operators and 22 non-scheduled operators for passenger and cargo movement. Within two years of post liberalization, the market share of private operators went up to 40 per cent. The air cargo traffic is concentrated around the gateway airports such as Mumbai, Chennai, Delhi, Kolkatta and Bangalore. These airports handle 87 per cent of air cargo traffic in India. Due to the prospect of increase in air-cargo traffic in India, the government is inviting private participation in air transportation and the related infrastructure (air ports) to take care of growing passengers and cargo traffic in future.
Inland Water Transportation (IWT)
IWT is a eco-friendly transportation mode. IWT can play a significant role in augmenting the country's transportation infrastructure. India has a potential of 145, 000 kilometres of inland water transportation infrastructure comprising of rivers, lakes, channel and it has recently started receiving attention from the government. IWT in many Western countries has already emerged as an alternative mode of transportation. Cargo movement through IWT in India is meagrel per cent as against 10–12 per cent in the United Kingdom, Europe and China.
With globalization of Indian economy and implementation of WTO directives in India, there will be greater movement of goods to and fro. This will create a heavy pressure on already burdened transportation system of rails and roads in India. There is limit to expansion of road capacity because of available land, high cost and environmental considerations. The IWT is cost-effective as compared to road and rail infrastructure. A kilometre of highway construction can cost Rs 6 crores, while more than 100 kilometre waterways can be developed in the same cost at the current rate. As per the estimates, if Re 1 is spent for IWT development, the corresponding cost for development of roadways and railways would be Rs 2 and Rs 5, respectively. In case of energy conservation the ratio would be 1.5 and 4, respectively.
There are some hazardous commodities, which should not be allowed for transportation on road. In view of the above constraints and the advantages, the development of IWT has become relevant in today's context. The major advantage of IWT is doubling of load capacities for a small increase in depth and thereby providing an ageing flexibility and cost elasticity, which does not exist in other modes of transportation. Besides lower fuel consumption and construction cost, IWT has the advantage of ensuing minimum human loss against the very frequent accidents occurring in case of road and railways.
Pipelines
Pipeline as a mode of transportation was first developed by Samuel Van Syckel in 1870 to transport petroleum. Twenty years later, Standard Oil Company changed the face of transportation. Though petroleum was the first product transported in this mode, pipelines later became useful for several other commodities such as coal in slurry form, iron ore fines in slurry form, chemicals, natural gas, etc. The basic advantage of pipelines is that they reduce the operational cost, though the initial investment is high. In India, pipelines are used for oil transportation by all public and private sector petroleum refineries. For iron ore transportation, they are used by Kudremukh Iron Ore Project to transport iron ore over 67 kilometre distance along difficult terrains in the Western Ghat.
Pipeline is an eco-friendly transportation mode. The cost of moving oil by rail or road continues to rise over the years; however, pipeline heads towards downtrends. The transportation cost of moving oil is Rs 1.15 per tonne per kilometre on a new pipeline while it is Rs 0.87 on a depreciated pipeline. At the current rate, transportation of oil by road costs Rs 2.50 per tonne per kilometre and by rail costs Rs 2.00 per tonne per kilometre. Although laying of pipeline costs Rs 15 millions per kilometre.
Currently, 27 per cent of the petroleum products (petrol, kerosene and diesel) are moved by pipelines of 6, 350 kilometre length in India, while in the United States 59 per cent via 180 pipelines and another 35 per cent via barges along the Pacific and Atlantic coast. Today in India, pipeline moves 58.7 million tonnes of oil per annum which is expected to rise to 85–90 million tonnes by 2015.
Ropeways
In India, more than 16 per cent of the geographical area is hilly. Communication to such areas is a problem because of the long circuitous routes. The transportation of goods and essential commodities to the hilly area is some times important because of their strategic location from the defence point of view. In view of oil shortages, ropeways can prove more economical and faster than road transport, particularly in hilly areas. The ropeways have the following advantages:
- Ropeways cause least damages to the ecology.
- Inaccessible hilly areas can be reached with shortest distance.
- Other modes of transportation are uneconomical.
- Bulk material can be moved faster over short distance.
This mode of transport is used in hilly areas in Sikkim, Meghalaya, Mizoram, Himachal Pradesh and Uttar Pradesh. Currently 175 kilometres of ropeways are in use in the above territory for transportation of both materials and human beings.
FREIGHT MANAGEMENT
Freight transport management includes various strategies for increasing the efficiency of freight and commercial transport. Logistics is a technical term for efficient freight management, including shipping practices (e.g., vehicle type, shipment size, frequency, etc.), facility visiting, and related activities. Logistics usually focuses on minimizing shipper costs, with little consideration for social cause such as congestion or pollution impacts. In general, transport management activities cover the following:
- Using transportation modes with lower social costs, such as rail and water transport rather than truck for longer-distance shipping as trucking uses much more energy per unit of transport than rail or water.
- Improve scheduling and routing to reduce freight vehicle mileage and increase load factors (e.g., avoiding empty trips).
- Organize delivery systems so fewer vehicle trips are needed to distribute goods by using load consolidation.
- Reduce total freight transport by relying on local products from facilities closer to their destination markets.
- Practice fleet management programmes that reduce vehicle mileage, use optimal-sized vehicles for each trip, and insure that fleet vehicles are maintained and operated in ways that reduce external costs (congestion, pollution, crash risk, etc.).
- Encourage minimizing excessive packaging and unnecessary delivery frequency, and relying on more local suppliers.
- Encourage efficient freight transport equipments.
- Improve vehicle operator training to encourage more efficient driving.
The selection of transportation mode depends on the characteristics of the product and customer service requirements. For example, the raw materials are invariably transported in bulk and through cheaper mode of transportation like rail or sea. The unit value being less, the transportation cost, as percentage of the value of material being transported is very high. Hence, freight reduction through scale economics becomes necessary. However, in case of high-value items, the deliveries required are faster and in smaller consignments with reliability. In this case, the unit product value being high, the transportation cost as a percentage of the product value is not so significant. Hence, faster and costly modes of transportation such as road or air are preferred.
For logistics management, cost, speed and reliability are the most important factors to select amongst the available transportation options based on the characteristics of products.
Speed and Availability of Service
The speed of the service is the elapsed time to move products from one facility to another and finally to the customer which is often more important than the cost of the service. The slower modes of transportations involves lower transportation cost, they result in lower service levels. The availability depends on the existing transportation infrastructure and the ability of mode to serve the given pair of locations. This sometimes becomes major constraint in speedy delivery. It necessitates the usage of inter-modal transportation.
Reliability
This means ability of the carrier to deliver the shipment in good condition, within the stipulated delivery time frame to the customer.
Capability
It is the ability of the carrier to accommodate the cargo in size, weight and quantity for transportation to the destination. This is very important for transporting the odd size and heavy products over longer distances. In such cases, special trailers are required for product movement. The cost of transportation goes up in such cases. Along with transportation mode, the other considerations are availability of special material handling equipments.
Frequency
This refers to the number of schedule movements of the carrier between a pair of locations. Pipelines are preferred for movement of liquid products because of their continuous operations. However, for solid products road carrier is the best option.
The transportation decisions are dependent on a number of other factors like unit value of the product, predictability of demand, saving in transit time, cost of transport mode, its impact on inventory cost, and the desired level of customer service. The selection of modes and carrier type is done on the basis of delivery time, delivery reliability, freight rate, etc.
FACTORS INFLUENCING FREIGHT COST
The logistics manager has to achieve objectives of freight cost reduction, speed and reliability in delivery. However, the freight cost is influenced by the following factors.
Volume
With the economies of scale, the cost of operations is distributed over the large volumes resulting into the lower per unit cost of cargo movement. For example, a 9 tonne loading capacity truck will have same cost components of fuel consumption, loading and unloading charges, employee cost, etc. for the distance covered, irrespective of whether truck is fully or partially loaded.
Distance
The variable cost is directly proportional to the distance covered by the vehicle irrespective of the load carried. It includes fuel and maintenance cost. However, the relationship is not linear because the fixed cost element such as employee wages, loading and unloading charges are fixed irrespective of the distance travelled.
Product Density
The freight cost depends on the weight per unit volume of the product. It includes two variables of weight and volume. A 2-axel 9 tonnes capacity truck has a limitation on the volume for low-density products such as cotton bales, wood, plastics, etc. In such cases, the freight cost per unit weight assessed is relatively higher.
Similarly for high density products the limitations are on the weights, which should not exceed the allowable payload of the vehicle. In such cases, the truck is party loaded with respect to the available loading space on the vehicle.
Product Shape
The size and shape of a product pose difficulty in handling and affect the speed of its movement. Such products require special arrangement for loading, unloading and towing. For such heavy payloads, vehicles with long trailer are deployed for movement. The operating charges for such special vehicles are obviously much higher because of higher operating cost, slow movement of the vehicles and in special cases escorts are deployed to accompany them. The large size chemical processing steel vessels, heavy-duty electrical transformers, long and odd shaped steel products attract higher transportation charges.
Product Handling
For handling heavy as well as odd-shaped cargo, special material handling equipments are deployed. These equipments are not available at loading or unloading points because of very low frequency (at the time of project installations only) of usage. Hence, these equipments have to be specially organized. This adds into the unit transportation charges of the product.
Product Type
Products such as fruits, food products, certain pharmaceutical formulations require special temperature and humidity condition for storage and transportation. These products need to be transported through refrigerated vehicles costing double and having operating cost three to four times more than that of a normal vehicle. The products are susceptible to explosion, evaporation, damage or theft require special transportation arrangement such as specially constructed vans or box containers. These products attract additional transportation charges.
Market Dynamics
In the Indian context, goods transportation business is in the hands of transport agents. The rates are fixed by the agents and not by the truck owners, except in case of very large fleet owners who operate across the country through their marketing infrastructure. However, depending on the demand and supply of trucks for cargo movement to particular destination, the freight rates are fluctuating. Even if more vehicles are available, there is a cut throat competition amongst the truck operators to get the business and the rates charged are sometimes below normal cost. For odd and problem routes the rates are on the higher side to cover the risk.
TRANSPORTATION-RELATED PROBLEMS IN SC
There are two perspectives of transportation and which give rise to the problems in supply chain design and operation. The first one is the shipper's perspective. The shipper always wants to balance inventory, facility and transportation costs while maintaining an excellent service level in the operations of the supply chain. The second one is the carrier's perspective, which calls for maximize profit by making best use of the available transportation capacity. From service providers’ point of view, it includes costs, which covers, capital costs, maintenance cost, terminal-related: land/rent, equipment, personnel cost, fleet operational costs, trip-related (fuel, drivers, wear and tear) cost, freight handling cost and overhead covering planning and scheduling, customer service, etc.
Freight charging patterns for common carriers is another issue in transport-related problem. The rate varies in relations to the shipment size LTL (less than truck load), minimum total rate for quantities below a minimum threshold, several weight categories with different rates and time-volume rates. The other one is related to distance such as uniform rates, proportional rates, combination of fixed rate plus variable rate per distance (truckload rates), tapered rates (increase with distance) and blanket rates (constant rates for certain intervals of distance for certain time period), etc. The supply chain operations need to be planned in advance taking note of the above aspects.
TRANSPORTATION NETWORKS
The movement of goods from the point of production to the point of consumption is done through various modes of transportation. Different types of networks are in use depending on the transportation load, number of delivery points, existing distribution centres, product value, frequency of delivery, urgency and the cost economics.
Point-to-Point Network
This type of network is quite common for long distance hauls on the national highways. The point of origin and destinations are fixed. Full truck loading is assured both the ways (Figure 11.1).

Multiple Delivery Points
This network is used for round-the-trip operations, with multiple pick up and delivery points. For example, the delivery of filled bottles and pickup of empty bottles of soft drinks at multiple points (retailers) on the fixed route (i.e., starting and ending at bottling plant) is quite common (Figure 11.2).

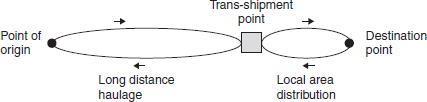
Trans-shipment Points
The two local area networks (across national and state highways) having a common point where the loading and unloading takes place for freight consolidation or break bulk. The most of the national transporters maintain two types of fleet: vehicles dedicated for national long distance haulage and other one for catering to local network. The consignment from long distance fleet is trans-shipped to local vehicles for distribution across the local areas (Figure 11.3).
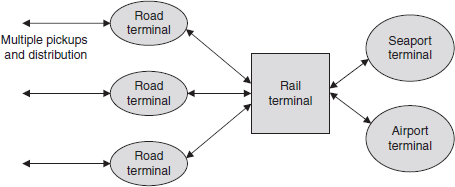
Nodal Network
These networks are used for multi-modal transportation system and include multi-stop and transshipment pickup and delivery stations. For example, a box container truck may have predetermined multipoint pickup stations for freight consolidation on its way to rail terminal where from the box container may be taken to port terminal for loading onto the ship (Figure 11.4).
Hub-and-Spoke Network
The network arrangement is like a hub and spoke (Figure 11.5) of the wheel. The hub acts like a central feeder point to the distribution centres, which are at the strategic locations spread across the geographical area. The high volume and high-speed shipment takes place from the hub to the distribution centres through the predetermined shortest routes called spokes. The trans-shipment of consignment is done at distribution centres for distribution across the local area.
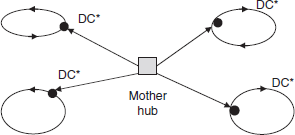
This arrangement optimizes the number of distribution centres in the network and ensures reduction in inventory and improvement in customer service.
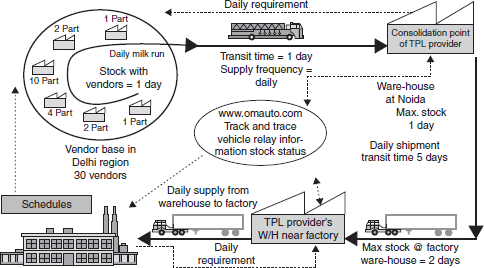
MILK-RUN
In logistics the vehicle picks-up the material from vendor (s) and delivers to the factory/customer(s). This needs to be planned if the vehicle has to pick up inventory in small quantity from various vendors, who are on the route. This is similar to milk being collecting by a tanker-van en-route from various farmers at different point of time from different locations during the day or milk packets are to be delivered to various destinations en-route. In inbound process after the tanker is full, the milk is delivered to the factory for further processing. The milk collection process is time bound. Any delay beyond 6–8 hours to reach to factory will initiate the milk to spoil.
In the business context, milk-run (Figure 11.6) is a tested and proven method of optimizing a ser vice provider's trucking operations in collection or dispatch activities. It is used in automobile industry for periodic collection of spare parts from a large number of vendors located in a particular industry cluster. Transportation within automotive spares today would require optimization in terms of cost and time. Milk-run can solve the problem of scheduling and dispatching vehicles in vehicle-based internal transport systems within warehouses and production facilities in automotive and electronic industries.
Milk-run is quite efficient and cost-effective where there is demand at multiple pick-up/delivery points for urgent services, hence there is the need to optimally prioritize. In milk-run the service provider using his vehicle to provide delivery/pick-up needs to optimize the routes. Milk-run is useful when precision electronics/automotive spares from certain manufacturing clients need to be urgently shipped on a JIT (Just-in-Time) basis to the next stage in the supply chain
In milk-run the nodal points of collection/distribution in a milk-run are established first. These might be collective pick-up/delivery points for the pick-up or delivery vehicles. The critical variables in milk-run design are distance, cost of delivery/pick-up, cycle-time and perishability of the product. At every point in a distribution network, milk-run calls for an optimization of the above variables. The service provider has to prioritize on the above variables. Factors to be considered during this practice are to increase vehicle capacity utilization, shortest routes and optimum transportation cost. The benefits derived with well designed milk-run system are lowering of logistics cost, reduced pick-up/delivery time, more customized services to the clients as delivery/pick-up priorities are gauged and executed and is easiest to adapt and execute among all routing methods.
ROUTE PLANNING
For the conservation of precious fuel and saving the transportation time, the route planning exercise is of utmost importance to the carrier owner. The route planning may be advisory or statutory. The advisory routes are those with less operational problems and the distance is the shortest. The cost of operation of the truck on the roads is the lowest. These are basically national or state highways connected to the markets and the traffic on such routes is large. These are very attractive to the truckers because of the immense opportunity for the return freight business. The statutory routes are those that legally prohibit truckers to use the route other than the designated ones. The statutory routes are designated for carrying the particular type of goods such as explosives, hazardous chemicals or inflammable goods. The other categories of routes are those used for high-productivity vehicles, high-speed vehicles or extra heavy vehicles. The statutory routes are common in developed countries and quite uncommon in India.
The main objective of route planning is to cover the distance between two points with shortest distance ensuring operating economy resulting into lowest transportation cost. To plan a route for a truck for multiple pickups and delivery points spread over the vast geographical area is a challenging task. The planning task becomes complicated in case of perishable commodity having short shelf life. Generating distance matrix, which is a one time exercise, and generating the route matrix with nodes for pickups and delivery can solve the problem. The other factor is the time of travel in case of perishable products.
CONTAINERIZATION
Containerization is making waves in the transportation of goods ensuring manyfold benefits to users, transport companies, and the country's economy. A container can be defined as a transport device to move solids, or liquid material. It is a case or a tank with adequate strength to be repeatedly used for packing and transportation of the material. The container can be used on several transport modes without material being stuffed, de-stuffed or trans-shipped.
Today containerization is an accepted trend in shipping for international and domestic trade. Initially containers were in use for sea transportation, but now are being profusely used in inland transportation. It was Malcolm McLean, owner of a huge trucking company in the United States, who conceived the idea of containers in 1956. The containerization in shipping started in the 1960s. The first container shipping named ‘Hawaiian Citizen’ for port management with a vision and strategic planning was developed by sophisticated handling facilities. The container traffic has grown in leaps and bounds, and more than 200 million TEU is estimated to be handled the world over in 2010. In 2009 the major ports in the world (Exhibit 11.2) handled 140 TEUs of container cargo. This is expected to grow to 417–491 million TEUs by 2015 with the largest growth being planned in Asia. Globally containerization is expected to grow at 5 per cent in the next 10 years and by 8–10 per cent in Asia.
Ports and shipping industry the world over have accepted that containerization is the future of shipping and has initiated projects to keep pace with the developments. The ship builders have already started building huge container carrier cargo ships with capacity of more than 6, 000 TEUs. The ports are also gearing up to meet these challenges. Some ports like Heliex, Canada, have already taken action to deepen the container birth to maintain the draft of at least 52 feet to receive ships with 8, 000 TEU and above. The containers used for movement of solid cargo are box type construction with side or top opening with twist locking system. These are normally water and air tight constructions using steel or aluminium alloy and are built as per ISO (International Standard Organization) standards having common sizes as indicated in Exhibit 11.1.
Exhibit 11.1 Sea Freight Container Dimensions
| 20 ft Dry | 40 ft Dry |
|---|---|
| Volume: 31 cum (1079 cu ft) | Volume: 67cum (2372cu ft) |
| 20 ft Dry High Cube | 40 ft Dry High Cube |
| Volume: 33 cum (1178 cu ft) | Volume: 76 cum (2675cu ft) |
| 20 ft Refer (Refrigerated) | 40 ft Refer (Refrigerated) |
| Volume: 23 cum (803 cu ft) | Volume: 58cum (2053 cu ft) |
| 20 ft Open Top | 40 ft Open Top |
| Volume: 32 cum (1116 cu ft) | Volume: 64 cum (2246 cu ft) |
| 20 ft Flat Rack | 40 ft Refer High Cube (Refrigerated) |
| Volume: 32 cum (1116 cu ft) | Volume: 62cum (2197cu ft) |
| 20 ft Open Side /Top | 40 ft Refer High Cube (Refrigerated) |
| Volume: 31 cum (1079 cu ft) | Volume: 69 cum (2419 cu ft) |
Source: http://www.concorindia.com
The container services in India were started in 1966 and initially containers with payload of 5 tonnes were introduced. The Indian Railways first started container service between Mumbai and Ahmed-abad in 1968. However, slowly the railway rakes were developed to adopt the large size containers of 20 ft and 40 ft length. Until 1988, the growth of container traffic was very slow. However in 1988, the Container Corporation of India (CONCOR) under the Ministry of Railways was formed to look after the container traffic in India.
This has resulted into speedier development of container handling (cranes, trailers, reach stacker, heavy duty fork lifts, side loaders) and movement (special railway rakes, container trucks) facilities in the country at various locations. The growth rate during the last few years, observed in container traffic in India was 18–20 per cent per annum. In 2010, CONCOR handled 2.20 million TEUs of container traffic. CONCOR has a monopoly position in container handling with 60 per cent share in inland container traffic. CONCOR has a network of 17 inland container depots (ICDs), 7 container freight stations (CFSs), 5 port side container terminals (PSCTs) and 10 domestic container terminals (DCTs) to handle the growing container traffic in the country. To take care of the container traffic, CONCOR has its own inventory of various sizes of containers and in addition, Indian Container Leasing Company in the private sector is engaged in leasing of containers to transporters and corporates. Exhibit 11.2 gives an idea of container traffic handled at major ports across the globe. As against this, all Indian ports, together, handled 6.5 million TEUs of container traffic.
Exhibit 11.2 Container Traffic Handled at Various Major Ports (2009) Across the Globe
| Port | TEUs (min) |
|---|---|
| Singapore | 25 |
| Shanghai | 28 |
| Hong Kong | 23 |
| Shenzhen | 21 |
| Busan | 12 |
| Dubai | 10.6 |
| Taiwan | 10.2 |
| Rotterdam | 9.8 |
SUMMARY
Transportation is the barometer which measures the economic, social and commercial progress of the country. It is the most visible element of logistics operation. It has a significant share in overall logistical cost of the firm and needs a great deal of planning to control it. In the movement of raw materials or products from place of production to place of consumption, transportation is the most important component of the logistical system. The transportation infrastructure of the country plays a vital role in the speedy movement of goods within and outside the boundaries of the nation. Transportation modes such as roads, rail, inland water, sea-air and rope play a major role in cargo movement and trade development of the country. The regulatory environment in the country should be supportive to the growth of the logistics industry and simultaneously enforce discipline amongst the industry operators. At a micro level, the freight management is crucial for cost controls. For a logistics manager, selection of transportation mode, carrier selection and route planning are the areas wherein his right decisions will result into an overall efficiency and effectiveness in supply chain. The transportation documentation supports the movement of the goods to reach the right place. The containerization is making waves in the transportation of goods ensuring manyfold benefits to users, transport companies and the country's economy. It facilitates the usage of multi-modal transportation and safe door-to-door transportation of the cargo.
REVIEW QUESTIONS
- ‘Decisions on transportation modes are crucial to organization’. Explain.
- What are the various factors affecting the freight cost?
- Discuss the different networks in transportation services.
- What is containerization and what is its role in logistics?
INTERNET EXERCISES
- Visit Texas Transportation Institute for more information on multimodal transportation, http://tti.tamu.edu
- Study various facets of ‘Transportation Lifecycle Management’ and its role in ‘Supply Chain Solutions’ at http://www.manh.com
- To understand on going trends in truck freight rates across various routes, lorry availability for a given period etc in India visit <http://www.tcil.com/irfi/index.asP≫
VIDEO LINKS
- Freight Optimization, http://www.logisticsbureau.com.au/video-supply-chain-logistics.htm
- Transport Tips, http://www.logisticsbureau.com.au/video-supply-chain-logistics.htm
PROJECT ASSIGNMENT
- Select any firm manufacturing the low unit-priced and mass consumed products like salt or cement and find out how they are organizing transportation-mix to achieve trade-off between cost and product availability.