CHAPTER 8
Inflation Protection
Inflation is as violent as a mugger, as frightening as an armed robber and as deadly as a hit man.
—Ronald Reagan
In 1978, when then–presidential candidate Ronald Reagan likened inflation to a mugger, it struck a nerve. Inflation was running at a 9 percent annual clip, on its way to nearly 15 percent two years later. Inflation was a harsh reality.
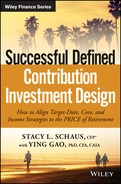
In 2016 as I write this book, inflation is tame, and the voices of monetary hawks have been drowned out. The modernization of banking over time now means there is a much lower likelihood that we could ever experience high single- or double-digit inflation as in the 1970s. Instead, the “mugger” is more likely to be a “stealthy pickpocket” that can significantly erode an individual’s purchasing power over time. But for retirees, who often depend on income that does not adjust with inflation, even relatively tame inflation—the stealthy pickpocket, not the armed robber—can be devastating. Consider: After 20 years of 3 percent annual inflation, $50,000 in retirement income would buy only about $27,000 worth of goods and services; with 5 percent inflation, the value shrivels to only about $18,000 (Figure 8.1 shows the impact of inflation on your purchasing power over time).

FIGURE 8.1 Inflation Can Cripple Purchasing Power in Retirement
Source: PIMCO.
Thus when it comes to investing for retirement, consultants concur: Inflation is one of the greatest risks, and inflation-fighting assets should be part of retirement portfolios. Given the long-term nature of retirement investing, it becomes clear why consultants worry so much about this risk and work hard to address it by recommending the use of inflation-related assets in participant portfolios. In fact, 84 percent of respondents to PIMCO’s 2016 Defined Contribution Consulting Support and Trends Survey support offering an inflation-hedging choice in a DC plan’s standalone core investment menu. Inflation-fighting asset classes can help portfolios in other ways, too—they may diversify risk from traditional stocks and bonds, and potentially reduce overall portfolio volatility and mitigate downside risk.
As discussed in Chapter 3, we consider inflation-hedging assets to be one of four primary risk pillars. In this chapter, we’ll take a closer look at the breadth of inflation-fighting assets available today, and we’ll present some evaluation methods for these important securities.
WHAT IS INFLATION AND HOW IS IT MEASURED?
Inflation is an increase in the price of goods and services. In the United States, a widely accepted measurement of inflation is the Consumer Price Index (CPI), a measure of the average change over time in the prices paid by urban consumers for a market basket of consumer goods and services. Calculated and reported by the U.S. Bureau of Labor Statistics (BLS), the broadest and most comprehensive CPI is called the “All Items Consumer Price Index for All Urban Consumers,” or CPI-U, and it reflects spending patterns for all urban consumers. (Most references to “CPI” are to the CPI-U index.) This index is made up of goods and services such as housing (37 percent), food and beverages (15 percent), transportation (12 percent), and medical care (9 percent) (all percentages are as of December 31, 2015, according to the BLS), while the “all urban consumer group” represents about 87 percent of the total U.S. population, including professionals, the self-employed, the poor, the unemployed, and retired people, as well as urban wage earners and clerical workers. As Figure 8.2 shows, the changing CPI over time means that “price of a dollar” has risen steadily in the United States since the end of World War II.

FIGURE 8.2 The Rising Cost of a Dollar over Time
Source: Bloomberg Finance L.P., as of December 31, 2015.
In addition to the All Items CPI (CPI-U), BLS publishes thousands of other consumer price indexes. CPI-U is often referred to as “headline” or “top line” inflation as it tends to get the most attention in the media, yet often considered more valuable is “core inflation,” which is measured by an index called “All Items Less Food and Energy.” Some users of CPI data use this index because food and energy prices are relatively volatile, and these users want to focus on what they perceive to be the “core” or “underlying” rate of inflation. Core inflation is thought to be an indicator of underlying long-term inflation.
In effect, no matter which index you select, inflation shrinks the value of your money. The dollar you invest today will be worth less tomorrow, posing a serious threat to investors. For bondholders, inflation is a particular concern, as it can erode the purchasing power of future interest and principal payments.
WHY INFLATION PROTECTION IN DC?
The intuition behind retirement investors’ need to consider inflation protection in their portfolios is quite apparent when considering the ultimate purpose of the assets. Specifically, retirement investors are saving to support a portion of their consumption needs in retirement; essentially, these needs include a basket of goods and services that permits them to maintain an equivalent lifestyle to their working years. This basket of goods and services may contain things like rent (or the equivalent), food, gasoline, movie tickets, medical services, and so on. While consumption patterns may vary by individual, the Consumer Price Index, or CPI, measures the U.S. national average and provides a useful guide to contemplating inflation-related asset portfolios.
HISTORY OF INFLATION: INFLATION SPIKES UNDERSCORE NEED FOR INFLATION-HEDGING ASSETS
Many readers may recall the high inflation period of the 1970s. Throughout history, there have been many more periods of high inflation. Over the past century, hyperinflation also hit post-World War II Europe. The history of inflation in the United States is shown in Figure 8.3. As you can see, inflation, when it occurs, may strike quickly and unexpectedly . . . but also creeps along in the background even when no spikes are occurring. This dual reality underscores why DC plan participants’ assets should be “inflation aware” at all times.

FIGURE 8.3 U.S. Inflation 1900–2015
Sources: Bloomberg Finance L.P. and U.S. Bureau of Labor Statistics, as of December 31, 2015.
INFLATION PROTECTION WHEN ACCUMULATING AND DECUMULATING, AND IN DIFFERENT ECONOMIC ENVIRONMENTS
In PIMCO’s July 2008 Defined Contribution Dialogue, Matthew Rice, Principal and Chief Research Officer at DiMeo Schneider & Associates, LLC, speaks about the need for inflation protection in DC. He shares that “in a DC plan, participants’ liabilities are real, or after inflation. Retiree assets need to keep up with inflation as much as possible. That’s why you need to have asset classes that do better during stretches of unanticipated inflation, in addition to traditional asset classes.”
For retirement savers, those who are accumulating assets to fund their retirement spending, the benefits of using inflation-related investments may not be obvious—as over very long time horizons (i.e., 20-plus years), traditional assets such as equities tend to outperform inflation. Nevertheless, Rice suggests that relying on equities may not be a suitable catch-all inflation hedge:
Equities aren’t a great inflation protector because when you get periods of rising inflation, you frequently get periods of rising interest rates [and] higher discount rates. . . . If you go through a decade of unanticipated rising inflation like we had in the 1970s, it’s typically not a great period for equities. Participants approaching or in retirement absolutely need more inflation protection. Regardless of time horizon, some inflation protection is wise in any portfolio.
As noted above, however, inflation-related assets do more than just provide a hedge against inflation. These assets can also provide an important source of portfolio diversification, particularly relative to the asset classes that typically dominate DC participant portfolios: equities and bonds.
In Chapter 3, we set out a framework (in Figure 3.6) for constructing well-diversified portfolios that are able to generate returns in a variety of economic environments. The underlying message of that framework is that there’s no one “silver bullet” portfolio that will perform well in all economic conditions, whether inflation and growth are high or low. This framework is important to consider when contemplating long-term asset allocation decisions that will ultimately define the retirement investor’s quality of lifestyle. We believe it is prudent to allow participants the ability to cover all four growth/inflation scenarios when constructing long-term strategic portfolios. Inflation-related assets tend to perform well during times when “traditional” portfolios, consisting primarily of nominal stocks and bonds, underperform.
This message is underscored by the deeper work undertaken by PIMCO to investigate inflation “regime shifts,” or large, abrupt, persistent changes in how inflation rises and falls over time. In October 2012, we published a white paper investigating the implications for asset allocation of inflation regime shifts. The underlying thesis of this work is that investors who are concerned about inflation should focus on increasing their exposure to asset classes that provide a positive beta to changes in inflation—and asks whether stocks, the traditional inflation hedge over the long term, are still an effective tactic for inflation protection.
In his paper “Inflation Regime Shifts: Implications for Asset Allocation,” author and PIMCO portfolio manager Nicholas Johnson finds that “domestic U.S. financial assets—stocks and bonds—tend to perform poorly when inflation is higher than previous expectations, compared to real assets, foreign currencies, and TIPS, which tend to perform quite well.” Instead of “high inflation,” the paper concludes that inflation surprises (the difference between expected and actual inflation) are a “more significant driver of asset returns than just the level of inflation, because it is changes in inflation expectations that tend to matter to the security returns. For example, high inflation isn’t the enemy of bonds. If inflation is high, it is likely that interest rates are high and already factored into the price of bonds. Instead, it is the unanticipated move from low inflation to high inflation that is particularly negative for the returns of bonds or stocks.”
Turning from inflation surprises to the relationship between equities and inflation, the paper notes that numerous academic studies have documented a negative beta between stocks and inflation—that is, stock values go down when inflation goes up. Johnson shares:
Yet despite a plethora of academic studies and historical evidence, this negative relationship remains somewhat of a puzzle to financial economists. A common question is whether inflation shocks tend to occur when other equity factors are at play. If so, then in order to assert the existence of a negative correlation today investors must be confident the recurrent—but perhaps not universal—negative factors that give rise to the negative beta between inflation and stocks are prevalent in the current market environment.
The paper ultimately finds that “historically, investors worried about inflation perhaps shouldn’t have bought stocks as a hedge. While most studies were performed on U.S. data, international evidence also supports this conclusion. The negative beta of stock returns to inflation was documented in Japan, the UK, and in large-scale studies involving major stock markets globally.” However, it also concludes that:
. . . none of this analysis suggests that an investor should not own stocks or that they are not an attractive asset class that can provide long-term returns due to the presence of an equity risk premium. The main takeaway should be that equities historically have not been a good inflation hedge and that the process of moving from low inflation to high inflation will likely be detrimental to the returns of financial assets like equities and bonds, particularly relative to physical assets.
In the remainder of this chapter, we investigate how DC plans can effectively provide inflation protection for members in light of the regime shifts for inflation we are pointing to here.
ECONOMIC ENVIRONMENTS CHANGE UNEXPECTEDLY—AND REWARD OR PUNISH VARIOUS ASSET CLASSES
Inflation-hedging assets offer important benefits to DC participants, including the opportunity for improved diversification, risk reduction, and the potential for higher returns in certain economic environments. Most economic environments are defined by two key factors: growth and inflation. Depending on the combination of these factors, different investments tend to perform well or poorly. In high growth and low inflation environments, stocks tend to do well (as experienced in the 1980s and 1990s); but in other economic environments stocks have not fared as well. For instance, the 1930s and 2000s are “lost decades” in terms of stock returns.
In periods of high inflation, inflation-linked bonds, commodities, and real estate tend to do far better than stocks and bonds. Figure 8.4 shows asset class performance in various economic environments: inflationary, an equity bull market, and a turbulent market environment. What’s critical is that participants are prepared for all economic environments, not just one.

FIGURE 8.4 Asset Class Performance in Various Market Environments
Sources: Haver Analytics and PIMCO, as of 31 December 2015.
As you can see in Figure 8.5, looking not too far back in history, nominal bonds did not fare well in the inflationary environment from 1962 to 1980, as this asset class didn’t maintain its purchasing power over time. In fact, while it’s difficult to see on this chart, bonds fell short of inflation by almost 50 percent. What did well? Commodities—even though oil was not included in the CPI-U index until 1983.

FIGURE 8.5 During an Inflationary Environment, Commodities Outperform Other Asset Classes
Hypothetical example for illustrative purposes only.
Source: Haver Analytics and PIMCO, as of 31 December 1980.
Looking ahead, we need to prepare for the possibility of an inflationary environment. What’s more, we need to look for opportunities to find attractive investment returns, not only in the United States but around the globe. Looking for opportunities and discovering how to steer clear of danger is critical as the economic horizon and markets around the world change.
CONSULTANTS FAVOR TIPS, MULTI-REAL-ASSET STRATEGIES, REITS, AND COMMODITIES
We asked participants in our 2016 PIMCO Defined Contribution Consulting Support and Trends Survey which inflation-protection strategies they recommend (Figure 8.6). For stand-alone strategies as part of core menus, a majority of consultants suggest Treasury Inflation-Protected Securities, or TIPS (67 percent), a multi-real-asset strategy (60 percent), and Real Estate Investment Trusts, or REITs (51 percent). Only 14 percent suggest commodities as a stand-alone offering. In addition, a small percentage of consultants recommend natural resource equity (11 percent), private real estate (11 percent), bank loans (7 percent), and infrastructure (4 percent).

FIGURE 8.6 Consultant Support for Inflation-Fighting Assets
Source: PIMCO, 2016 Defined Contribution Consulting Support and Trends Survey.
In blended strategies, commodities top the list, with 84 percent of consultants recommending this asset class. In addition, over three-quarters suggest that REITs (82 percent), a multi-real-asset strategy (78 percent), and TIPS (78 percent) be included, while the majority suggest including natural resource equity (60 percent), bank loans (58 percent), private real estate (56 percent), and infrastructure (53 percent). Just over a quarter of consultants (27 percent) recommend currency or gold for blended strategies.
HOW SHOULD PLAN SPONSORS ADDRESS INFLATION RISK IN DC PORTFOLIOS?
As plan sponsors consider adding inflation-hedging strategies, they may consider one of three strategies: an asset class orientation, a multiasset or hybrid blend, or an outcome orientation. Figure 8.7 illustrates this spectrum of choice.

FIGURE 8.7 A Range of Inflation-Hedging Strategies for Consideration
Source: PIMCO.
In our July 2008 DC Dialogue, Matthew Rice provided some “on-the-ground” examples of how a DC plan addresses inflation protection. He shared:
When they create custom target retirement-date strategies, our clients typically use their underlying core funds or managers within their target retirement-date funds. In addition, most also include other asset classes they don’t want to include in the core menu, such as emerging markets, real estate, high-yield bonds, foreign bonds, Treasury Inflation-Protected Securities (TIPS) or commodity futures.
He explained the use of inflation-hedging assets within a glide path:
We allocate portfolio assets to inflation-protection securities along the entire glide path—not necessarily for the same reason. Early on with more aggressive portfolios, we view TIPS as a tremendous diversifier to equities. When we look at periods of time when equity markets struggle, typically TIPS frequently perform better than nominal bonds. TIPS also should do particularly well in periods of unanticipated rising inflation.
He also comments on the inclusion of commodities and importance of managing to a real liability:
Commodity futures can be a good diversifier, long term. When stocks fall 10 percent, commodity futures are frequently positive and can dampen some of the volatility. As you approach retirement it’s essential to have a portfolio that hedges your liabilities. In a DC plan, participants’ liabilities are real, or after inflation. Retiree assets need to keep up with inflation as much as possible. That’s why you need to have asset classes that do better during stretches of unanticipated inflation, in addition to traditional asset classes.
Rice also notes the value of real estate as a potential inflation hedge, but places it behind inflation-linked bonds and commodities. He explains:
Real estate doesn’t provide the same inflation protection you get from TIPS or commodity futures, but you get a little more inflation protection than from pure equity. Assuming that rising rents accompany higher overall inflation, real estate can be a solid inflation hedge. However, higher inflation usually accompanies higher interest rates and discount rates, which causes the present value of future rents to fall. Real estate is a mixed bag at least, whereas many other financial assets are just plain bad inflation hedges.
In PIMCO’s December 2010 DC Dialogue, we spoke to Dave Zellner, then CIO of the General Board of Pension and Health Benefits of the United Methodist Church, now Westpath Benefits and Investments. Dave told us about how his plan addresses inflation risk through a separate fund for inflation hedging. He also shared his views on using real estate for inflation hedging and the appropriateness of non-U.S. inflation hedging for a mainly U.S.-based population:
Within the Inflation Protection Fund, 50 percent is in U.S. Treasury inflation-protected securities (TIPS), but then 50 percent of the portfolio is set aside for other inflation-sensitive strategies, including 30 percent in a global inflation-protected strategy and 10 percent in a dedicated commodity strategy. For the remaining 10 percent, we invest in emerging market inflation-linked bonds. For instance, we may invest in bonds from Brazil, Mexico, Turkey, Poland, South Africa, Korea, Uruguay and Argentina, among others.
We thought about including REITs in the Inflation Protection Fund, but our benchmark for the Inflation Protection Fund is the Barclay’s U.S. Government Inflation Bond Index. Since we have a pretty tight risk budget, we didn’t want to use most of it on REITs. We preferred adding real estate to the equity funds.
Our primary motivation with the non-U.S. inflation assets is to increase portfolio diversification via exposure to foreign currencies. I know there have been a lot of folks who are concerned about the currency risk, but our view is that currency is a way to provide further diversification to the portfolio.
At the time of writing, we caught up with Zeller, who shared with us that since 2010 “we have brought additional sources of diversification into the fund. Specifically, we have added allocations to floating rate senior secured loans (bank loans) along with timber and infrastructure. We have funded these strategies by reducing the TIPS allocation from 50 to 35 percent.”
IMPLEMENTATION CHALLENGES
No matter your preferred strategy, adding inflation-hedging assets to DC menus requires thoughtful analysis. First, individual inflation-fighting assets respond to inflation in different ways. Then, as we have discussed in previous chapters, there’s the “1 over n,” or naive diversification, consideration or the tendency of DC participants to allocate their assets evenly among fund choices. Broadly speaking, in order to counter the potential negative impacts of inflation on retirement income, we suggest offering a balanced menu of investment choices designed to boost the odds that participants create reasonably balanced portfolios—even when blindly allocating equal sums across menu options.
To help plan fiduciaries as they evaluate inflation-fighting assets both for stand-alone core options and blended strategies, we suggest considering a set of measures: inflation beta, equity correlation, volatility, and downside risk. These measures, along with the questions we suggest plan sponsors use to evaluate how they might apply to portfolios, are set out in Figure 8.8.
FIGURE 8.8 Key Questions and Metrics We Believe Plan Sponsors Should Evaluate
| Benefit or Drawback Question | Statistical Measure |
| How well may this asset or blend of assets respond to an inflation surprise? | Inflation beta, which represents sensitivity of asset class excess returns (above the risk rate) to inflation surprises* |
| Will this asset or blend add diversification relative to equity? | Equity correlation, which measures how the asset moves relative to the S&P 500 Index |
| How volatile is this asset or blend? | Volatility, which measures the variation and risk of an asset’s value |
| What is the potential 12-month loss that may be incurred by investing in this asset or blend? | Downside risk, measured by value-at-risk (VaR), is an estimate of the minimum expected loss at a desired level of significance over 12 months |
*We define inflation surprise as the difference between actual inflation and expected inflation as measured by the Philadelphia Fed Survey. (The Philadelphia Fed Survey is a business outlook survey used to construct an index that tracks manufacturing conditions in the Philadelphia Federal Reserve district, and is used by investors to provide insight on equity markets.) When inflation surprises by +1 percent, an asset with an inflation beta of 1.5 is expected to have an additional excess return of 1.5 percent (all else equal).
Source: PIMCO.
EVALUATING REAL ASSET STRATEGIES
Let’s take a look at how inflation-hedging asset classes and blends perform against these measures:
- Inflation beta: At PIMCO, as mentioned above, we believe asset prices are much more sensitive to inflation surprises (that is, unexpected and sudden increases in inflation, which have not been factored into economic projections) than actual levels of inflation—in other words, investors react strongly when outcomes differ from expectations. Historically, inflation spikes have occurred quickly and unexpectedly. Therefore, we believe the most important factor for DC participants in selecting a real asset is its sensitivity to unexpected inflation. Asset classes with a positive beta to inflation surprises—they rise in value in response to unexpected inflation— have historically tended to perform well, thus preserving purchasing power, during inflationary market environments. (Inflation beta quantifies the magnitude of an asset’s response to inflation; for every 1 percent change in the rate of inflation, returns move by a multiple reflected by its inflation beta.)
As Figure 8.9 shows, the inflation beta of a stock/bond portfolio (composed 70 percent of the MSCI World and 30 percent of the Barclays Aggregate Global Corporate Bond Index, or BAGG) was –2.09 as of December 31, 2015. By contrast, all of the asset types and blends except for infrastructure and natural resource equities showed a higher inflation beta. Commodities and gold stood out with the highest inflation betas—they moved the most in response to changes in the rate of inflation.
FIGURE 8.9 How Different Asset Classes Compare across Key Measures
Asset Classes Inflation Beta1 Estimated Correlation to S&P 500 Estimated Volatility2 VaR 95%3 Commodities 6.17 0.30 17.2% –30.3% TIPS 1.00 –0.19 4.7% –5.1% REITs –1.26 0.86 14.8% –26.5% Infrastructure –2.13 0.85 16.4% –28.9% Bank loans –0.26 0.62 6.2% –7.4% Private real estate –0.77 0.55 15.1% –26.4% Natural resource equities –2.10 0.78 25.7% –39.3% EM currency 0.82 0.44 7.9% –10.4% Gold 6.17 –0.10 15.5% –24.6% High yield –1.44 0.58 10.5% –19.3% Multi-real-asset* 1.97 0.61 9.3% –15.7% Expanded multi-real-asset** 2.30 0.33 6.9% –10.1% 70% Equity/30% Bond –2.09 0.94 11.8% –17.9% 50% Equity/30% Bond/20% Expanded multi-real-asset –1.20 0.90 9.1% –13.7% As of December 31, 2015.
Hypothetical example for illustrative purposes only.
*The multi-real-asset blend is an equally weighted mix of the Barclays U.S. TIPS Index, the Dow Jones UBS Commodity TR Index, and the Dow Jones US Select REIT index.
**The composition of the expanded multi-real-asset blend is 45 percent Barclays U.S. TIPS Index, 20 percent Dow Jones UBS Commodity TR Index, 15 percent JP Morgan Emerging Local Markets Index, 10 percent Dow Jones US Select REIT Index, and 10 percent Dow Jones UBS Gold Sub Index.
Other asset classes are defined as follows: Equities: MSCI World Index; Bond: Barclays U.S. Aggregate Index; TIPS: Barclays U.S. TIPS Index; Commodities: Dow Jones UBS Commodity TR Index; REITs: Dow Jones US Select REIT Index; EM Currency: JP Morgan Emerging Local Markets Index (Unhedged); Gold: Dow Jones UBS Gold Sub Index; Natural Resources: MSCI ACWI Commodity Producers Sector Capped Index; Bank Loans: Credit Suisse Institutional Leveraged Loan Index; High Yield: BofA Merrill Lynch U.S. High Yield, BB-B Rated, Constrained Index; Private Real Estate: NCREIF/Townsend Core Index; Infrastructure: S&P Global Infrastructure Index.
1 Inflation beta represents the sensitivity of asset class excess returns (above the “risk-free” rate) to inflation surprises (the difference between actual inflation and expected inflation as measured by the Philadelphia Fed Survey); when inflation surprises by +1 percent, an asset with an inflation beta of 1.5 is expected to have an additional excess return of 1.5 percent (all else equal).
2 We employed a block bootstrap methodology to calculate volatilities. We start by computing historical factor returns that underlie each asset class proxy from January 1997 through the present date. We then draw a set of 12 monthly returns within the data set to come up with an annual return number. This process is repeated 25,000 times to have a return series with 25,000 annualized returns. The standard deviation of these annual returns is used to model the volatility for each factor. We then use the same return series for each factor to compute covariance between factors. Finally, volatility of each asset class proxy is calculated as the sum of variances and covariance of factors that underlie that particular proxy. For each asset class, index, or strategy proxy, we will look at either a point in time estimate or historical average of factor exposures in order to determine the total volatility. Please contact your PIMCO representative for more details on how specific proxy factor exposures are estimated.
3 Value-at-risk (VaR) is an estimate of the minimum expected loss at a desired level of significance over a 12-month horizon.
Source: PIMCO.
- Equity correlation: To reap the potential diversification benefits of real assets, each asset type and blend should be evaluated for its correlation to equities. Viewed through this lens, the stock/bond portfolio shows a tight correlation of 0.94, to the S&P 500, while other assets or combinations show lower correlations (thus offering improved diversification potential). Assets with the lowest correlations include TIPS, gold, and commodities.
- Volatility: Selecting an individual asset class or blend with relatively low volatility is important to lessening the risk of participants selling out with a sudden shift in returns. As Figure 8.9 shows, the stock/bond portfolio had volatility of 11.8 percent, while other asset types or blends offered smoother rides. Of note, TIPS, bank loans, and the expanded multi-real-asset blend showed lower volatility.
- Downside risk: Although there are many ways to measure tail risk (defined as the risk of an asset or portfolio of assets moving more than three standard deviations from its current price), we suggest evaluating risk exposure by assessing value-at-risk (VaR) at a 95 percent confidence level. (VaR estimates the minimum expected loss at a desired level of significance over 12 months, while a 95 percent confidence level represents how often the true percentage of the population who would pick an answer lies within the confidence interval. The 95 percent confidence level means you can be 95 percent certain.) Applying this measure, we observe that the stock/bond portfolio has potential downside risk of –17.9 percent. Other asset types and blends may have less downside risk. TIPS, bank loans, and the expanded multi-real-asset blend stand out again.
SUMMARY COMPARISON OF INDIVIDUAL AND MULTI-REAL-ASSET BLENDS
By comparing asset classes across these metrics, Figure 8.9 underscores that when it comes to fighting inflation, a multipronged approach may be best. It lists individual asset types followed by multi-real-asset and expanded multi-real-asset categories.
These data go a long way in explaining why the consultants we polled are strongly supportive of adding multi-real-asset strategies to a DC plan’s core lineup. A well-diversified portfolio should hold assets that perform well in different economic environments, but plan sponsors don’t always want core options for each. That’s where a multi-real-asset solution might come in: It offers a convenient way to provide diversification across inflation-fighting assets, protect purchasing power, and limit volatility that might result from holding a single asset class (such as commodities) in isolation.
Relative to the stock/bond portfolio, both the multi-real-asset and expanded multi-real-asset blends offer inflation hedging (positive inflation betas) and potential diversification benefits (i.e., equity correlations of less than 1). What’s more, both blends show the potential for lower volatility and less risk of loss (VaR) than the stock/bond portfolio. Notably, the blends may offer volatility and risk-of-loss levels below those of many individual real assets. To simplify a core lineup and reduce the risk that a participant will either chase or flee an investment at the sight of enticing or unfortunate returns, these multi-real-asset blends may be preferable to individual assets.
In addition to adding the multi-real-asset blend or the expanded multi-real-asset blend to the core lineup, a plan sponsor should evaluate their investment default for its ability to stand up to inflation. Plan sponsors may want to add these multi-real-asset blends to the investment default glide path or may prefer adding individual asset classes in different weights based on target-date vintage. As Figure 8.9 shows, shifting 20 percent of the 70/30 stock-and-bond allocation to the expanded multi-real-asset blend allows the potential inflation-fighting and diversification benefits to shine through. Most notably, volatility decreases from 11.8 percent to 9.1 percent while the potential loss (VaR) drops from – 17.9 percent to –13.7 percent and the inflation beta increases from –2.09 to –1.2.
Figure 8.10 shows how a multi-real-asset solution might look in practice, consistent with their place as one of the most consultant-recommended inflation-hedging options for DC core menus.

FIGURE 8.10 Real Asset Diversification for Inflation Protection
*Treasury Inflation-Protected Securities
Hypothetical example for illustrative purposes only.
The chart does not represent a fixed allocation and is only meant to highlight a potential portfolio allocation.
Source: PIMCO.
In Figure 8.11, we list the inflation-fighting assets consultants rated “important” along with suggested index proxies. In addition, we show two multi-real-asset blends, as well as a stock and bond portfolio.
FIGURE 8.11 Diversifying Real Asset Strategies and Index Proxies
| Diversifying Real Asset Strategies | Index Proxies | Description |
| Commodities | Dow Jones-UBS Commodity Index | Provides long-term return potential and high inflation sensitivity through commodities exposure across various sectors |
| TIPS | Barclays U.S. TIPS Index | Designed to provide a predictable real return in excess of inflation and portfolio diversification through low correlation to other asset classes |
| REITs | Dow Jones U.S. Select REIT Index | Provides a diversified inflation hedge and consistent income through exposure to the various real estate sectors |
| Infrastructure | S&P Global Infrastructure Index | Provides exposure to companies that represent the listed infrastructure universe including utilities, transportation, and energy |
| Bank loans | Credit Suisse Institutional Leveraged Loan Index | Provides exposure to institutional leveraged bank loans |
| Private real estate | NCREIF/Townsed Core Index | Provides exposure to private equity real estate funds pursuing core investment strategies |
| Natural resource equities | MSCI ACWI Commodity Producers Sector Capped Index | Provides equity exposure across equally weighted commodity-related sectors including energy, metals, and agriculture |
| Emerging Markets currency | JP Morgan Emerging Local Markets Index (Unhedged) | Provides inflation hedge through exposure to a broad range of Emerging Markets currencies |
| Gold | Dow Jones UBS Gold Sub Index | Provides inflation hedge through exposure to gold futures |
| High yield | BofA Merrill Lynch U.S. High Yield, BB-B Rated, Constrained Index | Provides exposure to BB-B Rated U.S. dollar-denominated corporate bonds publicly issued in the U.S. domestic market with total allocation to an individual capped at 2% |
| Multi-real-asset | 1/3 Barclays U.S. TIPS Index, 1/3 Dow Jones UBS Commodity TR Index, 1/3 Dow Jones US Select REIT Index | “2-in-1” TIPS, U.S. commodity, and real estate exposure looks to hedge inflation risk and provide diversification |
| Expanded multi-real-asset | 45% Barclays U.S. TIPS Index, 20% Dow Jones UBS Commodity TR Index, 15% JP Morgan Emerging Local Markets Index, 10% Dow Jones US Select REIT Index, 10% Dow Jones UBS Gold Sub Index | Provides a comprehensive portfolio strategy to seek diversified exposure to inflation-related investments, including assets that respond to different types of inflation |
| Stock/bond portfolio | 70% MSCI World Index, 30% Barclays U.S. Aggregate Index | Provides a balanced strategy to seek exposure to traditional stocks and bonds |
Source: PIMCO.
INFLATION-HEDGING ASSETS IN TARGET-DATE GLIDE PATHS
We now look at historical portfolio experience with and without the inclusion of inflation-related assets; please note our data set is somewhat limited as TIPS were first issued in 1997. In the following table, we consider a 60 percent equity and 40 percent bond portfolio versus a 50 percent equity, 30 percent bond, and 20 percent inflation-related asset portfolio.
As you can see from Figure 8.12, the diversification benefit of including inflation-related assets in a traditional stock and bond portfolio is clear based on the 0.7 percent lower volatility while exhibiting similar returns. Additionally, the return-to-risk ratio improves by over 5 percent and the max drawdown (or the peak-to-trough decline during a specific recorded period) is improved by roughly 2 percent, which speaks to the downside that risk mitigation inflation-related assets can cause to portfolios. Importantly, all of these enhancements from the inclusion of inflation-related assets into a traditional stock and bond portfolio were achieved in a benign inflation environment when the full value proposition of holding such assets was not necessarily realized (i.e., inflation not advancing and/or surprising to the upside).
FIGURE 8.12 Adding Inflation-Related Assets to a Traditional Nominal Stock and Bond Mix May Improve Portfolio Diversification (From January 1997 to December 2015)
| Hypothetical Portfolios | Annualized Return | Annualized Volatility | Return/Risk | Max Drawdown |
| 60% equities/40% bonds | 6.9% | 9.3% | 0.74 | –33% |
| 50% equities/30% bonds/ 20% inflation-related assets | 6.7% | 8.6% | 0.78 | –31% |
As of December 31, 2015.
Equities: S&P 500 Index; Bonds: Barclays U.S. Aggregate Index; Inflation-related assets: Inflation Response Index (45 percent Barclays U.S. TIPS, 20 percent Bloomberg Commodity Index [formerly Dow Jones UBS Commodity Total Return], 15 percent JP Morgan Emerging Local Markets Plus, 10 percent Dow Jones Select REIT, 10 percent Bloomberg Gold Subindex Total Return [formerly Dow Jones UBS Gold Subindex Total Return]
Source: Bloomberg Finance L.P.
While the benefit of adding real assets may be clear, plan fiduciaries may worry in markets that reward a less-diversified investment approach such as 60 percent equities and 40 percent bonds. In an NEPC June 2016 article, “The Disease of Doubt,” Chief Investment Officer Timothy F. McCusker, FSA, CFA, CAIA, discusses how plan fiduciaries may experience doubt “whenever a portfolio position has not played out as expected.” He says, “After watching U.S. equities repeatedly outshine global markets, and witnessing the losses racked up by emerging markets and real assets, it is intuitive for investors to question their allocation and philosophy.” McCusker encourages plan fiduciaries to “embrace approaches that depart from average asset allocations,” and he specifically comments on the importance of inflation-hedging assets:
With high commodity production, tepid global growth, and spending constrained by debt levels, deflationary pressures have recently outweighed inflationary concerns. That said, inflation can rear its head with a change in monetary policy, amid a strong spurt of global growth, or unforeseen commodity supply shocks. While these scenarios may seem unlikely in the near term, we cannot rule them out. In most cases, a portfolio of growth-centric assets (even if balanced with nominal bonds) would suffer meaningfully if inflation appeared. The critical strategic decision for inflation protection is whether program objectives have an inflationary component. If they do, exposure to real assets should be considered a strategic imperative, even when suffering through losses.
OBSERVATIONS FOR INFLATION-HEDGING ASSETS IN TARGET-DATE GLIDE PATHS
Looking at Figure 8.13, you will find a comparison of the total and breakout allocations to Inflation-Hedging Assets for the Market Average and Objective-Aligned Glide Paths. In total, the Objective-Aligned series contains a substantially higher allocation, 16.9 percent on average, compared to 6.8 percent for the Market Average. In early vintages, the difference between the Market Average and Objective-Aligned allocations is lower than at later points, as the Objective-Aligned glide path increases its allocation faster, decreasing again just before retirement.
FIGURE 8.13 Glide Path Allocation to Inflation-Hedging Assets
| Years to Retirement | 40 | 35 | 30 | 25 | 20 | 15 | 10 | 5 | 0 | Average |
| Allocation Percentage to Inflation-Hedging Assets | ||||||||||
| Market Average Glide Path | 4.80% | 5.00% | 5.30% | 5.60% | 6.00% | 6.80% | 8.00% | 9.40% | 10.40% | 6.81% |
| Objective-Aligned Glide Path | 13.00% | 13.00% | 14.00% | 14.00% | 14.00% | 17.00% | 21.00% | 25.00% | 21.00% | 16.89% |
| Breakout Allocations within Inflation-Hedging Assets | ||||||||||
| TIPS | ||||||||||
| Market Average Glide Path | 0.50% | 0.60% | 0.80% | 1.10% | 1.60% | 2.40% | 3.60% | 4.90% | 6.00% | 2.39% |
| Objective-Aligned Glide Path | 2.00% | 2.00% | 2.00% | 2.00% | 2.00% | 2.00% | 5.00% | 10.00% | 10.00% | 4.11% |
| Long TIPS | ||||||||||
| Market Average Glide Path | 0.30% | 0.30% | 0.40% | 0.50% | 0.60% | 0.80% | 1.20% | 1.60% | 1.80% | 0.83% |
| Objective-Aligned Glide Path | 1.00% | 1.00% | 2.00% | 2.00% | 2.00% | 7.00% | 10.00% | 10.00% | 7.00% | 4.67% |
| Commodities | ||||||||||
| Market Average Glide Path | 1.40% | 1.50% | 1.50% | 1.40% | 1.40% | 1.30% | 1.20% | 1.10% | 1.00% | 1.31% |
| Objective-Aligned Glide Path | 2.00% | 2.00% | 2.00% | 2.00% | 2.00% | 2.00% | 2.00% | 2.00% | 2.00% | 2.00% |
| Real Estate | ||||||||||
| Market Average Glide Path | 2.60% | 2.60% | 2.60% | 2.60% | 2.40% | 2.30% | 2.00% | 1.80% | 1.60% | 2.28% |
| Objective-Aligned Glide Path | 8.00% | 8.00% | 8.00% | 8.00% | 8.00% | 6.00% | 4.00% | 3.00% | 2.00% | 6.11% |
Market Average data is as of September 30, 2015. Objective-Aligned data is as of December 31, 2015.
Sources: PIMCO and NextCapital.
In the breakout allocation, we see a similar story. While the allocations are higher, on average, for the Objective-Aligned glide path for each of the individual allocations, there are some differences. TIPS, Long TIPS, and Commodities all begin with relatively small differences between the two glide paths and increase through time, while the difference is great in Real Estate at the beginning. Then as we near retirement, the difference decreases as both glide paths reduce their allocations to Real Estate. At retirement, the Objective-Aligned glide path also reduces exposure to Long TIPS while the Market Average continues to increase exposure. Understanding that the goal of the Objective-Aligned Glide Path is to more closely match the liabilities of a retiree, it makes sense that we would wish to decrease the duration risk as the duration of the liabilities decreases. This change, along with the higher overall allocation to inflation-hedging assets, serves to increase correlations to PRICE, the PIMCO Retirement Income Cost Estimate discussed in Chapter 2, while also improving risk-adjusted returns throughout.
IN CLOSING
Inflation-fighting strategies are fundamental to DC investment lineups and participants’ need to build and preserve purchasing power in retirement. Plan sponsors should evaluate inflation-fighting assets, separately and in combination, to determine how best to offer them.
Whatever choices are made, selected assets or blends should be designed to deliver the primary benefits of inflation responsiveness, diversification relative to stocks, volatility reduction, and downside risk mitigation. To deliver these and ward off the inflation robber baron, plan sponsors may find multi-real-asset blends attractive both as core options and as additions to asset allocation strategies such as target-date funds.
QUESTIONS FOR FIDUCIARIES
- Does our plan include inflation-hedging assets?
- What inflation-hedging options are available on the core lineup?
- Should inflation choices be made available as stand-alone core asset classes, as multi-asset blends, or as an outcome orientation?
- How are inflation-hedging assets blended into the plan’s investment default?