CHAPTER 3
Plan Investment Structure
Make everything as simple as possible, but not simpler.
—Albert Einstein
Behavioral economists have taught us the importance of investment menu design. In the early days of DC plans, an investment menu may have been as simple as offering just a few investment choices; often these were limited to a single choice each for capital preservation, bonds, and stocks. This narrow set of at least three core investment offerings was not surprising given limited government direction as to the investment structure offered in plans. Under the Employee Retirement Income Security Act (ERISA) section 404(c), participants must be able to select from at least three investment alternatives, each of which is diversified and has materially different risk and return characteristics. According to the Callan Investments Institute’s 2016 Defined Contribution Trends report, most DC plans (81.3 percent) are designed to comply with ERISA section 404(c).1 Today, participant-directed retirement plans maintain far more than three investment choices, and, though there may be overlap among asset classes within an investment array, in the vast majority of retirement plans at least three investments with materially different risk and return characteristics can be identified.
Participants’ current choice of investment alternatives within DC plans stands in contrast to the 1980s, when offering a balanced strategy or mix of bonds and stocks seemed unnecessary as it was thought that participants could (and would) create their own balance by allocating assets across the investment choices offered. Since that time, however, DC plan investment menu design has continued to evolve. First, we saw the introduction of balanced funds, and then a focus on offering more investment choice; often by filling the equity style box—that is, plans would make sure to offer large cap and small cap as well as value and growth choices. At the same time, education efforts directed at plan participants aimed to increase their understanding of stocks, bonds, and asset allocation, hoping participants would then make informed investment decisions.
Unfortunately, education was not enough. As DC call centers answered seemingly endless calls from participants asking, “How should I allocate my money?” more plan sponsors offered solutions to help people make asset allocation decisions. These included asset allocation guides and modeling tools, followed by the development of a series of balanced or target-risk funds (e.g., conservative, moderate, and aggressive). Despite the guides, tools, and target-risk offerings, inertia still often thwarted success as participants generally failed to reallocate their assets over time; with the result that what may have been an appropriate asset allocation when participation began (say, at age 30) was potentially far too risk-laden as the participant aged (say, at age 40). The solution: target-date strategies (or, in the UK, the “lifecycling” approach) which automatically shifts the asset allocation for the DC participant over time, typically reducing investment risk as the target retirement date approaches. While target-date strategies help simplify the selection and asset allocation decisions, they need not be simple in their underlying structure.
Today, target-date funds are the most prevalent DC investment default, followed by target-risk or balanced funds. Yet, these strategies are rarely offered alone. Rather, participants typically are given a core investment lineup as well, allowing them to create their own asset allocation. Plus, about a third of DC plans also offer participants a brokerage window, whether for access to mutual funds only or to full brokerage. As a rule, behavioral economists generally support this multitier structure as an improvement over simply presenting participants with a long list of funds from which to make choices.
In 2012, PIMCO’s DC Dialogue spoke with Brigitte Madrian, Aetna professor of public policy and corporate management at the Harvard Kennedy School, about DC investment menus. She shared the following:
From a behavioral perspective, investment menus should be simple on the surface, yet well diversified underneath. Offering a three-tier structure is one such approach that may help from a behavioral perspective. The first tier, for the novice investor or the investor who wants to cede control to someone else, would include a set of low-fee target date funds. The second tier, for the investor who wants some control over their asset allocation, would be comprised of a small set of broadly diversified core investment options. For instance, instead of offering growth and value equity choices, perhaps offer a blend by market size, or offer a single global equity strategy that includes developed and emerging markets. A third tier, for the do-it-yourself investor, could include a wider range of investment funds, or a brokerage window. For the novice investor, this type of tiered investment menu is less overwhelming.
TIERS AND BLENDS: INVESTMENT CHOICES FOR DC PARTICIPANTS
In our opinion, it may be beneficial to offer participants a simple menu, but not one that precludes the option of a broadly diversified portfolio. The asset classes that build diversification within target-date strategies are also needed as core options. Yet, we believe the best way to diversify assets in the core menu may not be with stand-alone investment choices, but rather perhaps as components within a blended strategy. As we will discuss, blended strategies may help both simplify a menu and reduce risk; both may help curb behaviors that may harm investment returns over time, such as performance chasing or fleeing an investment or, worse, the entire plan.
In a three-tier structure, target-date strategies offer an approach that we believe works well for the default (or first tier). A second tier of a limited set of broadly diversified core investments can allow for diversification without unacceptable risk. Finally, a third tier for a mutual fund or full brokerage window accommodates plans that want to respond to the small but vocal minority of participants who want to run their own show by investing in brand-name mutual funds, ETFs, or individual securities.
While consultants suggest that DC plans offer a multitier investment structure, to date there is no consensus on which investment choices belong within each tier. In PIMCO’s 2014 Defined Contribution Consulting Support and Trends Survey, we asked whether plans should offer multiple investment tiers; nearly all respondents (98 percent) suggested a target-date or target-risk investment tier and all firms (100 percent) recommended that clients offer a core fund tier (with both active and passive investment choices). (Note that the vast majority did not recommend a separate investment tier for passive only or active only.) Over three quarters of consultants (76 percent) also suggested, as an additional investment tier, that either a mutual fund-only brokerage window (41 percent) or a full brokerage window (35 percent) be offered. In the 2016 survey, those suggesting a brokerage window declined to just under half of consultants (47 percent), with 25 percent recommending mutual fund only and 22 percent suggesting full brokerage, while another 18 percent said “it depends on the client situation.”
From a communication perspective, some plans label the investment default or asset allocation tier as the “do-it-for-me” choice, the core fund tier as “help-me-do-it,” and a brokerage window as the “let-me-do-it” option. If managed accounts are offered, they may be a choice within the “do-it-for-me” choice. Let’s take a look at the possible choices, considerations, and consultant suggestions for each tier.
TIER I: “DO-IT-FOR-ME” ASSET ALLOCATION INVESTMENT STRATEGIES
The “do-it-for-me” tier is the most important of all options, given that this is the tier to which plan sponsors often default DC participants. For this tier, plan fiduciaries typically select a qualified default investment alternative (QDIA) as identified by the Department of Labor (DOL). With the intent of ensuring the QDIA is appropriate as a single investment capable of meeting a worker’s long-term retirement savings needs, the QDIA regulations offer four types and examples of each, as follows:
- A product with a mix of investments that takes into account the individual’s age or retirement date (an example of such a product could be a life-cycle or targeted-retirement-date fund)
- An investment service that allocates contributions among existing plan options to provide an asset mix that takes into account the individual’s age or retirement date (an example of such a service could be a professionally managed account)
- A product with a mix of investments that takes into account the characteristics of the group of employees as a whole, rather than each individual (an example of such a product could be a balanced fund)
- A capital preservation product that is available for only the first 120 days of participation
A QDIA must be managed by one of three options: by an investment manager, a plan trustee, or a plan sponsor; by a committee composed primarily of employees of the plan sponsor that is a named fiduciary; or by an investment company registered under the Investment Company Act of 1940. A QDIA generally may not invest participant contributions in employer securities. (A copy of the regulations is available on the DOL’s website at www.dol.gov/ebsa under “Laws and Regulations.”)
Prior to the establishment of the QDIA regulations, many plans defaulted participant assets to either a capital preservation fund (such as stable value or a money market fund), while some defaulted to company stock. Through the QDIA regulations, the DOL made it clear that they viewed neither capital preservation funds nor company stock as appropriate long-term savings vehicles. The regulations thus allow for capital preservation “only for the first 120 days” as a way to simplify administration for those who may opt out of auto-enrollment.
While the DOL did not specifically state which investment products or strategies plan fiduciaries should select among, the categories and examples communicate support for three product types: target-date strategies, managed accounts, and balanced or target-risk funds. Today, plans most commonly default to target-date strategies. The Plan Sponsor Council of America (PSCA) reports in their 58th Annual Survey of Profit Sharing and 401(k) Plans (reflecting 2014 plan experience) that 81 percent of plans use a QDIA and among those, 74 percent offer target-date funds, 14 percent offer balanced or target-risk funds, 8.5 percent use managed accounts, and only 3 percent default to a stable value fund.
Consultants suggest that over time, plans will continue moving toward target-date funds as the most common default. In PIMCO’s 2016 Defined Contribution Consulting Support and Trends Survey, 89 percent of respondents generally recommend target-date strategies as the QDIA, while 8 percent recommend balanced or target risk and 3 percent suggested multiple defaults—and no consulting firm suggested managed accounts as a default. Now, let’s take a quick look at each default type.
Target-Date Strategies
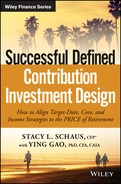
Target-date strategies are also known as life-cycle, age-based, or dynamic-risk strategies. They generally follow a glide path that reduces risk as a participant gets closer to retirement age; Figure 3.1 shows how a glide path may be structured over time to move from growth assets to capital preservation assets, with allocations changing as participants age and move closer to retirement.

FIGURE 3.1 A Sample Diversified Glide Path Allocation
Source: PIMCO. For illustrative purposes only.
Typically, these funds are offered in 5- or 10-year retirement year vintages (e.g., 2050, 2045, and Income funds for those near or at retirement). As the QDIA, participant assets generally are defaulted to the target date based on the participant’s expected retirement date. For example, a 30-year-old participant may be defaulted into the 2050 fund assuming a retirement age of 65. These strategies are used in many markets although their asset allocation structure may differ significantly. For instance, in the UK the National Employment Savings Trust (NEST) offers single-year target-date funds that manage investment risk over three phases throughout members’ savings careers. When members join NEST, their contributions are invested by default into a NEST Retirement Date Fund unless they make an active investment choice of a different fund. The default single-year Retirement Date Fund will match either their State Pension age or age 65, depending on their date of birth. Each of the three phases sets allocations to both growth and income-seeking assets in varying proportions to meet the different objectives throughout members’ time savings (Figure 3.2).

FIGURE 3.2 Indicative Glide Path of NEST Retirement Date Funds
In Morningstar’s 2016 “Target-Date Fund Landscape” research paper, lead authors Jeff Holt and Janet Yang comment:
Target-date funds continue to play an increasingly crucial role in delivering successful retirement outcomes for investors. Target-date fund assets have grown from $116 billion to $763 billion in the past 10 years, as the retirement landscape has shifted to defined-contribution over defined-benefit plans. However, target-date series often vary significantly from one another, as managers impart their different philosophical approaches to balancing risks and implementing their asset-allocation decisions, among other factors. These differences may cause investors’ results to diverge, and target-date funds’ relatively short history combined with their decades-long investing horizons can muddle the assessment of those results. Still, the U.S. Department of Labor stressed the importance of evaluating target-date series in its “Target Date Retirement Funds—Tips for ERISA Plan Fiduciaries.”2
Target-date strategies are offered as mutual funds or collective investment trusts (CITs), or they may be customized using separate accounts. In Chapter 4 we will consider the DOL’s “Target-Date Retirement Funds—Tips for ERISA Plan Fiduciaries” and will delve into the types, structures, and considerations for target-date strategies.
Balanced or Target-Risk Strategies
Many plan sponsors and consultants prefer offering a single balanced fund or a series of funds that target a specific risk level. For instance, they may offer a set of three: a conservative, moderate, and aggressive fund. This target-risk series also may be referred to as lifestyle funds. (Note: this label may be confusing as in the UK they call target-date-like strategies that modify risk over time “lifestyling.”) Plans that offer these types of strategies may believe it more appropriate to default participants into a risk level that will not change over time—they may believe that the participant is the one who should decide whether they should change their risk by moving their assets to a different fund or creating their own asset allocation. While this group often views target-date strategies as too paternalistic, they are in the minority. The majority of plan fiduciaries have moved away from defaulting to balanced or target-risk strategies as they worry participants may take on an inappropriate level of risk given their time horizon for investment.
Over the past decade, plans that offer target-risk or balanced funds increasingly have migrated to target-date funds. PIMCO’s DC Dialogue in October/November 2013 spoke with Sharon Cowher, Director of Trust Investments, and Christine Morris, Assistant Treasurer at Halliburton, about how to evolve from custom target-risk to custom target-date strategies. They explained:
We had four risk-based funds, with the moderate risk-based fund serving as the default fund. Because it had a substantial amount of assets, we did consider whether or not to offer both target-date and risk-based options, but decided that it would be too confusing.
To gain confidence with the decision to eliminate the target-risk strategies, we evaluated whether participants in these strategies changed their asset allocation over time. Not surprisingly, we found a high level of inertia. The default allocation was approximately 60 percent equities and 40 percent bonds. When we looked at our population by age bands in 10-year intervals, we found the vast majority stayed in the default strategy. This was true until we looked at participants over 50 years of age.
Target-risk funds require action by the participant, because the risk of a moderate fund always stays moderate and the aggressive fund always stays aggressive, etc. What we saw, based on the asset allocation of our participants, is they aren’t taking action until they were in their 50s.
And then, when they did change, they swung it too far on the conservative side—often fully to stable value.
While rare, some plans offer participants both target-date funds as a default and target-risk funds as a core investment option. The 2015 survey from the Plan Sponsor Council of America (their 58th Annual Survey of Profit Sharing and 401(k) Plans, reporting on the 2014 plan year experience of 592 companies) shows that while only 16 percent of plans offer target-risk/lifestyle funds, 56 percent offer a balanced or asset allocation fund. Consultants in PIMCO’s 2016 Defined Contribution Consulting Support and Trends Survey said they expect growth in the custom target-risk/balanced category; this growth expectation may be surprising given the shift from target-risk to target-date offerings. We believe that for many plans, the increase in balanced offerings may reflect the addition of a single balanced strategy such as a global tactical asset allocation (GTAA) strategy. Nearly two fifths of consultants (39 percent) recommended the addition of such strategies as a core investment option, while even more (61 percent) suggested adding GTAA to a blended strategy (i.e., multimanager/white label or in a sleeve of a custom target-date/risk portfolio). We will return to the topic of how GTAA strategies may fit into plans in Chapter 9 when we consider additional strategies, including alternatives.
Managed Accounts
In PIMCO’s 2015 Defined Contribution Consulting Support and Trends Survey (referencing 2014 data), 60 percent of consultants showed support for managed accounts as an opt-in choice, but few (7 percent) supported them for the QDIA or opt-out option (note: this dropped to zero in the 2016 survey). Consultants shared various concerns about managed accounts, including the additional cost versus the potential alpha (the excess return over a benchmark) available, the appropriateness and relative impact of personalization factors, the inability to use multiasset portfolios, and biases toward or away from active management and diversifying asset classes.
While assets overseen within U.S. managed-account programs now exceed $150 billion, plan fiduciaries also raise concern about how best to benchmark these strategies. The importance of evaluating these strategies was noted in a June 2014 report by the U.S. Government Accountability Office (GAO) entitled “401(k) Plans: Improvements Can Be Made to Better Protect Participants in Managed Accounts.”3 In PIMCO’s February 2015 DC Design article, DC experts Steve Ferber and Michael Esselman shared both the need for and approach to benchmarking managed accounts:
The GAO report stated that plan sponsors often have had limited or insufficient information to evaluate potential providers and monitor ongoing services. Importantly, the GAO also noted that participants face similar challenges. The good news is that these challenges can be overcome. Providers typically disclose basic aspects of their offerings, such as fees and service levels. And when advice providers disclose details of their methodology, the evaluation can be fairly straightforward.
Interest in managed accounts is expected by many to increase over time as improvements are realized in technology, cost efficiencies, participant engagement, and benchmarking. Yet, the majority of interest may come from those who opt-in rather than default into this option. Also worth noting as the managed-account market develops is the rise of robo-advisors, online wealth management services that provide automated, algorithm-based portfolio management advice, including for DC plans. While the robo-advisor offering is still new and developing, some observers expect that robo-advisor offerings and approaches will increasingly be integrated into managed account offerings, meaning plan participants may come to rely on a mix of managed and robo account services.
TIER II: “HELP-ME-DO-IT” STAND-ALONE OR “CORE” INVESTMENT OPTIONS
DC plans, with rare exception, offer a set of stand-alone or core investment funds for participants to select among. By selecting a short list of investment options, plan fiduciaries help the participant in making an investment selection. Looking back, we believe the economic environment that 401(k) plans grew up in may have significantly influenced this DC investment lineup. At the 1981 inception of 401(k) plans, the United States entered one of the strongest bull markets in global economic history. As shown in Figure 3.3, from 1981 to 2000 DC participants benefited from the rise in stocks and bonds without much worry about inflation eroding their returns, as the Consumer Price Index averaged 3.5 percent during this time period.

FIGURE 3.3 U.S. Market Returns, 1981–2000
Stocks are represented by the S&P 500; bonds are represented by the 10-year U.S. Treasuries; commodities are represented by an equally weighted index constructed by Gorton and Rouwenhorst from 1962 to 1990. Beginning January 1991, commodities are represented by the DJ-UBS Commodity TR Index.
Sources: PIMCO, Bloomberg Finance L.P., “Facts and Fantasies about Commodities Futures”: Gorton and Rouwenhorst.
This market experience, along with research on the value of diversifying equity across styles and market cap sizes, likely encouraged many plan sponsors to “fill the equity style box” shown in Figure 3.4 and lengthen the list of core equity choices. The work of academics Eugene Fama and Kenneth French on the importance and benefit of diversifying asset allocation by three factors (company size, company price-to-book ratio, and market risk)—hence, the Fama-French three-factor model—also encouraged increasing asset diversification beyond equities and fixed income.

FIGURE 3.4 Typical DC Core Menu Choices—Driven by Bull Markets and a Need to “Fill the Style Box”
Source: PIMCO. For illustrative purposes only.
PSCA’s 58th Annual Survey shows that from 2003 to 2014, the average number of funds made available for participant contributions increased from 16 to 19 (note that this approach counts target-date/target-risk funds as one fund rather than counting each of the funds in the series). PSCA finds that the funds most commonly offered to participants are actively managed domestic equity (80 percent of plans), actively managed international equity (75 percent of plans), indexed domestic equity (78 percent of plans), and actively managed domestic bond (73 percent of plans). On average, plans offer two balanced funds, two bond funds, six domestic equity funds, and two international equity funds. Notably (and as shown in Figure 3.4), 8 out of 12 funds mentioned here are equity strategies; it thus appears that close to 70 percent of investment choices are equity funds.
Academics who have studied these issues often raise concern with menu design, explaining that the number and types of investment choices may be perceived by participants as offering an appropriate balance when evenly allocating contributions across the set. Looking back, early DC education efforts made clear the need to diversify, often by using tactics such as showing pictures with the message “don’t put all of your eggs in one basket.” This may have led many plan participants to spread their money evenly across all available investment choices without regard to the risk or other considerations. Academics label this phenomenon as the “one over n (1/n) heuristic” or “naive diversification,” explaining that the plan design itself may be interpreted as providing unintended advice regarding an appropriate asset allocation (that is, if there are 10 choices available, an appropriate strategy is to allocate 10 percent of assets to each choice). Shlomo Benartzi and Richard Thaler have studied whether the 1/n effect manifests itself among investors making decisions in the context of defined contribution saving plans. They found that “some investors follow the ‘1/n strategy’: they divide their contributions evenly across the funds offered in the plan. Consistent with this Naïve notion of diversification, we find that the proportion invested in stocks depends strongly on the proportion of stock funds in the plan.”4 Therefore, as plan fiduciaries consider the core fund menu, both the number of investment options and the types of asset class—and, more importantly, risk categories that encompass various asset choices—should be carefully considered.
In PIMCO’s 2016 Defined Contribution Consulting Support and Trends Survey, respondents suggested a far shorter list of investment choices than the 19 reported by PSCA. For the past several years, consultants have suggested, at the median, a core lineup of 10 investment offerings. As shown in Figure 3.5, you can see that 98 percent of consultants suggest that plans offer a capital preservation option and at the median, suggest only one option in this category. All of the consultants suggest fixed income and equity choices with a median number of two and six, respectively, and the vast majority recommend that an inflation-protection choice be made available. In addition, over a third of consultants suggest additional strategies for the menu such as a balanced fund or alternatives. In Chapters 5 through 9 we will review each of these investment categories.

FIGURE 3.5 PIMCO Defined Contribution Consulting Support and Trends Survey 2016: What Is the Optimal Number of Core Menu Options?
Source: PIMCO, 2016 Defined Contribution Consulting Support and Trends Survey.
Compared to the PSCA survey data average core lineup, the consultant-suggested menu offers slightly more balance, with 60 percent of the investment choices sitting in the equity asset class. But considering the asset-class label alone may be insufficient. We suggest taking a closer look at this lineup from the perspective of what is driving the risk of each fund. For instance, if we consider high-yield bonds, they may be considered in the bond asset class, yet their risk may be driven largely by the equity markets.
Breaking down each of the investment options by risk factors allows us to consider how the investment options may respond to different economic environments. As you can see in Figure 3.6, stocks, bonds, and real assets may respond differently to the economic factors of inflation and growth. For example, a high-growth economic environment favors stocks, but only when inflation is low—when both inflation and growth are high, the environment favors commodities. When inflation is high but growth is low, TIPS are the preferred asset class. Finally, when both growth and inflation are low, investors should consider bonds.

FIGURE 3.6 Asset Class Performance Is Dependent on the Economic Environment
Source: PIMCO. For illustrative purposes only.
Ultimately, we believe plan fiduciaries should seek to balance the risk across the investment choices offered. One way to think about the menu is like a scale—as shown in Figure 3.7—which can balance equity risk with other risk types, such as risks within capital preservation, fixed income, inflation-hedging assets, and possibly additional diversifying strategies.

FIGURE 3.7 Balancing Investment Menu Risk by Adding Diversifying Assets
Source: PIMCO. For illustrative purposes only.
DC Plan Investment Choices: Farewell to Company Stock?
Plan fiduciaries often ask how to manage company stock in the core investment lineup. Plans that do not offer company stock are unlikely to add this option, given the risk that participants may overallocate to an undiversified security, plus the added risk of being overexposed to that company—for instance, if the employee is laid off and the value of the stock falls at the same time. That’s a double whammy fiduciaries try to avoid. Given this risk and company stock litigation, fiduciaries are wise to not add company stock to a DC plan. For plans that offer stock, fiduciaries consider how best to manage this risk.
The Plan Sponsor Council of America’s 58th Annual Survey of Profit Sharing and 401(k) Plans reflecting 2014 plan experience found that 19.0 percent of all plans make company stock available as an investment option and 16.0 percent of all plan assets are invested in this option. Company stock is most prevalent among the largest plans (5,000+ participants) where 43.8 percent of plans make the option available and 17.2 percent of plan assets are invested. About a third of plans (30.4 percent) limit the amount of plan assets that can be invested in company stock, while over a third (36.7 percent) make contributions in company stock. Among plans that offer company stock, 42.1 percent of them have less than 10 percent of plan assets invested in the stock, while 6.6 percent of plans report that more than 50 percent of plan assets are invested in company stock.
In 2014, we sat down with James O. Fleckner, Partner and ERISA Litigation Practice Leader at Goodwin Procter LLP, to talk about defined contribution litigation, how plan sponsors reduce the risk of litigation, and how company stock fits into DC plans.
According to Fleckner, there are two primary DC litigation areas: first, lawsuits involving fees, and second, cases involving company stock, which often relate to a drop in the stock price and are thus referred to as “stock-drop” cases. In order to protect themselves against lawsuits, Fleckner comments:
Plan sponsors should understand and fulfill their fiduciary duties. These include the duties of loyalty, prudence, diversification, and fidelity to plan documents. Loyalty focuses plan sponsors on doing what is in the best interest of participants, rather than on what may be of value to themselves or their company. We’ve seen this duty raised in cases that have alleged that the plan fiduciaries cared more about saving money for the company than they did about doing what was right for the participants.
Stock-drop lawsuits arise when a company DC plan includes company stock, which then drops in value. Most often, claims in these cases allege imprudent selection and maintenance of a sponsor stock on a 401(k) lineup, improper monitoring of other fiduciaries and investment options, and concealment or misrepresentation of material facts. In 2014, a Supreme Court decision on a stock-drop case was issued in Fifth Third Bancorp v. Dudenhoeffer, which was about offering company stock to DC plan participants.
Fleckner told us that the best litigation defense against a stock-drop case is “having a documented, conscientious process for evaluating company stock. Process is an important defense for fiduciaries. Documentation should reflect the deliberation and process followed by the fiduciaries in making a decision about company stock. With the Supreme Court saying, in the Fifth Third case, that prudence trumps the plan document, a plan sponsor would not have a complete defense to a stock-drop suit in saying that ‘I just followed what the plan said.’ ”
Companies may also want to consider hiring an independent fiduciary to oversee the ongoing evaluation of the stock and its appropriateness for the plan. Unlike other investment options in the plan, company stock has no obvious benchmark. Hiring an independent fiduciary allows a disinterested professional to evaluate the stock, and it eliminates the concern with inside information. It is important to note, however, that courts have also said that a plan sponsor who has some fiduciary responsibility under a plan document cannot fully offload its responsibility by hiring an independent fiduciary. Instead, the sponsor would likely still need to evaluate, hire, and monitor the independent fiduciary’s work.
The issue or risk of company stock in DC plans can also be seen when the stock is removed from the plan. Comments Fleckner, “We have seen stock-drop cases alleging that the plan sponsor forced the participants to sell and forced them to lock in losses, claiming that the participants were robbed of a future increase in the stock’s price.”
Reduce Company Stock Exposure with “Sell More Tomorrow”
Plan fiduciaries often ask how they can help reduce participants’ allocation to company stock. As noted above, about a third of plans may limit the percentage of assets that may be allocated to company stock. Others may consider ways to help reduce the stock allocation over time. One idea from behavioral economists is to implement a dollar-cost averaging way to slowly sell out of company stock over time.
In PIMCO’s June 2007 DC Dialogue, and updated at the time of writing, University of Chicago Professor Richard Thaler told us about the work he had been undertaking in this area with his fellow behavioral economist colleague Shlomo Benartzi, at the UCLA School of Management. In particular, Dr. Thaler told us that “plan sponsors who find that participants have high concentrations of their retirement wealth invested ought to work on reducing that.” He added, however, that many plan sponsors are reluctant to announce a major sell-off of their stock by employees, either because it appears to show a lack of confidence in the stock or employees might complain if the timing were unfortunate. “That is why I think the best approach is to help participants reduce their positions in company stock gradually,” he noted. He explained:
To address this, Professor Shlomo Benartzi and I have come up with the program “Sell More Tomorrow.” We’re looking for a plan sponsor willing to try the approach. The idea is gradually to sell off stock automatically over several years until the participant divests down to a reasonable holding—say, a 10 percent cap. The money earned by selling company stock would be invested in the firm’s default investment fund (unless the employee chooses something else).
This plan addresses plan sponsors’ concerns of a sudden sell-off, as well as the fear that removing it from the plan sends a negative signal about the stock. We suggest sponsors implement Sell More Tomorrow as an opt-out. Given a gradual stock sell down, people won’t worry about divesting at exactly the right or wrong moment. Rather, they benefit from dollar-cost averaging. Effectively, this can reduce the risk of holding a single security and prevent the unfortunate situation we saw at Enron.
As plan fiduciaries decide how best to address company stock issues, they may be best advised to seek assistance from ERISA counsel.
Evolution of Investment Menu Design
With balance in mind, many plans have migrated from a style box approach to an asset class or even an ultra-simplified risk pillar approach, in which the primary driver of returns is identified. As shown in Figure 3.8, the number of diversifying asset classes increases, yet the number of choices decreases as the menu shifts from the style-box focus to an asset-class focus and finally to a risk-pillar approach. In considering the approach to offer, plan fiduciaries may ask, “If a participant allocates evenly across the core investment lineup, what portfolio would result?” Then, the fiduciary can consider the risk and return characteristics for this naive diversification portfolio.

FIGURE 3.8 Core Lineup Trends in DC Plans: From Style-Box Focus to Risk-Pillar Focus
Source: PIMCO. For illustrative purposes only.
Comparing the three approaches on a naive diversification basis gives us the following characteristics as shown in Figure 3.9. As you can see, in the hypothetical example risk-adjusted returns improved as core lineup design moves from the style-box focus to an asset-class focus and then to the risk-pillar focus. While the risk-pillar shows lower return at 3.63 percent, volatility is also significantly lower at 7.71 percent. Notably, the risk of loss dropped in half from 21 percent in a single year to 10.51 percent. Also, you can see the lower correlation to the equity markets in the risk-pillar approach.
FIGURE 3.9 Comparing the Characteristics of Three Approaches to Investment Plan Design
| Style-Box Focus | Asset-Class Focus | Risk-Pillar Focus | |
| Estimated return | 4.04% | 3.70% | 3.63% |
| Esimated volatility | 14.21% | 8.90% | 7.71% |
| Sharpe ratio1 | 0.17 | 0.23 | 0.26 |
| Loss potential2 | -21.00% | -12.25% | -10.51% |
| Correlation to S&P 500 | 0.96 | 0.93 | 0.86 |
For illustrative purposes only.
For indices, return estimates are based on the product of risk factor exposures and projected risk factor premia. The projections of risk factor premia rely on historical date valuation metrics and qualitative inputs from senior PIMCO investment professionals. Other factors include slope, convexity, country, swap, municipal spread factors, and Idiosyncratic (specific) risk.
1Sharpe ratio is calculated as estimated return minus the return estimate for cash, 1.72 percent, divided by estimated total volatility.
2Loss potential is proxied by Value-at-Risk (VaR) at 95 percent confidence level.
VaR is an estimate of the minimum expected loss at a desired level of significance over 12m horizon.
Source: PIMCO, as of December 31, 2015.
Active versus Passive Approaches: DC Consultants’ Views
Once the number and types of investments are identified, plan fiduciaries may then consider whether each investment choice should be actively or passively managed, or rely on a blend such as multimanager or white-label approaches. Data from the PSCA (2014), shown in Figure 3.10, shows that plan sponsors commonly offer both active and passive investment choices. While 77.7 percent of plans offer passively managed equity such as the S&P 500, only 53.9 percent of plans offer passively managed fixed income. This difference is partly explained by relative performance: The median active intermediate U.S. fixed income manager has historically outperformed the benchmark (i.e., the Barclays U.S. Aggregate Bond Index), whereas the median active U.S. large blend manager has failed to beat the S&P 500 Index benchmark.

FIGURE 3.10 Active versus Passive Approaches in DC Plans
158th Annual PSCA Survey.
2Morningstar: Based on median peer group returns for Intermediate-Term Bond (Passive) for fixed income and U.S. Large Blend (Passive) for equities.
3Equities benchmark represented by the S&P 500 index; fixed income benchmark represented by Barclays U.S. Aggregate Bond Index.
Sources: eVestment, Morningstar, PIMCO, Bloomberg Barclays, as of December 31, 2015.
Looking specifically at investment choices for fixed income, there are many reasons that passively investing in fixed income is suboptimal and must be differentiated from equity index investing. In a 2014 PIMCO Viewpoint by James Moore, PhD, titled “Sorry, Mr. Bogle, But I Respectfully Disagree. Strongly,” Moore summarizes five reasons why, in his view, active bond investing should be viewed distinctly from passive equity investing. These are: the variety of investor objectives other than maximizing total return, the mechanics of bond index construction, the importance of the new-issue market for bonds, the predominance of over-the-counter transactions, and the highly skewed returns on individual bonds versus stocks.
Consultants agree with Dr. Moore on the importance of actively managed fixed income globally. As shown in Figure 3.11, nearly all of the consultants (98 percent) surveyed in 2015 believe it is very important or important to actively manage non-U.S. bonds, while 92 percent believe the same for U.S. bonds. Notably, the majority of consultants also say active management is very important or important for emerging-market and small-cap equity as well as target-date, balanced strategies, commodities, and real estate investment trusts (REITs); however, the group views active management of TIPS and U.S. large-cap equity as less important. This data underscores the importance of including active management among the core and particularly within the default investment strategies, for example, target-date funds.

FIGURE 3.11 PIMCO Defined Contribution Consulting Support and Trends Survey 2016: The Importance of Active Management in DC Plans
Source: PIMCO, 2016 Defined Contribution Consulting Support and Trends Survey.
Consultants also shared their views on which asset classes should be active only, passive only, an active/passive blend, or provide multiple active and passive strategies or mirrored active and passive (e.g., a large-cap passive and a large-cap active fund). As show in Figure 3.12, the majority of consultants (80 percent) recommend active only for capital preservation. In fact, not one suggested passive only for fixed income, and instead over a third (37 percent) recommend active only while another 25 percent suggested a blend. These responses were similar for equity and inflation-protection assets; the majority suggests either a blend or multiple active and passive equity options, while over a third suggest active only for inflation protection (37 percent) or an active/passive blend (42 percent). Notably, a fifth or fewer of the consultants suggested offering a mirror of active and passive fixed income or equity choices.

FIGURE 3.12 Consultant Views on Management Approaches for Various Investment Strategies
Source: PIMCO, 2016 Defined Contribution Consulting Support and Trends Survey.
Active versus Passive: Reduced or Heightened Litigation Risk?
Plan fiduciaries often ask whether they may be more insulated from litigation if they offer passively managed index funds, versus actively managed investments. ERISA attorneys tell us that plan sponsors should focus on prudent choices with “reasonable”—not necessarily the lowest—fees. Plans are not required to offer passively managed or the cheapest investment choices.
In the October 2014 PIMCO DC Dialogue, ERISA attorney James O. Fleckner told us that “the focus in the cases challenging investment management fees is usually on the fund itself, not necessarily on whether it is actively or passively managed. At the same time, fiduciary committees may have specific views about whether active management is worth the additional cost; and may decide that active management is the best way to allow participants to maximize outcomes and minimize downside risk, or that participants should be given a choice between active and passive investing. Those all seem to me to be perfectly defensible decisions,” comments Fleckner, “and judges [in lawsuits arising on investment management fees] typically do not like to second-guess informed fiduciaries.”
The DOL requires plan fiduciaries to understand plan fees and expenses. In support of this outcome, the DOL has published a guide, Understanding Retirement Plan Fees and Expenses (available online at the DOL website at www.dol.gov) to help plan sponsors understand their responsibilities. The guide explains why to consider fees:
Plan fees and expenses are important considerations for all types of retirement plans. As a plan fiduciary, you have an obligation under ERISA to prudently select and monitor plan investments, investment options made available to the plan’s participants and beneficiaries, and the persons providing services to your plan. Understanding and evaluating plan fees and expenses associated with plan investments, investment options, and services are an important part of a fiduciary’s responsibility. This responsibility is ongoing. After careful evaluation during the initial selection, you will want to monitor plan fees and expenses to determine whether they continue to be reasonable in light of the services provided.
There are many types of fees that may be imposed within plans. The DOL outlines three categories for plan sponsors to consider: plan administration such as recordkeeping, investment fees generally charged as a percentage of assets, and individual service fees such as loan initiation. Investment fees tend to be the largest percentage of total plan fees; it is important to evaluate and confirm that the fees are reasonable for the value of the management. Evaluating value, in turn, should take into consideration both the opportunity to deliver returns as well as to manage risk. Plan sponsors should use their buying power to get the best price for the investment strategy and structure desired. The larger the plan assets, the greater the buying power. Plans with sizable assets may seek institutionally priced vehicles, including institutionally priced mutual funds, collective investment trusts, and separately managed trusts.
Plan sponsors can also work to leverage the organization’s buying power to add investments with the highest perceived value at the lowest price. In PIMCO’s March/February 2015 DC Dialogue, we spoke with Cindy Cattin, Managing Director of Investment Operations and Risk Management at Exelon Corporation, about how Exelon used the scale of their $35 billion retirement and other assets to drive down DC investment costs:
We have the processes and procedures in place to identify best-in-class managers, and we have the scale to drive down cost. . . . We believe that over a market cycle, best-in-class active management will outperform passive management. We believe the investment management fees are worth it given the opportunity for improved risk-adjusted returns of active managers. Despite our belief in active management, we acknowledged that some participants prefer passive management and value the lower cost of this approach. That recognition drove us to offer both active and passive choices in the core.
We spent a lot of time educating our participants on the changes and the cost differences. We explained the difference in active and passive management as well as the fees. We also showed them a comparison of costs they might incur in the retail market relative to our plan. They could see the significant cost savings our plan offers. Again, leveraging our scale drove down our costs, and we made sure participants understood that advantage.
For plan fiduciaries who select passively managed investments, there’s more work to do than simply comparing fees. Josh Cohen, CFA, Managing Director, Head of Defined Contribution at Russell Investments, comments in a January 2016 “A Conversation” article, “Going Passive Is Still an Active Decision”:
I’ve observed some sponsors pick passive investments based on the belief it can reduce fiduciary risk and due diligence requirements and obligations. But, there are still a lot of active decisions being made when passive investments are implemented, and thus meaningful due diligence requirements remain. We have identified eight of them here.
- Review the index provider’s organization
- Review the index provider’s methodology
- Review the passive fund manager’s implementation quality
- Review the fund manager’s ability to replicate the index and the costs to do so
- Review the fees charged by the passive fund provider
- Determine whether active management opportunities might be more prudent
- Review Target Date Fund glide path methodology*
- Review Target Date Fund asset allocation*
- *Additional considerations for Target Date Funds.
For a detailed look at each of the above decisions, see the November 2015 guide provided by Russell Investments on their website (at www.russell.com/institutional) called “Passive Management and the False Premise of Fiduciary Relief: Going Passive Is an Active Decision,” by Josh Cohen and Kevin Knowles. The Russell Investments January 2016 piece also points out:
One of the most important things to remember is that low fees don’t necessarily translate to better outcomes for participants. Passive funds with low cost have opportunity costs—that’s the cost of giving up potentially higher returns that active management aims to provide for some asset classes. For example, there could be a fairly significant wealth differential if participants’ actively managed funds generated 50 basis points more per year than their passive counterparts, compounded over a 40-year working career. Our analysis finds it could generate up to seven years of additional spending in retirement.
One consideration that may significantly influence fees is the investment structure selected. Plan fiduciaries should understand the alternative structures.
Investment Structure: Mutual Fund, Collective Investment Trust, or Separately Managed Account
In general, DC plans tend to invest in investment structures that pool the assets of many investors. Mutual funds are the most prevalent investment-pooling vehicle used within both DC and retail individual retirement accounts (IRAs). Each investor in a mutual fund owns shares of the fund that represents the mutual fund’s holdings. Mutual funds typically offer many share classes for different types of investors and fee arrangements. They may carry sales charges, including front-end or back-end loads and ongoing sales fees labeled “12(b)1” fees. Large DC plans tend to seek funds that carry no sales charges; rather, they seek the lowest-cost, institutionally priced share class that covers the fund’s management and administrative fees.
Unlike retail retirement accounts such as IRAs, ERISA plans including 401(k)s have the ability to invest in bank- or trust company–managed trust funds; these include collective investment trusts (CITs) and separately managed trusts. Similar to a mutual fund, a CIT pools investments of tax-qualified assets such as DB plans, profit-sharing plans, government employee benefit plans, and again 401(k)s. (Note that non-ERISA plans such as 403(b)s and endowments/foundations are generally excluded from participating in CITs.)
Each CIT investor has a proportionate interest in the trust fund assets. For example, if a collective investment fund holds $10 million in assets and your investment in the fund is $10,000, you have a 0.1 percent interest in the fund. As with mutual funds, collective investment funds may have a variety of investment objectives. There are no front- or back-end fees associated with a collective investment fund, but there are investment management and administrative fees. As shown in Figure 3.13, CIT fees may be considerably lower than mutual fund fees, yet this is not always the case—so each available investment structure should be considered. Notably, CITs allow investment managers to vary their fee based on account size; this is not the case for mutual funds which hold the management fee constant, but may vary the distribution, operation and, other costs. The Callan Investments Institute estimates that 70 percent of DC plans offer at least one CIT-structured investment choice. Assets in CITs in 2015 were estimated to exceed $2.3 trillion according to the Coalition of Collective Investment Trusts.
FIGURE 3.13 Mutual Fund and Collective Investment Trust Fund Fee Differentials on an Assumed $50 Million Mandate
| Asset Classes | Mutual Fund (%) | Collective Fund (%) |
| Intermediate-Term Bond | 0.58% | 0.28% |
| Large Value | 0.80% | 0.55% |
| Large Growth | 0.80% | 0.59% |
| Small Value | 1.19% | 0.90% |
| Small Growth | 1.00% | 0.90% |
| International | 0.97% | 0.70% |
Source: Callan Investments Institute, March 31, 2016.
While operationally CITs and mutual funds function similarly, there are other considerations for CITs relative to mutual funds. Most importantly, there is a difference in the regulatory oversight of mutual funds, which are registered with the Securities and Exchange Commission (SEC) and follow SEC rules and guidelines; whereas CITs are regulated by banking authorities; for federally chartered banks, by the Office of the Comptroller of the Currency (OCC), an independent bureau within the United States Department of the Treasury; and for state banks, by the state banking authorities (which largely defer to the OCC rules). Notably, CITs are subject to ERISA law while mutual funds are not. DOL, IRS, and potentially Commodities Futures Trading Commission (CFTC) rules/law also apply. To participate in a CIT, the plan fiduciary must adopt the terms of the CIT through the execution of a participation or joinder agreement. This requirement does not exist for mutual funds. Given these different governance structures, trading restrictions, redemption fees, and SEC 22c-2 regulations (which govern specific mutual fund redemption fees) do not apply in CITs as they may for mutual funds.
For more information on CITs, readers may want to visit the website of the Coalition of Collective Investment Trusts website (www.ctfcoalition.com).
Another type of trust structure that large plans may consider is a separately managed trust or separate accounts. This type of offering allows the plan to tailor the investment guidelines of the fund, and not pool assets with other investors. Separate accounts may pool both ERISA DB and DC assets via a master trust arrangement, thereby gaining pricing and oversight advantages for both plans. Typically, fees for separate accounts are on a sliding scale, declining as assets grow. These fee schedules often level off at around $300 million in assets under management, according to the Callan Investments Institute. Keep in mind that investment management fees are just one component of separate account costs; additional fees for trust services or other costs may range from four to over ten basis points.
FIGURE 3.14 Comparison of Mutual Funds and Collective Trusts (CITs): Similar but Not Identical
| Mutual Funds | Collective Trusts | |
| Pooled Vehicle | Yes | Yes |
| Regulation | Registered with SEC | Overseen by OCC, DOL |
| Governing Document | Prospectus | Plan Document (Declaration of Trust) |
| Enrollment Requirements | According to prospectus | Investment management or trust agreement |
| Availability | Available to general public | Limited availability |
| Portfolio Composition | Pooled | Pooled |
| Valuation | Daily | Not always daily |
| Clearing | NSCC | NSCC |
| Advertisement | Yes | No |
| Ticker Symbol | Yes | No |
| Third-Party Coverage | Yes | Some |
| Operational Oversight | Board of Directors | Bank as Trustee |
For more information on CITs, readers may want to visit the website of the Coalition of Collective Investment Trusts web site (at www.ctfcoalition.com).
Source: Callan Investments Institute, 2016.
Understand Revenue Sharing: Consider Paying Administration and Other Plan Fees
For plans that select mutual funds, they need to carefully consider the share classes available and whether revenue sharing, which is commonly used to help offset recordkeeping or other plan costs, is offered. Revenue sharing may be available from mutual fund share classes that include fees such as distribution 12(b)1, subtransfer agency, shareholder servicing, profit-sharing payments, or other fees. The DOL refers to these fees as indirect payments. Note that plaintiff attorneys may often view revenue sharing as padding a mutual fund’s expense ratio with general plan administration, marketing, and other noninvestment-related fees, then passing these expenses to participants—often without ensuring they understand the costs.
Mutual funds typically offer a range of share classes that may or may not offer revenue sharing. For instance, a Class A share class may include a 12(b)1 fee based on a percentage of assets (typically 0.25 percent, paid annually by investors). Alternately Class R, also known as retirement-class shares, may include, for example, an administrative services fee of 25 basis points; this fee income, based on DC assets allocated to the funds, is often shared directly with the recordkeeper to offset the cost of services. For instance, if recordkeeping costs total $500,000, this cost may be reduced by the revenue sharing from funds (e.g., $100 million invested with 0.25 percent revenue sharing provides $250,000 in revenue, thus reducing plan fee costs by 50 percent).
Mutual funds often offer Class I shares, also known as institutional-class shares, typically available only to institutional investors making large fund-share purchases. With minimum investments often of $1 million or more, this class of shares is out of reach for most retail investors—but not DC plans. By pooling the assets across participants, the DC plan may thus offer these institutional share classes to all participants regardless of their individual DC account balances. What plan sponsors need to be wary of, however, is whether revenue sharing is attached to these share classes; while they are institutionally priced, they may nonetheless include a small amount of revenue sharing (e.g., 15 basis points or less) to recordkeepers or others. In 2012, Congress enacted fee disclosure requirements with ERISA 408(b)(2). These rules support a plan sponsor’s ability to gather and evaluate all fees and revenue-sharing arrangements. In fact, 408(b)(2) made it clear that plan fiduciaries have a duty to monitor and control service provider fees.
While revenue sharing may appear attractive, plans increasingly are moving away from any revenue-sharing funds, seeking rather the lowest cost for investment management and managing other plan costs such as recordkeeping separately. In fact, consultants suggest both evaluating fees and moving away from revenue sharing as two of the most important actions plan fiduciaries can take, both to fulfill fiduciary duty and to reduce litigation risk. In PIMCO’s Defined Contribution Consulting Support and Trends Survey, 2016, in order to manage fiduciary risk, the vast majority of consultants (86 percent) suggest benchmarking plan costs; and over half (54 percent) recommend that plan sponsors move away from revenue sharing funds. Some plan sponsors not only have moved away from revenue sharing, but also have decided to cover plan fees as a benefit cost—they may cover administration or include all costs, even investment management. Karen Barnes, former ERISA Counsel at McDonald’s Corporation, shared with us in PIMCO’s December 2007 DC Dialogue:
Our company covers all plan administrative fees, except for loan origination, which the participant pays. Participants pay the investment management fees of the funds in which they invest. We try to use separate accounts or institutional funds to minimize investment management expenses. So plan participants cover investment fees, which are disclosed to all participants in our annual explanation-of-fees report, but don’t cover administrative fees.
While rare, some companies cover not only DC administration fees, but also investment management costs. For instance, Gary Park, Director of Trust Investments at Schlumberger, shared with us in PIMCO’s September/October 2015 DC Dialogue:
The U.S. [DB] plan closed in 2004, and our international DB plan closed in 2014. In exchange for DB, we have enhanced our DC plans, including increasing the employer contribution and covering all DC fees—investment management and administration. While our total cost of running the DC plans may be higher than the DB plans, we prefer the known cost of DC relative to the unknowns of DB, such as the volatility in pension expense, liquidity requirements and balance sheet impact. The trend is in just one direction—toward DC plans.
To offset DC plan cost coverage, plan sponsors may consider offering a lower employer match. However, reducing a match may be viewed as a “take away” (of a benefit previously offered to employees) so the communication to participants requires conveying the value of the employer-covered fees. By covering fees outside the plan, participants’ accounts may grow more rapidly over time. Employers who are closing a DB plan and considering compensating with an unmatched or higher-matched DC contribution may thus consider cost coverage and a lower contribution increase.
Blended Multimanager or White-Label Investment Options
Many plans offer one or multiple blended core options. In PIMCO’s 2015 Defined Contribution Consulting Support and Trends Survey, over two-thirds of consultants said they actively promote or support client interest in fixed income (70 percent), equity (72 percent), and real asset (69 percent) multimanager/white-label core structures. Support for multimanager/white–label alternative strategies is weaker, but still promoted or supported by over half (53 percent) of consultants.
In PIMCO’s 2016 Defined Contribution Consulting Support and Trends Survey, respondents reported a total of $330 billion in white-label/multimanager assets across their clients. They anticipate, at the median, that another 10 percent of their clients will implement these strategies in the next three years. The majority of consultants suggest plans with over $500 million in assets consider a white-label/multimanager approach.
In summary, there are many potential benefits to these types of strategies, including the following.
- Simplicity: Mutual fund names can be confusing, and sponsors want to consolidate the number of options. White-labeling can help simplify the core offering and enhance clarity for participants, leading to increased likelihood of better decisions.
- Improved diversification: Single-manager risk can be reduced while improving diversification and increasing the potential for higher alpha by combining “best-of-breed” managers. White-labeling also allows the addition of more volatile asset classes (e.g., emerging markets) without exposing participants to the risk of investing directly in these higher-risk options. Increased diversification may lead to reduced volatility, which can also help guard against behavioral mistakes of chasing high performance or fleeing from a fund or the plan altogether given poor performance.
- Reduced costs: Plans can potentially reduce costs by:
- Using a combination of active and passive investment strategies, and
- Benefiting from relationship pricing by leveraging the same managers (e.g., those used in a DB plan if available)
- Increased flexibility: Plan sponsors have increased flexibility to add or replace fund managers within a white-label/multimanager structure without altering the lineup from the participant perspective or requiring broad communication that can be onerous, time-consuming, and costly. Due diligence and investment monitoring may also be eased by using white-label structures.
Figure 3.15 outlines the traditional and white-label/multimanager approaches, including the potential drawbacks of the traditional approach and the benefits of the white-label/multimanager approach.

FIGURE 3.15 Traditional and White-Label/Multimanager Investment Options Compared
Source: PIMCO. For illustrative purposes only.
Plan fiduciaries must also consider some potential concerns with white-label/multimanager approaches. These are summarized along with potential solutions in Figure 3.16.
FIGURE 3.16 Challenges in White-Label/Multimanager Investment Options
| Consideration | Concern | Solution |
| Simplified Investment lineup | Some participants want more granular options | Generally applies to small subset of participants; needs can be addressed with brokerage window |
| No Ticker Symbol | Fund data is not publically available | Make data readily available on web portals, which participants are increasingly accustomed to using |
| Short Historical Performance | Participants lack information to make informed decisions | ▪ Historical composite performance can be made available through appropriate disclosure ▪ Stress the fund’s desired outcome versus past performance |
| Challenging Communication | Participants may not understand underlying investment strategies | ▪ Underlying investments can be reported similarly to target-date fund communications ▪ Redirect participant focus to benefits of the strategy rather than underlying investment |
| Implementation | Costs associated with developing fund structure, record keeper fees, and trustee’s fees for fund administration | ▪ Additional costs may be offset by lower manager change costs, improved investment performance, and/or lower underlying investment management fees ▪ Leverage partners with strong expertise in implementing white-label strategies |
Source: PIMCO, 2016.
TIER III: “DO-IT-MYSELF” MUTUAL-FUND-ONLY OR FULL BROKERAGE WINDOW
Brokerage windows can be defined as a type of defined contribution plan investment choice that allows plan participants to select a much larger number of investments from a brokerage provider. These plans enjoy the same tax advantages as regular defined contribution investment choices. As discussed earlier, brokerage windows can allow a participant to invest in only mutual funds, or to invest in both mutual funds and individual securities. The 58th Annual PSCA Survey reports that 29 percent of all plans have brokerage windows; notably, 39 percent of the largest DC plans (i.e., those with more than 5,000 participants) offer brokerage windows as an option. The PSCA also reports that assets allocated to the brokerage option are meager at 4 percent across all plan sizes.
Consultants are split on whether offering a brokerage window makes sense. In PIMCO’s 2016 Defined Contribution Consulting Support and Trends Survey, 25 percent recommend a mutual-fund-only window, and 22 percent suggest full brokerage, while over a third (35 percent) advised against offering either type of window. While only a small fraction of DC plan participants will likely invest via a brokerage window, providing this option may help plan sponsors streamline the core menu without the perceived “take away” of investment choices.
In March 2011, DC Dialogue talked with Mark A. Davis, Senior Vice President, Financial Advisor, CAPTRUST Financial Advisors, about the inclusion of a brokerage tier. He shared the following:
We may suggest a brokerage account capability of some sort for what I call “hyper-engaged” people—the kinds of folks who want, for example, the gold fund and various sector funds. This group may have more customized needs or advisors who can help them.
I’m a big supporter of giving my clients a brokerage capability, as long as it’s appropriately documented that participants have the chance to use the target strategies or traditional core funds that are monitored and overseen by the sponsor and our firm. But if participants willingly accept the risks of going outside that circle, then there’s a real place to use the brokerage account.
He goes on to talk about the types of companies that may find brokerage most appealing:
It depends on the construct of the company. For some organizations, like professional service firms, again, as long as it’s documented properly, I think full brokerage is more than reasonable. Companies with a more diversified workforce may want to stick just their toes in the water and go mutual funds only. Honestly, I think that once you go into the brokerage world, you might as well open it up to everything, including stocks, bonds, ETFs, and mutual funds. The important thing is making sure the fiduciary is protected, that the participant signs the piece of paper that says, “I know I can have the core, but I willingly choose to accept the cost and the risk of this other option.”
From a behavioral perspective, just knowing more choice is available may increase participants’ overall plan satisfaction even for those who do not use this offering. On the other hand, many plan fiduciaries prefer not offering such broad choice given concerns that participants may invest unwisely—such as chasing a hot stock tip or selecting a high-priced share class of a mutual fund. What’s more, plan fiduciaries may be concerned with potential future DOL regulations that may affect brokerage windows, such as a duty to monitor brokerage-window investments by participants under a prudence standard. At this time, the 404(c) regulation limits the duties to prudently select and monitor investments to designated investments as defined in the regulations. That definition does not included unspecified brokerage-window investments. While DC experts do not expect this to change, we nevertheless need to keep watch on DOL action related to brokerage windows.
CONSIDERING AN OUTSOURCED CHIEF INVESTMENT OFFICER
Plan fiduciaries may prefer delegating responsibility for the selection, oversight, or management of the core investment lineup. As more plan sponsors acknowledge a lack of resources or expertise to manage their investment lineup, they may turn for help to an existing consultant relationship or another provider. In PIMCO’s 2016 Defined Contribution Consulting Support and Trends Survey, consultants at the median reported that 5 percent of their clients use their discretionary services and that over the next three years, they expect 14 percent to do so. Consultants tell us they believe many factors, outlined in Figure 3.17, may drive growth in delegated services; at the top of this list is the perceived mitigation of fiduciary risk and the ability to hand over the reins on investments.
FIGURE 3.17 Factors Driving Growth in Delegated Services
| Factors Driving DC OCIO Growth | |
| Perceived mitigation of fiduciary risk (e.g., litigation) | 80% |
| Ability to hand over reins on investments | 78% |
| Clients outsource DB already and wish to do the same with DC | 49% |
| Desire multimanager custom strategies and prefer to fully delegate this outside | 43% |
| Costs may be lower | 35% |
| Ability to hand over reins on administration | 28% |
| Access to investment managers may increase | 23% |
| 11% | |
Other: time saver for committees; lack of internal resources; corporate reorgs/spinoffs; perceived improved participation; committee fatigue.
Source: PIMCO, 2016 DC Consulting and Trends Survey.
Consultants in PIMCO’s 2016 Defined Contribution Consulting Support and Trends Survey noted the following delegated services (i.e., 3(38) services) that have grown the most over the past year and the percentage of consultants that provide each of these services. As outlined in Figure 3.18, about a third of the respondents have experienced the most growth in a broad range of investment manager selection and due diligence categories; in the right column, you can see that over two-thirds of the consulting firms provide such services.
FIGURE 3.18 Top Discretionary Services Growth and Availability by DC Plan Consultants
| Discretionary Services | Top Five Growth Areas | Consultants Who Provide |
| Measure, monitor, and negotiate fees | 34% | 67% |
| Conduct/document due diligence on managers | 33% | 78% |
| Conduct manager searches | 33% | 81% |
| Decide when to replace managers | 33% | 78% |
| Decide menu of investment choices | 31% | 77% |
| Develop multimanager/white-label portfolios | 30% | 53% |
| Develop custom glide path | 25% | 63% |
| Decide mapping policy | 22% | 69% |
| Decide investment default | 19% | 66% |
Source: PIMCO, 2016 DC Consulting and Trends Survey.
IN CLOSING
In this chapter, we’ve started to dig into the nitty-gritty of investment plan structure, including how plan structure has evolved over the past three decades. We explored the ways in which options for plan participants have moved from simplistic asset allocation questionnaires and tools in the 1980s to today’s sophisticated and professional solutions designed to help ensure participants are best set up for retirement success. We also reviewed the regulatory requirements under the ERISA that set out minimum standards for the kinds of investment choices plans must offer participants.
Today, target-date funds are the most prevalent DC investment default, followed by target-risk or balanced funds. Yet, these strategies are rarely offered alone. Rather, participants typically are given a core investment lineup as well, allowing them to create their own asset allocation. Plus, about a third of DC plans also offer participants a brokerage window, whether for access to mutual funds only or to full brokerage. As a rule, behavioral economists generally support this multitier structure as an improvement over simply presenting participants with a long list of funds from which to make choices.
As a result of their evolution over time, today’s plans may offer a full range of options for participants so they may select the amount of direct involvement they want in allocating their plan assets. Options can range from “do it for me” (lots of plan sponsor involvement) to “help me do it” (a balance of participant and sponsor involvement), to “let me do it” (an option in which the plan sponsor facilitates the participant’s asset allocation decisions). Today’s plan design is also informed by insights from the field of behavioral finance, which explores how plan participants make decisions—including the pitfalls, such as naive diversification, that can thwart the intentions underlying plan design.
In this chapter, we’ve also touched on a variety of topics that are important considerations in plan design, including the role of company stock in DC plans, the active versus passive decision with respect to the options for managing plan assets, and the choice of mutual funds, collective investment trusts, or separately managed accounts for plan investment options.
In creating the appropriate investment structure, plan fiduciaries should consider many factors including behavioral, investment, cost management, and oversight for plan fiduciaries. Most important in the investment menu is the plan’s investment default option, most commonly target-date strategies. In the next chapter, we will look in depth at this important investment choice.
QUESTIONS FOR PLAN FIDUCIARIES
- Should we offer multiple investment tiers?
- What type of investment default is appropriate?
- How many investment options should be offered on the core lineup?
- What asset classes or risk categories should be offered?
- Should the options be actively managed, passively managed, or both?
- What investment structures should be used: mutual fund, CIT, or separately managed account?
- Does multimanager/white-labeling make sense for any of the core choices?
- Should some or all of the investment oversight be delegated?