
Chapter 11: Operationalizing Data and ML Pipelines
In the previous chapters, we saw how Delta helps to democratize data products and services and facilitates data sharing within the organization and externally with vendors and partners. Creating a Proof of Concept (POC) happy path to prove what is feasible is a far cry from taking a workload to production. Stakeholders and consumers get upset when their reports are not available in a timely manner and, over time, lose confidence in the team's ability to deliver on their promises. This affects the profitability metrics of the business.
In this chapter, we will look into the aspects of DevOps that harden a pipeline so that it stands the test of time and people do not end up spending more time and effort maintaining the system than was required to create it. There is a checklist of items to consider, such as SLAs, high availability, data quality, and automation, that every production pipeline should consider as part of its design and implementation. In particular, we will look at the following topics:
- Why operationalize?
- Understanding and monitoring SLAs
- Scaling and high availability
- Planning for disaster recovery
- Guaranteeing data quality
- Automation of CI/CD pipelines
- Data as code – an intelligent pipeline
Let's look at how Delta can help harden and operationalize data and ML pipelines.
Technical requirements
To follow the instructions of this chapter, make sure you have the code and instructions as detailed in this GitHub location: https://github.com/PacktPublishing/Simplifying-Data-Engineering-and-Analytics-with-Delta/tree/main/Chapter11.
https://delta.io/roadmap/ is the list of features coming to open source Delta in the near future. This chapter refers to some of them, including Delta clone.
We discuss a Databricks-specific feature called Delta Live Table (DLT) to give an example of what to aspire for in an intelligent pipeline.
Let's get started!
Why operationalize?
Consistently bringing data in a timely manner to the right stakeholders is what data/analytics operationalization is all about. It looks deceptively simple, but only about 1% of AI/ML projects truly succeed, and the main reasons are a lack of scale, a lack of trust, and a lack of governance, meaning that not all the compliance boxes are checked to deliver the project within the window of opportunity. The key areas that need attention to enable this include getting complete datasets, including unstructured data, which is the hardest to tame, accelerating the development process by improving means of collaboration between data personas and having a well-defined governance and deployment framework.
By now, the medallion architecture should be a familiar architecture blueprint construct. It is to be noted that in the real world, several producers, several pipelines, and several consumers criss-cross. Each pipeline transforms and wrangles data based on the requirements of the business use case. Ideally, that is what the data personas truly care about. Unfortunately, this is a small part of their overall responsibility. It is a given that no matter how well a pipeline has been tested, it will encounter some errors, therefore gracefully recovering is an important consideration. It is further exacerbated by pipeline dependencies. We need to know when an error occurs. Sometimes the pipeline runs as usual, but the processed data has degraded in quality. That is as good as a failure and needs to be monitored and reported.
Other things that need to be taken care of but can sometimes be overlooked include the partition strategy, dependency management with other tasks and pipelines, checkpointing the state of the pipeline and providing for retries to account for transient glitches in the ecosystem, version control, quality checks, ensuring good cataloging practices for data discoverability, data governance (which includes access privileges and audit trails), and promoting workloads to different environments by creating the underlying infrastructure, among others.
To reiterate, maintaining data quality and reliability at scale day in and day out is a non-trivial task, and even when all the ancillary factors have been considered, the process can be fairly complex. So, anything that can be done to templatize and create reusable components that can be tested and automated goes a long way towards shortening the end-to-end life cycle from development to production. Data is being generated at an enormous pace and it is not surprising that streaming pipelines are becoming the norm to ensure better end-to-end latency.
Understanding and monitoring SLAs
A Service Level Agreement (SLA) is part of an explicit or implicit contract attesting to certain service quality metrics and expectations. Violation of some of these could result in penalties, fines, and loss of reputation. There is usually a cost and service quality tradeoff. So, it is important to articulate the SLA requirements of each use case and describe how it will be measured and tracked so that there is no ambiguity of whether it was honored or violated. There should also be clear guidance on how SLA violations are reported and the obligations and consequences on behalf of the service provider to remedy or compensate for the breach.
There are several types of SLA, and common ones include metrics for system availability, system response time, customer satisfaction as measured by Net Promoter Score (NPS), support tickets raised over a period of time, defect/error tickets and the response time to address them, and security incidents. It is important to distinguish SLAs from KPIs. SLAs refer to compliance expectations, whereas business KPIs are metric indicators.
Latency, cost, and accuracy are key requirements. Let's look at some examples of SLAs:
- The end-to-end data availability from ingestion to consumption is 5 minutes.
- The availability of the service is 99.99% every year.
- The durability of the data is 99.9999% across multiple availability zones (AZs).
- Data should be encrypted both at rest and in motion.
- The maximum query response time of any analytic query on the system is 3 minutes.
Architecting the compute horsepower of clusters requires selecting the right attributes and is determined by the use case being considered. You can think of common SLAs in the context of workload types:
- Batch: The volume of data that can be handled by a batch
- Streaming: The Transactions/Events per second (TPS)
- BI: The end-to-end latency and concurrency that can be tolerated
- High Availability: The response time to a request
- Disaster Recovery: Recovery Time Objective (RTO) and Recovery Point Objective (RPO)
Now let's look at examples of KPIs:
- Employee turnover should be less than 10%.
- Year-over-year growth should be 15%.
- Incoming ticket volume should be 25 per day.
- NPS score should be greater than 8.
Now that we have established the need for KPIs and SLAs, let's look at the need for constant monitoring to ensure compliance or to detect violations. Data observability refers to understanding the health of data pipelines and goes beyond monitoring and alerting. It is where metrics are continuously computed and logs are scanned to understand the additional context of relevant events, such as who accessed what dataset. Atomic commits to the delta log help with this. Transaction log commits include adding/removing a file and changes to schema.
Let's look at what needs observing:
- Schema changes that can disrupt operational pipelines and affect key business processes.
- Lineage helps to identify, isolate, and determine the root cause of broken pipelines.
- Volume changes are usually within an acceptable threshold, and violating this threshold at either end suggests the unavailability of a data source or the addition of new ones.
- Statistical characteristics of a data distribution should remain similar, and wide variations indicate changes to data collection and the interpretation of base assumptions on the data.
- Freshness of data refers to the fact that data flows through the systems and the fresher the data, the faster the insight generation and relevance to business.
Let's see how Delta helps address these observability needs:
- Delta supports disciplined schema evolution, allowing innocuous changes early in the pipeline by allowing mergeSchema and locking it down towards the latter stages to not surprise the consumers or violate the established data contract with them.
- Delta Time Travel provides built-in lineage and visibility to operations for future audits. This helps with reproducibility as well. However, transformations across Delta tables need to be tracked explicitly.
- Volume counts on every batch or time period can be set up with thresholds to alert on anomalies. This is not Delta-specific, but it auto-captures a lot of this in the transaction log.
- Data profiling using Spark profiling or pandas profiling libraries can add value when the statistical characteristics of data change significantly.
- Delta's support for unifying batch and streaming with tunable ingestion frequency offers an easy means to control data freshness based on SLA needs and cost concerns, meaning lower latency requires continuous compute and hence higher costs.
In the next section, we will look at the availability of pipelines to ingest new data and serve queries for stored data.
Scaling and high availability
Scalability refers to the elasticity of compute resources, meaning adding more compute capacity as data volume increases to support a heavier workload. It is sometimes necessary to scale down resources that aren't in use to save compute costs. Scaling can be of two types: vertical or horizontal. Vertical scaling refers to replacing existing node types with bigger instance types. This is not sustainable after a point because there is an upper bound on the largest possible instance. Horizontal scaling refers to the addition of more worker nodes of the same type and is truly infinitely scalable. Each serves different scenarios. If the largest partition is no longer divisible, we benefit from a bigger node type. However, the advantage is that some of the nodes can be turned off when there is low data volume. This is an infrastructure and architecture capability and not directly related to Delta.
High availability (HA) refers to the system uptime over a period of time to service requests. There are several underlying nuances. For example, a pipeline may encounter an out-of-memory error or a human coding bug and become unavailable. For a real-time use case, this will immediately have an impact on the SLAs. A particular instance type may become unavailable, such as a spot instance or a GPU instance. Some GPU workloads may not be able to function, but spot instances could be replaced by on-demand instances for a higher price. Spark's inherent distributed architecture and cloud architecture ensures that a worker node is replaced by another in the event of a node's unavailability. You will be more vulnerable to meta store limits than object store rate limits. Delta will scale beyond meta store limits since the transaction log manages the creation of the logical table instead of the meta store. As a result, Delta tables are not dependent on a meta store because the details are in the transaction log, which lies alongside data and is easy to replicate elsewhere. However, the use of a meta store can still facilitate data discovery.
AZ failures can be addressed more easily than total region failures. It is important to note that HA is in the context of localized errors and load scenarios where disaster recovery (DR) is a more widespread catastrophic failure requiring a shift in infrastructure to ensure business continuity. In the next section, we will look at different options for business continuity by allowing a DR strategy to another region.
Planning for DR
Planning for DR requires a balance of cost and time needed for a business to recover from an outage. The shorter the time expectation, the more expensive the DR solution.
It is important to understand two key SLAs for the business use case:
- Recovery Time Objective (RTO) refers to the duration in which a business is mandated to recover from an outage. For example, if RTO is 1 hour and it is 30 minutes since the outage, then we have 30 more minutes to recover and bring the operations back online without violating the RTO stipulations.
- Recovery Point Objective (RPO) refers to the maximum time period of a disruption after which the loss of data collection and processing will exceed the business's agreed-upon threshold. For example, if backup was done in the last hour and the defined RPO is 2 hours, we still have an hour to recover from the disruption to the business.
In the next section, we will see how to use these values of RTO and RPO to plan for DR.
How to decide on the correct DR strategy
Before designing a DR strategy, it is important to understand these two metrics. DR strategies can be categorized in the following four ways, with increasing cost and decreasing RTO/RPO values, as shown in the following diagram:

Figure 11.1 – DR strategies
There are four main types of DR strategy. From left to right, the cost of the strategy increases, and the time involved in recovery decreases. So, depending on the SLAs and budget at hand, the right DR strategy should be chosen, and they are as follows:
- Backup/Restore:
- Data is replicated.
- Infrastructure scripts are versioned and available to both primary and secondary sites. The repository could be Git (which also could be a single point of failure) or just cloud storage with replication to a different region.
- Pilot Light:
- A second deployment site exists so that in the event of failure, both code and scripts would need to be deployed to restart operations there.
- Warm Standby (Active/Passive):
- Not only does a secondary site exist, but all the artifacts and code are also up to date, they're just not processing data yet.
- Multi-Site (Active/Active):
- Both sites are completely primed and ready and a load balancer shunts traffic to each site so that in the event of a failure to one region, the full load falls on the other.
Let's see what role Delta plays in facilitating a DR strategy.
How Delta helps with DR
These are the main ingredients to required establish a DR site in another region:
- Data (including metadata)
- Scripts/code/libraries needed to run your pipelines
- Code for your infrastructure setup/deployment
We covered Delta deep clones in Chapter 6, Solving Common Data Pattern Scenarios with Delta, and now we will see how handy it is to replicate data to the secondary region. There are other ways of copying data using cloud-specific geo-replication strategies. However, they have deficiencies that could lead to additional data copies and inconsistent state. Also, they are restricted to being only one way. Delta deep clones are not only incremental but also two-way, meaning you can fall back to the secondary region in the event of a failure in the primary site and also go back to the primary site once it is reinstated. Note that the metadata replication is also necessary and can be done by periodic exports and imports, and it is preferable to rely on an external meta store. This is required only if the downstream user/workload accesses the table via the meta store; otherwise, the transaction log copied as part of a deep clone operation is sufficient.
The following gives an example of how to create the clone and query both tables to validate data reconciliation:

In the RDBMS world, replication is facilitated using the commit logs, and the same is true with Delta: the transaction logs are used to perform the synchronization between the primary and secondary sites. It is important to emphasize that this incremental clone is synchronous in nature, making sure that data order is maintained even in a distributed architecture setup. Changes include not just additional records but updates and deletes to existing data. The following diagram demonstrates the steps involved in incremental data transfer between the primary and secondary sites, the failover to secondary in the event of a disaster in the primary, and the subsequent fallback to primary as order is restored there:

Figure 11.2 – DR failover and fallback
Let's look at the six steps illustrated in the diagram:
- Updates are made to the data at the primary site. The data is incrementally copied/cloned to the secondary site.
- Disaster strikes the primary site.
- The pipeline processing fails over to secondary site, which takes over the pipeline and business operations.
- Changes are made to data in the secondary site.
- The primary site is restored.
- The pipeline can now fall back to the primary site using a new clone table and it can be renamed. Changes are now made to the primary site and we can continue to clone to the secondary site as usual.
DR should be an important consideration in your business continuity plan. In the next section, we will look at quality concerns of the data, which, if not handled adequately, render the data untrustworthy and hence useless.
Guaranteeing data quality
We've examined the medallion architecture blueprint, where raw data is brought as is into bronze, refined in silver, and aggregated in gold. As data moves from left to right in the pipeline it is getting transformed and refined in quality by the application of business rules (how to normalize data and impute missing values, among other things), and this curated data is more valuable than the original data. But what if the transformations, instead of refining and increasing the quality of the data, actually have bugs and can occasionally cause damage? We need a way to monitor the quality and ensure it is maintained over time, and if for some reason it degrades, we need to be notified. If there is an occasional fix by updating the data, it is a needle in a haystack scenario, but nevertheless, it needs to be accommodated easily.
Delta's ACID transaction support ensures that in the event of a failure, no data is committed, ensuring that consumers never see bad or partial data. This would be a nightmare to rewind from in a distributed architecture with multiple nodes. The same is true of Delta's support for schema evolution, where a pipeline engineer controls whether mergeSchema should be allowed or not depending on where the data is in the pipeline. In the event of an inadvertent human error, Delta's time travel capability allows data to be rolled back to a previous time or version. Similarly, Delta's support for fine-grained updates and deletes allows data fixes to be applied to a few data points with relative ease. Storing metadata in transaction details along with the data in object storage helps to recreate an old dataset.
However, there are a few more features that need attention and need to be coded either in individual pipelines or as part of a framework for greater configuration and reusability:
- Providing rules for acceptable values of certain fields. Examples include ranges, enumerations, relational expressions, and regex patterns.
- Providing actions (rules) on how violations should be handled. Some options include reducing quality metrics, dropping the data, quarantining it, or halting the pipeline.
It is necessary to build a data quality audit framework on data in the lake to achieve the following:
- Define quality rules as policies so that they can be adopted, standardized, and changed over time. These become contracts that are enforced on each data ingest.
- At-a-glance visibility of the quality metrics of a dataset is necessary for folks downstream to make informed decisions on whether to use the dataset or not.
- Actionable triggers on violation, such as alerting or quarantining the data points. The baseline metrics are monitored for drift, and any anomaly is logged for audit purposes and reported to invite intervention and fixing.
- Because there are stages of data dependencies, integration with data lineage is an important consideration. One bad transformation could significantly lower the quality of a curated dataset that was otherwise pristine.
The following diagram extends the medallion blueprint with additional validation checks by data engineering folks and business folks so that the datasets that have been explicitly validated have additional marker flags to indicate quality metric values. Note the process of releasing the data to downstream users could be a design tradeoff. In some cases, it is made available and businesses can consume it at their own risk. In other cases, it may be required to clone the data to a separate consumption layer table to keep it completely pristine and separate. This does add to the end-to-end delay and is a bottleneck in self-service activities, so it should be considered carefully.
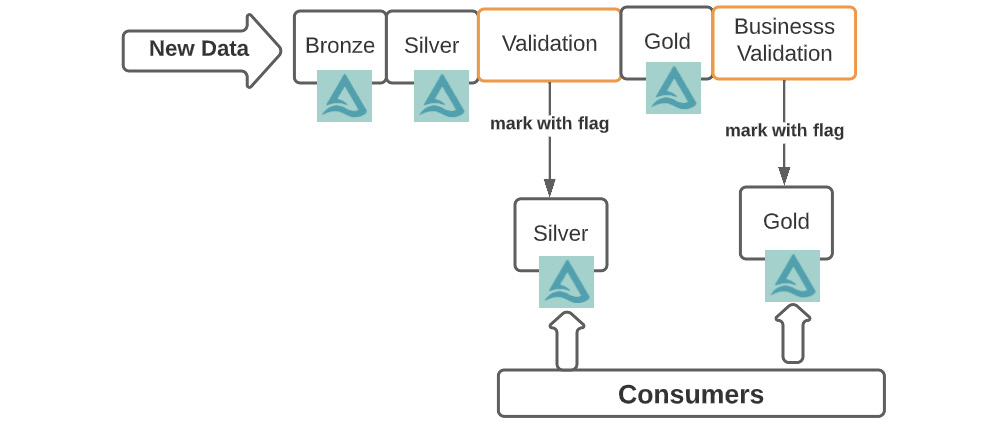
Figure 11.3 – Quality framework
Maintaining data quality is a shared responsibility, and all data personas, including business stakeholders who consume the data, should collaborate to help with the standardization and reporting of anomalies. This requires several building blocks, including a configuration store, a rule engine, anomaly detection and reporting, and a graphical interface for visual display. In a managed platform such as Databricks, this is solved by the DLT feature, where quality is built into the table definition and is not left to the discretion of a data persona to implement as an afterthought. Maintaining this as a separate step or process often results in the data and quality checks not being in sync.
In the next section, we will look at testing and automation that facilitates building and maintaining pipelines at scale.
Automation of CI/CD pipelines
POC and Pilot code to prove out an end-to-end path does not get sanctioned for production as is. Typically, it makes its way through dev, stage, and prod environments, where it gets tested and scrutinized. A data product may involve different data teams and different departments to come together and test the data product holistically. An ML cycle has a few additional steps around ML artifact testing to ensure that insights are not only generated, but also valid and relevant. So, Continuous Training (CT) and Continuous Monitoring (CM) are additional steps in the pipeline. Last but not least, data has to be versioned because outcomes need to be compared with expected results, sometimes within an acceptable threshold.
Automation takes a little time to build, but it saves a lot more time and grief in the long run. So, investing in testing frameworks and automation around CI/CD pipelines is a task that is worth investing in. Continuous Integration (CI) is the process of fostering innovation and improvement by having a process to continuously make changes to the code base and submit it after due review and testing. Continuous Delivery or Deployment (CD) refers to the deployment of the new approved changes in an automated fashion to higher environments.

Figure 11.4 – CI versus CD
With CI, regressions can be caught early on, meeting the release deadline gets more predictable, and operational continuity is not a nightmare with constant escalations and triages. The built-in Spark test suite is designed to test all parts of Spark.
With CD, software complexity is tamed and release cycles can be shorter, meaning customers get fixes and feature updates faster as the feedback loop is shorter.
Code under version control
Often, people think of their pipeline code as the only artifact to protect against loss. However, all aspects of recreating the environment, including infrastructure deployment scripts, configurations, compute specifications, and job and workflow orchestration specifications, all need to be treated as code. So, best practice is to preserve all of this under version control. The Git repository could be cloud-based or hosted on-premises. At times, even a Git repository could have an outage, and this could lead to some work not being saved or even risk your DR strategy. Some firms use a replication process using cloud storage where Git artifacts are copied to different S3 buckets, for instance.
Organizing code into libraries with modular functions facilitates testing and helps to manage complexity, otherwise the pipeline is fragile and breaks easily. Special attention should be made to not expose secrets and credentials and to grant access to repositories judiciously to avoid intellectual property exposure apart from unwanted hacking.
Infrastructure as Code (IaC)
Leveraging REST APIs and command-line interfaces (CLIs) helps maintain IaC. Sometimes, cloud provider offerings such as Cloud Formation in AWS may help to abstract away the infrastructure pieces quickly. However, given that all large enterprises are planning to use a multi-cloud strategy to reduce dependencies on a single cloud provider and hedge their risks, using a cloud-agnostic scripting framework such as Terraform may be a better idea. There may be some effort required to initially learn how to use the tool, but it goes a long way to completely automate the release process. Scripts can be versioned and made available in Git repositories alongside pipeline code, so it is no surprise that this is called Infrastructure as Code.
The creation of complete environments, including jobs, clusters, and libraries, can be handled programmatically, and it becomes part of the CI/CD pipeline. Terraform in particular has a declarative syntax, keeps track of infrastructure state, handles dependencies between objects, and can be used to not only create but update and delete environments along with their associated objects.
Unit and integration testing
The natural order of testing is unit test, integration test, and end-to-end tests. Costs rise exponentially as bugs are found later in the development cycle. So, pushing all testing to the end is not a good idea. Removing the human in the loop and automating this process makes this process repeatable and sustainable.
unittest is a popular unit testing framework from Python, and we will use it to demonstrate how to organize tests into suites to incrementally add tests and increase code coverage (reference: https://docs.python.org/3/library/unittest.html).
Sometimes the functions already exist and you can reuse them; other times you may need to create them explicitly and add checks using assert statements that validate results to expected outcomes. The following snippet shows a SimpleTest class with two test functions:

Now the test suite class can be generated by adding the individual test functions from before:

It is also possible to discover the functions by listing everything and adding them or selecting specific ones:
def generate_function_suite(suite = None):
if suite is None:
suite = unittest.TestSuite()
suite.addTest(unittest.FunctionTestCase('test_1')) suite.addTest(unittest.FunctionTestCase('test_2'))return suite
This is how the test suite is orchestrated using a test runner:

Not all batch operations are supported in streaming, so although it is tempting to just test the logic using batch dataframes, there may be some nuances of source/sink that may be overlooked. It is recommended to use the StreamTest harness (Scala only) using memory sink for this. Similar to assert, there is CheckAnswer and ExpectFailure:

Of course, end-to-end integration testing should be used if unit testing is not adequate or is hard to set up. If all goes well, stress testing should be done to understand load and rate limits so that the clusters can be sized adequately. Monitoring is the other side of the coin. You can get the last progress of a streaming query, for example, (streamQuery.lastProgress) to understand input versus processing rate, current processed offsets, and state metrics. Setting up a StreamingQueryListener with functions such as onQueryStart, onQueryEnd, and onQueryProgress allows us to get the progress asynchronously.
The following diagram captures the entire process:

Figure 11.5 – CI/CD to promote pipeline across environments
Let's look at the different flows enumerated in this diagram:
- The developer successfully executes unit tests in the development environment.
- The developer then pushes code base to a repository.
- This triggers a build pipeline. Artifacts are created and pushed to UAT/Stage for unit testing. On successful completion, artifacts are optionally pushed to an artifactory.
- A release pipeline is triggered that pushes artifacts from the artifactory to a UAT environment.
- Successful execution of integration tests triggers another release pipeline.
- The release pipeline pushes the artifacts into the production environment
- In the production environment, sanity tests are run and if errors are encountered, then a rollback to a previous version may be required.
Shallow clones (aside from CI/CD use) are also very useful for POCs for optimization/enhancements on already operationalized pipelines with virtually no risk. They solve the problem of "how do I get data to test X?" where it's been pretty common to either read a prod table (which is not ideal) or generate dummy data (which is also not ideal and is time-consuming).
These steps are a coarse outline of the expected workflow. Delta's versioning capability helps to record the version of the dataset to test along with configuration details for subsequent testing across different environments. Schema changes and rollback scenarios can be handled gracefully. In the next section, we will envision a future of intelligent pipelines that abstract away a lot of the admin functionality, leaving the developer to focus on the data transformation aspects as demanded by the use case.
Data as code – An intelligent pipeline
All the operationalizing aspects referred to in the previous sections would have to be explicitly coded by DevOps, MLOps, and DataOps personas. A managed platform such as Databricks has abstracted the complexity of all these features as part of its DLT offering. The culmination of all these features out of the box gives rise to intelligent pipelines. There is a shift from a procedural to a declarative definition of a pipeline where, as an end user, you specify the "what" aspects of the data transformations, delegating the "how" aspects to the underlying platform. This is especially useful for simplifying the ETL development and go to production process when pipelines need to be democratized across multiple use cases for large, fast-moving data volumes such as IoT sensor data.
These are the key differentiators:
- The ability to understand the dependencies of the transformations to generate the underlying DAG and schedule them to run autonomously. The DAG captures the data lineage of data transformations across tables. In previous chapters, we saw how Delta maintains the version history and lineage of all transformations done to a single table. This takes a step further and captures the lineage of data as it touches multiple tables during the transformations.
- The ability to use configuration to move from batch to streaming and vice versa without requiring any code changes.
- The ability for configuration to move to a different environment, such as dev to prod, without requiring recoding and retesting.
- Simplifying the Change Data Capture (CDC) process, where the merge operations are further simplified and optimized with sophisticated add-ons such as handling out-of-order events in a distributed setup.
- The use of features such as autoloader (on Databricks) allows the detection of new files, handling schema evolution, and placing unparseable data in rescue data columns for further investigation, thereby ensuring data is never lost.
The following example shows creation of a DLT on Databricks:

- Delegating the choice of compute, along with autoscaling decisions for the workload at hand, to the underlying platform. Judicious autoscaling, especially for streaming workloads, by monitoring both the backlog metrics and the cluster utilization is especially challenging.
- Delegating administrative aspects of the pipeline run, such as retry on failure, and of the pipeline maintenance tasks, such as running optimize and vacuum, to the platform because it knows the load conditions and can determine the best time to schedule admin tasks to be least disruptive.
- Documentation is built into the data transformation and can be exposed in catalogs for users to discover.
- The ability to build quality constraints and expectations into the pipeline so they are integral and tightly coupled instead of being separate independent jobs that will eventually not be able to keep up with changes made to the pipeline. These constraints should have actionable consequences. For example, if a violation occurs, we can decide how to handle it. Should it be allowed to pass with reduced quality, should it be quarantined or dropped, or should the whole pipeline be halted?
The following example shows constraint definitions for a DLT:

- The observability of the pipeline operations, along with the quality metrics, so that people can understand the health of the pipeline and people downstream can decide whether the data quality is reliable enough to be used as input for their processes.
DLT is regarded as the new gold standard for Delta pipelines as it makes the data ingestion pipelines smarter and more robust. Infrastructure is managed in an optimized manner, thereby relieving the user from the tooling aspects so they can focus on the business transformations on the data to reap value. The establishment of quality constraints makes stakeholders trust their data and generate other insights from it with higher confidence.
Summary
Organizations rely on good data to be delivered in a timely manner to make better business decisions. Every use case has SLAs and metrics that need to be honored. So, operationalizing a pipeline starts with an understanding of both the functional and non-functional business requirements so that people are not surprised that it either does not comply with expectations or is too expensive. With thousands of data pipelines spanning multiple lines of businesses and their inter-dependencies, it is a non-trivial task to ensure they all run successfully and the data they produce is complete and reliable.
In this chapter, we examined the various aspects to be considered when building reliable and robust pipelines and ensuring they continue to run in spite of environmental issues to ensure business continuity. In addition, we explored the need for lineage tracking, observability, and appropriate alerting so everyone is on the same page and can make decisions on when to consume them for their insight generation and reporting needs. The transactional nature of Delta, coupled with features such as Delta clone, makes it easy to build quality frameworks on top of the data lake to ensure all data meets the expected quality standards.
In the next chapter, we will look at performance-related features of Delta and tuning opportunities to continuously refine and improve your Delta pipeline to extract the maximum value from your investment.