Chapter 9: Turning Research Into Action
You’ve designed an elegant project. You’ve recruited the right participants. You’ve run great sessions. Your analysis has been thorough and revealing. But if you don’t succeed in turning your research into action, then you’ve probably been wasting your time.

Research cycle: impact
It’s common to associate the end of a research project with some kind of debrief session or report, where the person who did the research tells everyone else what the answer is. Actually, that’s the wrong way to think of it, because it’s only part of the picture.
- Communication and engagement work best when they’re happening throughout the project. If you leave it to the end, you’ve missed your best opportunities to build engagement and ownership of the results.
- Research doesn’t have value unless it results in decisions and actions. So when you think about the end product of your project, don’t settle for being heard. Plan for the findings, evidence and ideas to be acted upon.
Making Your Research Relevant
As we noted in Chapter 2, you need your wider team and stakeholders to feel ownership of the research if it’s going to be successful. You can achieve that in a number of ways:
- Careful listening to what your stakeholders actually need from the research, at the beginning of the project.
- Framing the objectives in the language of your stakeholders KPIs (eg, number of signups), not just in terms of an improved user experience.
- Planning engagement touchpoints through the project, and using a variety of tactics to reach out to different audiences (see next section).
- Involving them in activities such as note-taking, observation and analysis.
- Being enthusiastic and persistent.
Engaging Stakeholders Throughout the Project
There are a number of ways you can involve your colleagues and stakeholders throughout the project. This isn’t a complete list – use it as a starting point to add your own ideas to.
Attending Research Sessions
It might sound obvious, but one of the best ways to get your colleagues thinking about the research is to persuade them to attend some of the interview sessions. Hearing about users’ needs directly is much more powerful than having a researcher relay them second hand: it establishes a personal connection with customers that can have a lasting effect. The more actively involved in the sessions your observers are, the more powerfully involved they’ll feel, so try to get them to take notes, contribute on Post-Its, or participate in a follow-up workshop discussion (see Chapter 6). We find that if stakeholders attend the first couple of sessions they’ll often want to stay for more. One note of caution: stakeholders who only attend one or two sessions can sometimes over-generalize from what they’ve seen, so make sure they’re aware of the full range of interviews.
Show and Tell (AKA Pizza Sessions)
Show and tells are a great way to build interest and engagement with your research project, before the final results are ready. Firstly, the rough-and-ready format makes it clear that the results are provisional, not the final word. Secondly, it’s a flexible approach that allows you to focus on the topics your audience are interested in. Finally, it brings your audience closer to the project by showing them the actual material that’s been generated, without the need for lots of preparation on your part. If you’ve got a project space set up, you may find that show and tells happen naturally. If not, you may want to invite a broad audience to a separate session, part way through the project. The actual show and tell should be short – anywhere between five and 20 minutes – but allow plenty of time for questions and open discussion afterwards.
Here’s an approach you can use:
- Start by providing background on the project: the objectives and approach.
- Then choose four or five of your most colorful and interesting examples, and demonstrate them using mixed media: video clips, photographs, quotes and anecdotes.
- For each example, provide a takeout. Once you’ve finished walking your audience through it, say something like, “And the way we’re interpreting this session is…” Invite your audience to offer their own interpretations too.
- Offer a summary of what you’re finding, while making it clear that this is still work in progress: “The main themes we’ve been discovering so far are…” Answer any specific questions, while being clear that there’s still more work to do.
- Finally, let your audience know how they can stay in touch with the project and when they can expect the more robust version of the results.
Show and tells are also known as pizza sessions, for the obvious reason that it helps to entice people along if there’s free food on offer. Of course, lunchtime pizza may not be the most tempting or appropriate reward for your audience, so try experimenting with different times and treats.
Topline Findings
Once your research sessions have begun, it’s a good idea to share a regular update of your findings. It’s best to keep this rough, and not go into too much detail, because you don’t want to waste time or suggest that these are definitive answers. An ideal format is a page or so of bullet points, with a message at the beginning making it clear that these are early findings and there’s more to come.
Even if most of your audience attended the research sessions, it’s still a good idea to create topline findings. It reduces the risk that your attendees will pass on a version of events that you disagree with, and it helps to keep everyone on the same page, by summarising the current state of your rolling hypotheses.
Some people like to summarize topline findings at the end of a day, either off the top of their head or in collaboration with the other observers. Alternatively, you can ask an observer to capture and iterate findings through the day, in a rough format such as Markdown, or as a Trello board. Doing it in this way makes it easier to share, however you may need to tidy it up somewhat before it will make sense to other people.
Project Blog / Websites
Taking the idea of topline reporting a step further, it’s worth considering a project blog, website or intranet page.
Creating a resource like this takes time, but it’s a good way to give the project an ongoing presence (especially if your audience works across multiple locations), and minimize the amount of in-person communicating you need to do. In terms of content, we’d recommend including:
- A summary of the project objectives.
- The plan: timings, methodology.
- Who’s who on the project, and contact details.
- Regular updates of progress, including photos, quotes and stories from the field.
- A summary of the hypotheses, which you can update as they evolve and become [should there be another word here? KM].
- Links to any output documents.
- Information on how to find out more – for example, the date of a show and tell session. Creating a resource like this takes time, so it’s probably not justified for a small project with minimal profile. However, if you’re working on a more ambitious discovery project, or you want to maximize awareness of your work, then this approach can be a surprisingly efficient way to do so.
Documenting What You’ve Learned
Even when you’ve successfully engaged your audience throughout the project, it’s likely that you’ll still want to create some sort of documentation. By doing so, you’re helping to ensure that your work lives on in the organization, because your findings will probably be relevant to future projects, too. This isn’t an alternative to the communication you do through your engagement plan: they’re complementary.
When you document research, there are three elements you need to be aware of:
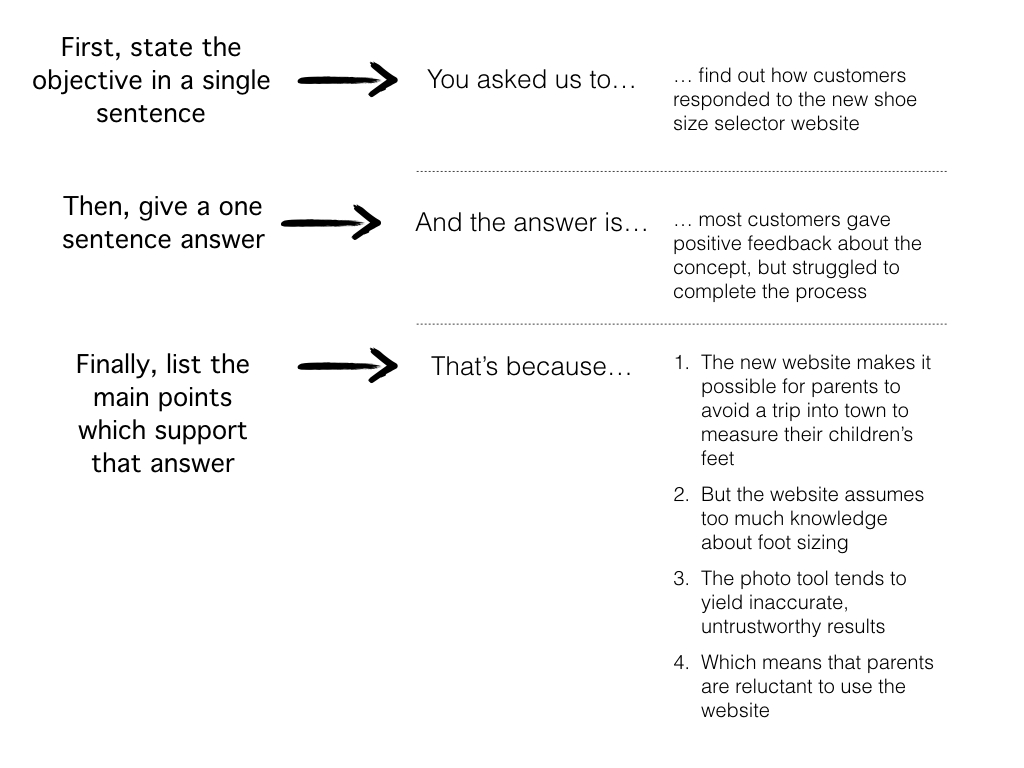
- The findings. The core of your communication is made up of your interpretation of the evidence from the analysis process. Normally, this takes the shape of a story, because it’s easier for your audience to engage and remember it that way. Think of your story as having two versions: a summary that you could tell in 60 seconds (see below), and a more in-depth version that lays out your reasoning in more detail.
- Examples. At a basic level, your audience needs to be convinced that what they’re hearing is true. The evidence you’ve collected (or rather, specific examples) provides that substance.
- The recommendations. Once they’ve absorbed the story, your audience needs to be clear about what they should do next.
An example story
Ideally, you should decide how you’re going to document your research early in the project, because it will have a bearing on the way you set up and conduct the sessions. There are many different formats open to you, each with their own strengths and weaknesses, so bear these factors in mind:
- How quickly do you need to share the documentation? Some forms of documentation are quicker to create than others.
- How detailed does it need to be?
- What mix of insight, evidence and ideas do you need to capture?
- What resources – such as photos, video or screengrabs – do you have access to?
Once you’ve considered these questions, you’re ready to choose a format for your documentation. You don’t just have to choose just one of these formats. They’re actually more effective if you combine them, because the strengths of one cancel out the weaknesses of the other.
| What it is | Timing | Insight vs evidence vs ideas | Effort | ||
|---|---|---|---|---|---|
| Show and tell (aka pizza session) | Informal runthrough of the research so far, with Q&A | Midway through the project, or at the end of a sprint | High insight, medium evidence | Low | |
| Topline findings | One page bulleted summary of findings so far | After first round of research sessions | Medium insight | Low | |
| Project blog / website | Online resource capturing project background, progress and findings | Throughout the project | Medium insight, medium evidence | High | |
| Report deck | Slide deck summarising the findings, detailed feedback and recommendations | At the end of the project | High insight, medium evidence, low ideas | High | |
| List reporting | Cataloguing and feeding back on research. Takes place in the project space | After each sprint | High insight, medium evidence, medium ideas | Medium | |
| Journey map | Graphical representation of the sequence of steps taken by users to complete a task | At the end of the project | High insight | Medium | |
| Experience map | Large-scale representation of the entire customer experience | At the end of the project | High insight | Very high | |
| Personas | Personification of a set of user needs and behaviours | At the end of the project | High insight | Medium-high | |
| Showreel | Compilation of video highlights, taken from research recordings | At the end of the project | High evidence, medium insight | High | |
| Debrief workshop | Presentation of findings and workshop activities to determine actions | At the end of the project | High insight, high evidence, high ideas | High |
Report Deck
The classic format for documenting research projects is a slide deck. They’re popular because it allows you to combine images and text easily, and they’re also easy to present in a debrief session. They’re a flexible format that can showcase insights, evidence and ideas equally well. The downside is that they take time to create, which could perhaps be better-spent on other tasks, and they run a risk of sitting unnoticed and unread once the team have moved on to the next project. If you’re working in an agile environment, you probably don’t have time for this.
Your deck will need several sections:
- A summary of your story, telling the audience what your objective was, and what the brief answer is. This should take no more than a few slides.
- A brief description of your approach, including an overview of who you spoke to. To protect your participants’ anonymity, this shouldn’t include full names or contact details.
- Detailed, page-by-page findings.
- If you’ve used the pyramid approach described in Chapter 8, you’ll already have your story, so just insert it into the structure above. To add visual interest, it’s a good idea to include images in this section too. Photographs from your project are a good choice, but you can also use screengrabs of the product, diagrams or stock images.
- For the detailed findings, we like to use annotated screengrabs like the ones shown below.
- Finally, you should ensure that you’ve provided recommendations. These might be entirely your own work, but it’s better if you’ve come up with them together with the rest of the team. Either way, you have the choice of including them on each page, or listing them in their own slides at the end.

An annotated screengrab
You may want to produce different versions of the report for different purposes. For example:
- One for presentations that includes at least one very short video clip. This version might just include the summary and main story sections.
- Another as a PDF, with links to video in a shared folder. This version would be the entire report, and include all the detail slides.
A blank report template is available at https://www.cxpartners.co.uk/ux-resources/, along with many other free deliverable formats.
List Reporting
In contrast to report decks, list reporting dispenses with the frills and gets straight to work listing the problems and recommendations. The upside is that the output is action-focused. The downside is that it’s not so persuasive or engaging, so don’t use this approach unless your team has already bought into the project and its findings.
To produce a list report, follow these steps:
- Choose your format. We prefer a spreadsheet, but you can also use project management tools like Trello, or even a wall with Post-Its.
- Agree a system for rating your issues. A popular way to do this is to create column headings labelled Issue, Severity, Prevalence, Impact and Recommendation.
- In each row, add an issue raised by the research (for example, “Users can’t find the continue button”).
- Then, rate the issue for severity (ie, how much of a barrier was it for users in completing their task?) and prevalence (ie, what proportion of users did it affect?). We do this by giving a score from 1 to 5 in both columns. A rating of 1 for severity means it caused minimal obstruction, while a 5 means it completely broke the experience for users. A rating of 1 for prevalence means it only affected a couple of users, while a 5 means it affected everyone.
- Calculate the impact by multiplying severity by prevalence. You can then sort the rows in order of impact to show the biggest issues at the top.
- Finally, you can add recommendations for each of the issues. Again, it works best to do this as an activity with the whole team, rather than on your own.
Alongside this form of documentation, it’s helpful to maintain a project area with photos, example screengrabs and sketches (see Chapter 8), and to use regular show and tells as your method of sharing back with the team.
Journey Map
Journey maps show the steps taken by a user to complete a specific task. They represent a sequence of steps or touchpoints, which might involve multiple devices or channels, and might take place over a few minutes or several days. Journey maps are an excellent way to record users goals and expectations, and the problems that they encounter in completing them. On the downside, they can become overly-complex if the exact sequence of steps needs to be recorded.

An example journey map
To create a journey map, follow these steps:
- Define the user’s goal, and state this at the top of the map. You may also want to associate the journey with a particular persona.
- Working from left to right, map out the sequence of steps that the user takes, starting with the trigger that causes them to begin the task, and finishing with the goal.
- For each step, make a note of the channel and device that’s being used.
- You may also want to add details like an emotion line showing the highs and lows of the journey, quotes or opportunities.
Experience Map
An experience map is like a journey map on a grander scale. Instead of focusing on a specific journey, it takes in the entire customer experience for a particular product or service. Think of it as a planning tool rather than a design tool, enabling your team to identify where changes are needed rather than how to implement them.
Because they’re high-level, holistic documents, experience maps have a long shelf life. They’re often printed out on a wall-size piece of paper, and put in a prominent place. They’re a great reference point for potential projects, because they can be related back to the most pressing customer needs within the overall experience, and used to track progress.
The downside of experience maps is that they’re large, unwieldy and difficult to scan. They also don’t give much direction on how to solve a problem, so you’ll probably need to conduct further research to understand it better before you’re ready to implement a solution. Compared with some of the other methods described in this chapter, experience maps are a pro-level skill, and you should expect to put in a lot of time and effort to create them.

Example experience map
To create an experience map, follow these steps:
- Stick a piece of brown paper along the largest wall you can find.
- Use a Post-It note to record each need, activity, pain point and delights you’ve heard about from users. Generally it’s a good idea to phrase your Post-It notes in the first person – for example:
- Needs are statements about what the user requires at this stage in the process: “I need to be certain that the shoes will arrive in time.”
- Activities are actions that users may take within this phase: “Check the confirmation email.”
- Pain points are problems, barriers or frustrations that arise, such as: “I can’t find the delivery time guarantee anywhere.”
- Delights are the positives that users experience, such as: “Customer service gave me a $20 voucher to apologize for the delay.”
- Once you’ve generated your Post-It notes, group them into columns to represent broad phases of the experience. Don’t worry about the precise sequence of actions: that’s a job for a journey map. Use one row for the names of phases, the next for tasks, then additional rows for actions, needs and pain points.
- If you like, you can keep adding rows for further information. In the past, we’ve added layers to record relevant product attributes, competitor offerings, KPIs and solutions – it’s actually a very flexible format.
- You should involve your team in all of this activity, if possible, but if you can’t, then you should now hold a show and tell of the experience map. Walk your colleagues through it, and ask them to call out any surprises or missing information.
- Once you’ve sense-checked the rough experience map, you may want to hand it over to a visual designer for a makeover before you print it and put it on the wall in a prominent position.
Personas
A persona is an abstracted set of user needs, normally presented in the form of an imaginary person.

Example persona
Personas can be a great way to build empathy, especially if your team live very different lives from your users. They’re also a powerful tool for making decisions, because in the process of creating them you deal with a lot of the difficult discussions about prioritizing one set of user needs above another. That’s helpful later on, because you may not have time for further research, and you don’t want to keep derailing your product development process with repetitive arguments about priorities.
Personas have several downsides, too:
- They polarize. Some of your colleagues may be skeptical about using them based on bad experiences of personas they’ve had in the past.
- If they use invented biographical detail, they run the risk of triggering people’s prejudices (positive or negative), which can get in the way.
- It can be hard to get the level of fake biography right. Personas that talk about how many cats someone owns aren’t helpful for design decisions, but a pure list of user needs can feel a little dry.
- It’s easy to confuse them with marketing segments, which look similar, but do a very different job.
The trick to producing effective personas is in their creation. If the people who are going to be using them aren’t involved in generating them, they’ll flop. But if they are involved, personas can be really effective. Here’s how to create them:
- Start by reviewing any existing reports, and conducting qualitative research to profile users.
- In the analysis process, focus on producing conceptual diagrams, particularly spectrums. These allow you to categorize participants by their similarities or differences in terms of user need, which you can then use as the basis for personas. Give each of these a name (a real name, like Adil, or a descriptive name, like ‘cyclist’).
- Using this approach, you can create a longlist of personas (anywhere from five to as many as 20).
- Now you need to combine and prioritize your longlist of personas to arrive at a smaller final set. Two or three primary personas is a great target, but you can include some secondary personas too, if you like. The way to do this is by debate with your project team, not on your own, because the discussion about which to prioritize is right at the heart of the process. Here’s an example: let’s say we wanted to design an underground train station. In the process of reducing the longlist to a shortlist, we identify shoppers and parents of young children as two separate groups. But in design terms, their needs are identical. They both struggle to get up escalators, whether it’s with shopping bags or buggies. So we’ll condense them into a single persona, we don’t need both. We also agree that we’re going to deliberately prioritize the needs of commuters over tourists. So we’ll have a commuter persona, but not a tourist persona. Later on, when we have to make tradeoffs, that’s our decision.
- Finally, create the personas you’ve chosen as A3 posters, and add as much biographical color (photos, names, background) as you feel is appropriate. More biography helps with creating empathy, whereas if your objective is primarily about guiding decision-making then it’s best to keep it light.
- You may also want to consider other formats to get your personas across, such as mood boards, video reels, stories, role-playing or even mannequins!
- Like a house plant, you should keep your personas alive with regular attention, updating them based on any new research you do. As you find out more about your users, stick Post-Its expressing new learnings about that persona onto your poster.
Personas discriminate. In fact, they’re a tool for making difficult prioritization decisions. They deliberately don’t cover everybody. The point of the exercise is the prioritization and debate. By getting it out of the way early, you can avoid continually revisiting arguments about who takes priority. That means your team can make better decisions, move faster and have fewer arguments along the way. You should make sure you update personas when you do additional research, too.
Showreel
Showreels are compilations of video clips. They’re great for providing your audience with direct exposure to your users, and it highlights their experiences like no other format can. The downside is that they’re time-consuming to produce. Also, on their own they can give a skewed view of the findings, so they’re best used alongside another form of documentation like a report, experience map or personas.
Although showreels are the most common format for sharing the evidence directly, there are others. For instance, you might choose to create a scrapbook or website of photographs.
How to make a showreel:
- Ensure your note-taker includes time stamps for key examples and quotes: this will make it easier for you to find the right clips later on.
- Ask participants to give their final feedback direct to the camera. This is often the best footage to use for a showreel, as it’s more likely to be concise, articulate and focused on the main points.
- Without context, it’s sometimes hard for your audience to spot the point the clip is trying to demonstrate, so it’s a good idea to add an interstitial or title that summarizes it for them. For example, “Joey struggles to find the correct shoe size on the product page”.
- Add subtitles if there’s time. This helps to make up for poor audio quality.
- If it’s really important to get good quality video, bring a tripod and microphone, and work with a colleague or professional videographer to set up and monitor the recording.
- Although there are no definite rules for duration, it’s a good idea to keep it under five minutes in total, and keep individual clips to less than a minute. Several short clips that reinforce the same point are more powerful than a single longer clip.
It’s worth mentioning that this is a very short summary of these deliverables: there’s a lot more information out there in books and blogs on each one, so keep exploring if you want to know more.
Debrief Session
In most research projects, you’ll want to mark the end of the cycle with a face-to-face debrief session. There are a number of benefits to doing this:
- You can ensure everyone’s heard the message.
- It gives everyone in the team an opportunity to ask and answer questions.
- You can collectively agree actions and next steps.
- A face-to-face session is more interactive and engaging, not a one-way communication that’s easy to switch off from.
- Finally, it provides a sense of closure for the project team, and an opportunity to review what worked and what didn’t.
If you created a project area, then that’s the best place to hold the session. Allow at least an hour, to enable you to cover a mix of activities. For a larger scale discovery project, you might need as many as three hours for a workshop. The first part of the session is a playback of findings: this could be a show and tell, or a more formal presentation. The second part of the session is about agreeing actions.
Presenting Findings
Firstly, present back the findings. If everyone in the room was present throughout the project, and took part in the analysis, then this could be very brief: just a quick recap to confirm you’re all agreed on the same interpretation. Usually, though, you’ll need to spend the first part of the session playing back the findings to the team. To do this, use a combination of the pyramid story you generated during the analysis process (see Chapter 8,), documentation such as a report deck or experience map, and any additional pieces of evidence like photos or videos.
Tailor your presentation to your audience. It’s normal to encounter a lack of knowledge, as well as resistance and blinkered expectations when you feed back, so you need to think of the best way to counteract this. As you can see from the diagram below, you can deploy the different elements of your research project to increase buy-in. Encourage questions and discussion through the presentation too.

Feedback model
Agreeing Actions
The whole purpose of your project is to generate action. As we’ve mentioned already, the best way to do this is by continually engaging and making the research relevant to your stakeholders. Now, though, you can use collaborative activities to shape and assign actions. There are many techniques on offer, but these are some of the most useful:
Empathy Mapping
Complete a different empathy map for each set of users. Ask your audience to work in groups to a worksheet like the one below, reflecting what they’ve seen and heard about user needs.

Empathy map example
Prioritization Grid
Create a 2x2 framework like the one below. One axis should be labelled ‘effort’, while the other should be called ‘impact’. Map possible solutions onto the framework. When you’ve finished, focus your efforts on the solutions that are in the low effort / high impact quadrant.

A prioritization grid
Agree Backlog
If you’re already managing a backlog of product changes, you can add the actions from the research onto your existing list. If you’re starting from scratch, then work as a group to create recommendations in a list report (see above).
Roadmapping
This is a particularly good activity if you’ve created an experience map. Looking at the experience map, identify user problems you could address with new initiatives and add them as Post-It notes in a different color. Or if you’ve got an existing roadmap, add the activities to the experience map to double-check you’re targeting relevant areas.
Top Priorities
Ask each participant to complete Post-It notes capturing recommendations for action during your presentation, or generate them in small groups afterwards. Group these together on a wall to remove duplicates, then get the whole team to vote with sticky dots on the ones that should be top priority.
Summary
- The more engaged you get your team, the more likely your research will be acted on. Make plans to involve them throughout the project.
- Choose the right format(s) to document your research, but don’t overdo it. Speed is normally more important than detail.
- Use a pyramid story structure, allowing you to get your message across both as a 60-second summary and as an in-depth account.
- Tailor your delivery to your audience, using the right mix of insight, evidence and ideas to engage and persuade them.
- Host an interactive debrief workshop. Use interactive exercises to get the team to generate and own an action plan so your research has an impact.