10
Content (Item)-Based Recommendation System
R. Balamurali
Dept. of Computer Science & Engineering, IcfaiTech, IFHE, Hyderabad, India
Abstract
The main idea behind Content-Based Recommendation System is to recommend an item to a customer similar to the previous items that are rated high by the same customer. Initially, we create an item profile based on the ratings provided by the user for the items he purchased, videos/movies watched, books (textual contents) read, music/songs heard etc.. The user profile captures information like frequently purchased products/brands, type of movies watched (with a specific actor/director/genre etc...), type of music listened (melody/beat etc...) and type of books read (comic/positive thinking etc...) by the particular user. The item profile will be represented as a Boolean vector based on the features of interest for a given user. The item profile will be created for all the items rated by a specific user. From, the item profile we infer the user profile. A simple way to create user profile is to take the average rating given by the user for a specific item. There are also several other ways of creating user profiles which we will discuss in this chapter in detail. Basically, the user profile captures the details of items which are likeable by a particular user. Once the user profile is created, given a new item that is not rated by the user which may be a product/movie/song/book etc.…, it can be represented as a Boolean vector and this Boolean vector shall be compared with Boolean vector corresponding to the user profile using techniques like cosine similarity and if the cosine similarity is above a particular threshold the item may be recommended for the user. We shall discuss the various methods to recommend item based on contents in this chapter.
Keywords: Recommendation system, item profile, user profile, TF-IDF, gradient descent, induction tree algorithm
10.1 Introduction
The online commercial websites like Flipkart, Amazon, Snapdeal, Alibaba, eBay, Youtube, Facebook, etc. recommend products to the user based on the past behavioral history of the user. When a new product is made available to the online market, the product will be compared with the user’s interest based on the user behavioral history. If, the product was found to be of user’s interest, then the system will recommend the product to the user. This concept is called as the Content-Based Recommendation System. There are several ways available to do this mapping between the product feature and user’s interest. This chapter discusses the various methods to achieve this.
Content-Based Recommendation System is all about recommending an item to a customer ‘a’ similar to the previous items rated highly by the same customer [1–5].
Examples:
- An Amazon-registered user purchased 3 books on amazon on the topic—“Positive Thinking” and has provided very high review ratings for all the three books. Now, when a new book on “Positive Thinking” arrives at Amazon, it will be recommended for this particular user.
- A user on Youtube keeps listening to topics on cooking from a specific Youtube channel. Now, when a new recipe was made available to the channel, it will be automatically recommended for the particular user.
- Consider a user ‘x’ has updated his Facebook profile with the name of the organization he works for, with its full address. Now, another user ‘y’ from the same organization and not connected with user ‘x’ will be recommended/suggested as a friend for user ‘x’ by the recommendation system.
10.2 Phases of Content-Based Recommendation Generation
A typical Content-Based Recommendation system will have the following phases.
- Feature extraction and selection: Feature extraction is the foremost operation done in Content-Based Recommendation system. This is the process of extracting the relevant features from the given dataset. The features may be classified as Extrinsic/direct features and implicit/indirect features. The extrinsic features are the one which are directly represented in the dataset like name of the actor, author, director, income, age etc. The intrinsic features are the ones which are derived from the extrinsic features like Noun and Noun Phrases, Term Frequency and Inter Document Frequency (TF-IDF), which is explained later in the chapter.
- Feature Representation: The extracted feature should be represented in a particular format. Depending on the type of the data, different features will be represented in different formats. Typical representations are binary, continuous, categorical, etc.
- User profile learning: Profile building is about automatically building the profile of a user based on the past behavior pattern of the user. This done based on the star rating given by the user, the products he purchased, the movies/videos he watched, etc.
- Recommendation Generation: This phase represents the actual algorithm which is used to predict the user interest level for a particular product or when a new item is introduced in the store, the algorithm shall identify the preference score for all users for the particular item and recommend the item to the top ‘M’ users. The algorithm will also observe the user action and retrains itself, if required.
10.3 Content-Based Recommendation Using Cosine Similarity
This topic discusses on recommending items based on the cosine similarity. To achieve this, first we should build: Item profiles and user profiles. Item profile represents the set of features of an item purchased or rated high by a particular user. It can be represented as a boolean vector based on whether a feature exists or not. (‘1’—feature exists and ‘0’—feature does not exist). The typical features of some of the products/items are shown in Table 10.1.
Similarly, build the item profile for each item purchased or rated by a particular user. User profiles are inferred or created from the item profile.
Table 10.1 Item/product vs features.
| Sl. no. | Item product | Features |
| 1. | Movie | Actor, director, composer, genre, etc. |
| 2. | Articles | Scientific, Social, News, Spiritual, Comic, etc. |
| 3. | Images | Meta data, tags, etc. |
| 4. | Dresses | Color, brand, cost, size, design, etc. |
| 5. | People | Set of friends, common Interests, etc. |
Building User Profile
Consider a user who has rated ‘n’ items, the respective item profiles are represented as i1, i2, i3….in. There are several ways to create the user profile from the item profile.
a. Simple Mean
Take all the items rated by the user and calculate the average of it. This is the simplest way to create the user profile (Table 10.2).
b. Weighted Mean
The weighted mean is calculated based on the below formula. This method takes into account the fact that the user likes certain item more than the other item and that is represented through the weight (Table 10.3).
Table 10.2 Simple mean.
| Sl. no. | Item | Rating |
| 1 | Book | 4 |
| 2 | Book | 3 |
| 3 | Movie | 3 |
| 4 | Dress | 2 |
| Average | 12/4 = 3 | |
Table 10.3 Weighted mean.
| Sl. no. | Item | Rating (Ri) | Weights (Wi) | RiWi |
| 1 | Book | 4 | 0.8 | 3.2 |
| 2 | Book | 3 | 0.6 | 1.8 |
| 3 | Movie | 3 | 0.6 | 1.8 |
| 4 | Dress | 2 | 0.4 | 0.8 |
| ∑Ri=12 | ∑Wi=2.4 | 7.6 | ||
| Weighted Avg = ∑RiWi / ∑Wi | 3.17 | |||

Ri = Rating of item ‘i’.
Wi = Weight of item ‘i’.
c. Normalized Ratings
This method normalizes the weight using the average rating of the user. Consider the item ‘Book’ and for keeping it simple, let’s consider only one feature, say, ‘Author’. Item profile can be represented as a Boolean vector with value ‘1’ or ‘0’ representing whether a particular author is present or not. Suppose, user ‘x’ has read 7 books from an online store—2 books authored by author ‘A’, 2 books authored by ‘B’ and 3 books authored by ‘C’. From this, the weight of feature ‘A’ can be calculates as 2/7 = 0.28, the weight of feature ‘B’ is calculated as 2/7 = 0.28 and the weight of feature ‘C’ is calculated as 3/7 = 0.43. The star ratings given by the user for the 7 books are shown in Table 10.4.
The Normalized ratings are shown in Table 10.5.
Making Predictions/Recommendations
Assume a new product/item is introduced in the online store. To decide, whether this product should be recommended for user ‘x’ or not, first we will build the item profile. After building the item profile, take a random user profile and the item profile of the newly introduced item and figure out, what rating for that item, likely to be given by the respective user. This is calculated by using the cosine similarity measure. Cos (theta) is used as the similarity measure. As theta becomes smaller cos (theta) becomes larger. As theta becomes larger cos (theta) becomes smaller. The cosine similarity measure is given as,
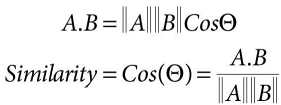
Table 10.4 Star ratings.
| Sl. no. | Book Id | Author name | Ratings |
| 1 | B001 | A | 4 |
| 2 | B002 | A | 3 |
| 3 | B003 | B | 5 |
| 4 | B004 | B | 3 |
| 5 | B005 | C | 4 |
| 6 | B006 | C | 5 |
| 7 | B007 | C | 4 |
| Users Average Rating | 4 | ||
Table 10.5 Normalized ratings.
| Author | Normalized rating | Profile weight | Positive/Negative |
| A | (4–4),(3–4)=(0, −1) | (0–1)/2 = −1/2 | Mild Negative |
| B | (5-4),(3–4)=(1, −1) | (1–1)/2 = 0 | Neither Positive nor Negative |
| C | (4–4),(5-4),(4-4)=(0,1,0) | (0+1+0)/3=1/3 | Mild Positive |
The parameters used in the above equations are explained in Table 10.6 Where, A and B are Vectors.
Table 10.6 TF-IDF parameters.
| Sl. no. | Parameter | Meaning |
| 1 | fij | frequency of term (feature)‘i’ in document (item)‘j’ |
| 2 | ni | number of docs that mention the term |
| 3 | N | Total number of documents |
The cosine similarity will be calculated for all the newly introduced items in the online store for a particular user ‘x’ and those items with highest cosine similarity would be recommended.
Building Item profile for textual documents
The item profile for textual documents is calculated using a technique called TF-IDF (Term Frequency – Inverse Document Frequency). This technique will help us to pick the set of important words from the document [1].

Where,

IDF value will be low for more common words like ‘the’, ‘a’, ‘is’ ‘was’ etc.…
Given a document, compute the TF-IDF score for every term in the document and then sort it based on TF-IDF score and then fix some threshold or pick the words with high TF-IDF score more than the threshold value and that will be your doc profile. In this case, it is a real valued vector as opposed to the Boolean vector.
10.4 Content-Based Recommendations Using Optimization Techniques
Let us discuss how to predict the missing values like star rating for a particular item would be given by a particular user. We shall discuss this with an example. Consider the star rating given for 6 books by 5 users as shown in the Table 10.7.
The above table represents the star ratings provided for 6 books B1, B2…B6 by 5 users User1, User2…. User5. The last 2 columns of Table 10.7, (X1 and X2) represents the degree of inclination of a given book towards X1 (self-help) or C2 (Drama). The field with ‘?’, represents that we don’t know the ratings of those fields. Let us discuss now, how to find the value of those fields using Content-Based Recommendation Systems.
- Nu = Number of users. (Nu = 5)
- Nb = Number of books. (Nb = 6)
- X1 – Degree to which the book is inclined towards ‘Self Help’.
- X2 – Degree to which the book is inclined towards ‘Drama’.
Each Book can be represented as a feature vector (X1->Self_Help, X2 -> Drama). We will add an extra feature which is the interceptor feature (X0 = 1). X0, X1 and X2 can take values between 0 and 1.
So, the feature Vector for

Table 10.7 Book ratings by users.
| Books | User1 | User2 | User3 | User4 | User 5 | Self Help (X1) | Drama (x2) |
| B1 | 4 | 4 | 0 | 0 | ? | 0.8 | 0.1 |
| B2 | 4 | ? | ? | 0 | 0 | 0.9 | 0.02 |
| B3 | ? | 5 | 0 | ? | 4 | 0.89 | 0.3 |
| B4 | 0 | 0 | 4 | 5 | 5 | 0.3 | 1.0 |
| B5 | 0 | 0 | 4 | ? | 5 | 0.2 | 0.8 |
| B6 | 5 | 4 | 5 | 4 | 0 | 0.88 | 0.2 |


‘n’ represents the number of features, excluding the interceptor feature (Hence, n = 2). For each user ‘j’, learn a parameter θj Ɛ R3 (in general R (n+1)). Predict ‘j’ as the rating for book ‘i’ with (θj)Txi stars. Every user will be associated with a different parameter vector. Let’s say the parameter vector associated with user1, user2, user3, user4 and user5 as θ1, θ2, θ3, θ4 and θ5 respectively.
Let’s assume that some unspecified learning algorithm has learned the parameter vector ‘θ1’ as
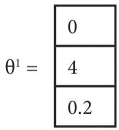
Which means that the user1 gives a weightage of ‘4’ for ‘Self Help’ books and a weightage of ‘0.2’ for ‘Drama’ oriented books. This can be considered as the ‘user profile’ for user1. Parameter can take values between 0 and 5 (or the highest star rating available).
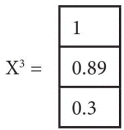
The prediction for B3 for user 1 will be
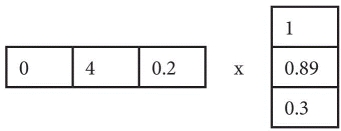
= (0 × 1 + 4 × 0.89 + 0.2 × 0.3) = 5 × 0.89 = 3.62 star rating.
Exercises
- Consider the parameter vector of (θ2)T as (0, 5, 2), then predict the star ratings for B2 by user2.
- Consider the parameter vector of (θ3)T as (0, 4, 3), then predict the star ratings for B2 by user3.
- Consider the parameter vector of (θ4)T as (0, 3, 1), then predict the star ratings for B3 and B5 by user4.
- Assume different parameter vector for (θ5)T and predict the star ratings for B1 by user1 and observe how the ratings vary.
Assuming some small random value for the parameter ‘θj’, the actual ‘θj’ i.e. the parameter vector for user ‘j’ can be learned using the following equation [2].

The various parameters used in the above equation is explained in Table 10.8.
In the above equation, the term ((θj)(Xi) – Yi,j) represents subtracting actual ‘Y’ from the predicted ‘Y’. The first part of the above equation is the squared error term and the second part of the above equation is the regularization term. The regularization term is included to ensure that the data performs better for the test data.
To learn θ1 , θ2 , θ3 ,………. θ (Nu) (and by multiplying the above equation by bj ), we shall rewrite the above equations as shown below.
Optimization Algorithm

Gradient descent update

Using the above optimization algorithm, we shall predict the missing star ratings for a given product for a particular user. Based on the predicted star rating, the algorithm shall decide whether the product should be recommended or not.
Table 10.8 Parameter vector estimation.
| Sl. No. | Parameter | Explanation |
| 1. | r(i,j) | Will be ‘1’, if user ‘j’ has rated book ‘i’. (0 otherwise). |
| 2. | y(i,j) | Rating by user ‘j’ on book ‘i’ (if defined). |
| 3. | θj | Parameter vector for user ‘j’. |
| 4. | bj | No. of books rated by user j. |
| 5. | xi | Feature vector for book ‘i’. |
10.5 Content-Based Recommendation Using the Tree Induction Algorithm
A tree induction algorithm is a form of decision tree algorithm. The decision points of the tree are in a top-down recursive way. The tree is similar to the conventional if ‘Yes’ then do A, if ‘No’, then do B, etc. Using tree induction algorithm, we shall create a system that suggests user to buy products based on the users taste. Let’s discuss this with an example:
Example: Induction Tree Algorithm (whether a user will purchase a ‘Car’ or not)
For Table 10.9, we can construct a tree using induction tree algorithm as shown in Figure 10.1.
Table 10.9 Chance of purchasing a car.
| Age | Income | Family size (fs) | Travel distance (td) | Buys car |
| ≤30 | High | Big | High | Yes |
| ≤30 | Low | Big | High | No |
| ≤30 | Medium | Big | High | Yes |
| 31 to 40 | High | Average | Medium | Yes |
| 31 to 40 | Low | Average | Medium | No |
| 31 to 40 | Medium | Average | Medium | Yes |
| >40 | High | Small | Low | Yes |
| >40 | Medium | Small | Low | Yes |
| >40 | Low | Small | Low | No |
| ≤30 | High | Average | Medium | Yes |
| ≤30 | Low | Average | Medium | No |
| ≤30 | Medium | Average | Medium | Yes |
| 31 to 40 | High | Small | Low | Yes |
| 31 to 40 | Low | Small | Low | No |
| 31 to 40 | Medium | Small | Low | Yes |

Figure 10.1 Induction tree algorithm.
Each of the path of the tree says that whether it ends up in buying or not. This tree is constructed using decision tree induction algorithm. The decision tree algorithm helps us to partition the data in the appropriate way. Here the ‘Income’ is selected as the root of the tree. But, why only ‘income’? and why not any other parameter. This is decided using the attribute selection measure. There are many attribute selection measures. Here, we will discuss one such measure. The information gain for each parameter is calculated using the below formula:
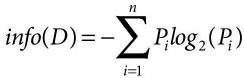
Expected Information (Entropy) needed to classify a tuple in the entire dataset (D):
Information needed to classify/branch based on a specific attribute (A)
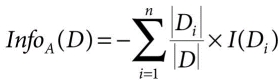
Information gained by branching on attribute A
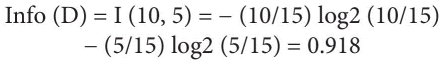
Let us say ‘Pi’ is the probability of buying the ‘Car’ is (10/15). Out of 15 tuples in Table 10.9, ten (10) tuples represent that the car is purchased. ‘Ni’ is the probability of not buying the ‘Car’ is (5/15). Out of 15 tuples in Table 10.9, five (5) tuples represent that the car is not purchased. The whole dataset can be represented as, Di = {Pi, Ni}.
Applying the above formula for the case whether the person will buy a computer or not:
Information of the entire data set
a. Information Content for the attribute ‘Age’
Here, the first (6/15) I (4, 2) represents that out of the 15 tuples 6 tuples corresponds the case where the age ≤30, out of which 4 tuples represents ‘yes’ and 2 tuples represents ‘no’ for the attribute ‘Buys Car’. Similarly, the next (6/15) I (4, 2) represents that out of the 15 tuples 6 tuples corresponds to the case where the age is between 31 and 40, out of which 4 tuples represents ‘yes’ and 2 tuples represents ‘no’ for the attribute ‘Buys Car’. The next, (3/5) I (2,1) represents that out of 15 tuples 3 tuples correspond to the case where the age is greater than 40, out of which 2 tuples represent ‘yes’ and 1 tuple represents ‘no’ for the attribute ‘Buys Car’ (shown in Table 10.10).
b. Information Content for the attribute ‘Income’
The information content calculation for income is shown in Table 10.11.
Table 10.10 Information content calculation for age.
| Age | Pi | Ni | I(Pi, Ni) | Infoage (D) |
| ≤30 | 4 | 2 | 0.918 | (6/15)*0.918 = 0.367 |
| 31 to 40 | 4 | 2 | 0.918 | (6/15)*0.918 = 0.367 |
| >40 | 2 | 1 | 0.918 | (3/15)*0.918 = 0.183 |
| Infoage (D) | 0.918 | |||
Table 10.11 Information content calculation for income.
| Income | Pi | Ni | I(Pi, Ni) | Infoage (D) |
| High | 5 | 0 | 0 | (5/15) * 0 = 0 |
| Low | 0 | 5 | 0 | (5/15) * 0 = 0 |
| Medium | 5 | 0 | 0 | (5/15) * 0 = 0 |
| Infoage (D) | 0.0 | |||
Similarly, Gain of Family Size, Travel Distance are calculated:
- Gain (Family Size) = 0.0
- Gain (Travel Distance) = 0.0
Python function to calculate the Info (D) is given below (Figure 10.2). The above function shown in Figure 10.2 can be called as:

The function shown in Figure 10.2, can be used to find Infoincome (D), as shown below:


Figure 10.2 Python function to calculate Info (D).

Figure 10.3 Induction tree for ‘buying a car example’.
The parameter with the highest information gain will be considered as the root node. Income has the highest information gain, so we will consider ‘Income’ as the root node for constructing the decision tree.
From Figure 10.3, we can see that the tree is completely partitioned. The branches ‘High’ and ‘Medium’ of the induction tree contains only tuples with value ‘yes’ for the, ‘Buys Car’ attribute. Similarly, the branch ‘Low’ of the tree contains only tuples with value ‘no’ for the ‘Buys Car’ attribute. If there, are mixed values of ‘yes’ and ‘no’ for the class attribute (‘Buys Car’) then, we should repeat the entire above process for that particular sub-table by calculating the Info(D), InfoA(D). This process should be continued until the class/decision attribute holds all ‘yes’ or ‘no’ for the particular branch/sub branch.
10.6 Summary
This chapter described the various Content-Based Recommendation techniques. First, we discussed the several phases of Content-Based Recommendation systems. Followed by, the various techniques like Content-Based Recommendation using cosine similarity, Content-Based Recommendation using optimization techniques and Content-Based Recommendation using Induction Tree algorithm are discussed. In Content-Based Recommendation using cosine similarity technique, we build the item profile for every product and also we build the user profile for every user. The item profile and user profiles are represented as vectors. When a new item is introduced in the online store, an item profile will be created for that particular product (which is a vector). The cosine similarity will be calculated between the new item and all the users individually. The item will be recommended for the top ‘M’ users with highest cosine similarity value. The Content-Based Recommendation using optimization techniques is used basically to predict the rating for a particular product by a given user. To do this, we first identify the feature vector for every product and then we identify the parameter vector for every user. To predict the star ratings of a particular user for a specific product, we take the parameter vector of the respective user and transpose it, and then it will be multiplied with the feature vector of the specified product, the resultant value will be considered as the star ratings corresponding to that product for a given user. To, identify the feature vector initially we start with some random small values and using the optimization techniques, we shall arrive at the optimal feature vector. The Content-Based Recommendation using induction tree algorithm uses a tree called as the induction tree, which is similar to the ‘if ’/‘else’ construct. The induction tree algorithm helps us to estimate the node/attribute with high information content. The node with the high information content will be selected as the root node and the tree will be partitioned accordingly. This process continues for the sub trees also, until the tree is completely partitioned.
References
- 1. http://snap.stanford.edu/class/cs246-2015/slides/07-recsys1.pdf
- 2. https://www.coursera.org/lecture/machine-learning/content-based-recommendations-uG59z
- 3. https://nptel.ac.in/content/storage2/nptel_data3/html/mhrd/ict/text/110105083/lec52.pdf
- 4. Mooney, R.J., Content-Based Book Recommending Using Learning for Text Categorization. Proceedings of SIGIR-99 Workshop on Recommender Systems: Algorithms and Evaluation, Berkeley, CA, 1999.
- 5. Pazzani, M.J. and Billsus, D., Content-Based Recommendation Systems, in: The Adaptive Web. Lecture Notes in Computer Science, vol. 4321, Springer, Berlin, Heidelberg, 2007.
Note
- Email: [email protected]