
In This Chapter
Printing Quicken reports
Using the Reports menu commands
QuickZooming report totals
Sharing information with a spreadsheet
Editing and rearranging report information
Creating a chart
Using QuickReports
Quicken enables you to summarize, slice, and dice register and account information in a variety of ways. This chapter describes how to use reports and produce graphs easily. This stuff is much easier to understand if you know how to print a transaction list first (a trick I describe at the end of Chapter 5).
After you know how to print checks and transaction lists, all other printing in Quicken is easy, easy, easy.
The transactions you enter in the transaction list window or a transaction form and the checks you enter in the Write Checks window determine the information in a report. To print a report, just choose the Reports menu and tell Quicken which report you want to print.
Quicken produces a bunch of different reports. To make sense of what may otherwise become mass confusion, Quicken arranges all its reports into groups: Banking, Comparison, Investing (available when you've set up investment accounts), Net Worth & Balances, Spending, Tax, Rental Property (if you're using Quicken Rental Property Manager), and Business (if you're using Quicken Home & Business).
To see the reports in one of these groups, click the Home, Banking, Planning, or Business tab, click the All Reports and Graphs button, and then select the report group on the Reports menu. As you may know, those little triangles to the right of menu commands tell you that another menu follows.
Figure 7-1 shows the Banking group of reports. Pretty exciting stuff so far, don't you think?

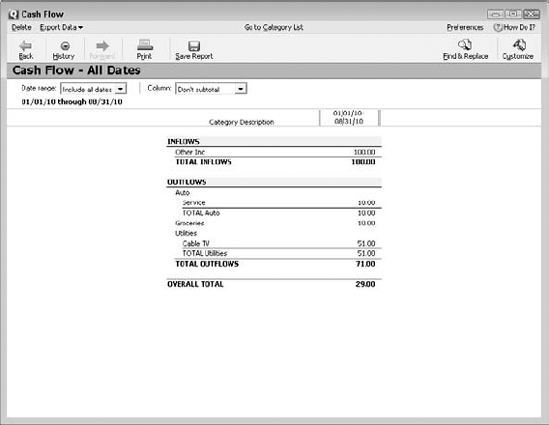
To create a Cash Flow report (or any other report, for that matter) on the fly, choose the report on the appropriate menu. For example, to create the Cash Flow report, click the Home tab, click the All Reports and Graphs button, and choose Banking
To find out what type of information a report includes before you create the report or to preview a report, click the All Reports and Graphs button and then choose Reports & Graphs Center. This displays the Reports & Graphs window, shown in Figure 7-3. Select a report group by clicking a topic on the left side and then select the report with the report group that you want to create. (In Figure 7-3, the Spending report group is selected and therefore shown. Within the Spending report group, the Spending By Category report is selected and therefore shown.)
You can change the report date or date range by using the box(es) provided. Click the Show Report button to create the report. If you don't enter a new range of dates, Quicken assumes that you want to include transactions from the start of the current calendar year through the present date.

Reports that show account balances — such as the Account Balances report, the Net Worth report, the Balance Sheet report, or the Portfolio Value report — don't need a range of dates because these reports show account balances as of a specific date. In these cases, if you don't enter a date, Quicken assumes that you want account balances for the current system date from your computer's internal clock.
You can't see the entire on-screen version of a report unless your report is very small (or your screen is monstrously large). Press the PgUp and PgDn keys to scroll up and down and use Tab and Shift+Tab to move right and left. Or if you're a mouse lover, you can click-and-drag various pieces of the scroll bars.
To print your report, follow these steps:
Click the Print Report button.
Quicken displays the Print dialog box (see Figure 7-4).
To accept the given specifications — which are almost always fine — just click Print.
You'll never guess what happens next: Quicken prints the report!
(Optional) To modify the default printing suggestions, use the option buttons and text boxes in the Print dialog box to mix it up a bit and then click Print:
Print To: The Print To option buttons let you tell Quicken where it should send the report it produces: to the printer or to a disk file. If you choose to print it to a file, Quicken displays another dialog box you use to specify where the print file should be located and what the print file should be named. (I describe how this print-to-file option works in Chapter 5, so I won't repeat the discussion here. If you want the scoop, refer to the section about printing a check register.)
Print Range: Printing a long report? Consider using the Print Range option buttons and text box to specify that you want to print only a specified range of pages. As you might guess (if you're a clever person), click the Pages button and then specify the individual pages (separating each page by a comma) or the range of pages (separating the start and end page range with a hyphen). For example, the following page-range specification says, "Hey Quicken, print pages 1, 4, and 5 and, oh shoot, I don't know, maybe the page range 34 through 41 as well."
1, 4, 5, 34–41
Copies: As you probably guessed, use the Number Of Copies text box to tell Quicken to print multiple copies of a report.
Page Scaling: For some reports — although not all — you can use the Page Scaling option buttons and text boxes to tell Quicken that it should try to squish the report onto a smaller number of pages. Ever the thoughtful software program, Quicken provides two squishing methods. You can click the Page Scaling Adjust To option button and then enter a squishing percentage. Or you can click the Page Scaling Fit To option button and then specify the report size as a certain number of pages wide by a certain number of pages tall.
Print What: The Print What check boxes let you flip-flop between printing a graph and printing a report of the Quicken data you've said you want to see a report on. The easiest way to see what this report option does is to click and unclick.
Orientation: The Orientation option buttons allow you to specify how Quicken prints a report on pages: vertically (Portrait) or horizontally (Landscape). Again, if you're confused about this option, experiment by clicking the different buttons.
Note: When you click a Print dialog box button or enter some value in a Print dialog box field, Quicken redraws the Preview box to show you what the report looks like with your new specification.
Ink Color: If you use a color printer, Quicken provides Ink Color option buttons, which let you choose whether you want to print the report in expensive colored ink, in cheap black ink, or in shades of gray so that you can go all film noire about your finances.
Fonts: The two Change Font buttons let you customize the look of your report by changing the font settings (point size, font, style, and so on) of the text used for your report's header text and body text. I feel kind of like a broken record saying this, but, dude, seriously — the way to most easily figure out what these options do is simply to experiment. You can't foul up or corrupt your Quicken data by fiddle-faddling with the Print dialog box settings. And this is true even if you do something truly visually outrageous.
Adjust Margins: Click the Adjust Margins button to add margin-setting boxes to the Preview area in the Print dialog box. After Quicken adds these margin-setting boxes, you can change the printed report's margins by changing the margin settings.

Tables 7-1 through 7-8 describe the Quicken reports by group. (Some of these babies won't make sense unless you understand how to collect the information that goes into the report, as I describe in Chapters 13, 14, 15, and 16.)
Table 7-1. Quicken Banking Reports
Description | |
|---|---|
Banking Summary | Summarizes spending totals by category. |
Cash Flow | Summarizes the money that flows into and out of an account by income and expense categories and by transfers. Cash is king, dude, so this report includes only those transactions that you record in your bank, cash, and credit card accounts. |
Cash Flow By Tag | Summarizes the money that flows into and out of an account not only by income and expense categories and by transfers, but, get this — also by tags. Perfect for the active real estate investor. |
Missing Checks | Lists all the checks you've written and flags any gaps in the check number sequence. This report helps you identify missing checks. |
Reconciliation | Summarizes an account reconciliation that you've performed. You don't need this report, really, unless you have a clinical anxiety disorder and need to prove to yourself or your accountant that you really did reconcile your account. |
Transaction | Lets you list transactions in multiple accounts chronologically. |
Table 7-2. Quicken Spending Reports
Report | Description |
|---|---|
Itemized Categories | Lists transactions by category. |
Itemized Payees | Lists transactions by payee. |
Spending By Category | Graphs spending and lists transactions by category. |
Spending By Payee | Graphs spending and lists transactions by payee. |
Current Spending Vs. Average Spending By Category | Summarizes spending by category and compares category totals with the average category total over the last six months. |
Current Spending Vs. Average Spending By Payee | Summarizes spending by payee and compares payee totals with the average payee total over the last six months. |
Summarizes income and spending by category. | |
Income And Expense By Payee | Summarizes income and spending by payee. |
Budget | Summarizes income and expense categories and compares actual category totals for the year to budgeted category amounts. This report includes only transactions that you record in your bank, cash, and credit card accounts. (For this report to work, of course, you need to have a budget set up.) |
Monthly Budget | Summarizes income and expense categories and compares monthly actual category totals to monthly budgeted category amounts. This report includes only transactions that you record in your bank, cash, and credit card accounts. (For this report to work, of course, you need to have a budget set up.) |
Table 7-3. Quicken Comparison Reports
Report | Description |
|---|---|
Current Spending Vs. Average Spending By Category | Summarizes spending by category and compares category totals to the average category total over the last six months. |
Current Spending Vs. Average Spending By Payee | Summarizes spending by payee and compares payee totals with the average payee total over the last six months. |
Cash Flow Comparison | Lets you compare category totals from two periods. You can use this report to compare January's activity with February's activity, for example. Remember: Because you're comparing two periods, you need to enter two transaction date ranges. |
Income And Expense Comparison By Category | Summarizes spending totals by category for two time periods. |
Income And Expense Comparison By Payee | Summarizes spending totals by payee for two time periods. |
Profit and Loss Comparison | Compares one period's income and expense with a previous period's income and expense. |
Table 7-4. Quicken Investing Reports
Description | |
|---|---|
Capital Gains | Lists all the realized gains on individual investments you hold. (A capital gain occurs when an investment is worth more than you paid for it. When you sell the investment, you realize the gain.) |
Investing Activity | Shows investment transactions grouped by activity. |
Investment Asset Allocation | Shows investments by asset class. |
Investment Income | Summarizes income and expense categories for the transactions you record in your investment accounts. |
Investment Performance | A power user report. This report calculates the internal rates of return delivered by each of the individual investments in your portfolio. |
Investment Transactions | Lists recorded transactions for all your investment accounts. |
Portfolio Value | Lists the current value of all securities in your investment accounts. |
Portfolio Value & Cost Basis | Lists the current value and cost of all securities in your investment accounts. |
Table 7-5. Quicken Tax Reports
Report | Description |
|---|---|
Capital Gains | Lists all the realized gains on individual investments you hold. (A capital gain occurs when an investment is worth more than you paid for it. When you sell the investment, you realize the gain.) |
Schedule A-Itemized Deductions | Lists and summarizes transactions that probably belong on your Schedule A tax form as itemized deductions: mortgage interest, property taxes, charitable contributions, and so on. |
Schedule B-Interest And Dividends | Lists and summarizes interest and dividend income transactions that need to be reported on your Schedule B tax form. |
Schedule D-Capital Gains And Losses | Lists and summarizes capital gain and loss transactions that need to be reported on your Schedule D tax form. |
Lists all transactions you've entered as tax-related and subtotals them by line item. | |
Tax Summary | Lists all transactions you've described as falling into tax-related categories. |
Table 7-6. Quicken Net Worth & Balances Reports
Report | Description |
|---|---|
Account Balances | Lists all accounts, their balances, and the difference between the sum of the asset accounts and the sum of the liabilities accounts, which the report identifies as your net worth. |
Net Worth | Lists all accounts and their balances. |
Table 7-7. Quicken Rental Property Reports
Report | Description |
|---|---|
Schedule E | Displays profit and loss data by property, which is what you need to complete the Schedule E tax form. |
Cash Flow | Summarizes rental property cash income and cash expenses for a specified time period. |
Cash Flow Comparison | Compares rental property category totals from two periods. |
Tax Schedule | Shows all the individual transactions for each rental property income amount and deduction amount reported on your Schedule E tax form. |
Table 7-8. Quicken Business Reports
Report | Description |
|---|---|
Accounts Payable | Summarizes the vendor bills you've recorded but not yet paid. |
Accounts Receivable | Summarizes unpaid customer invoices. |
Reports on account balances at a point in time. If you've set up all your business assets and liabilities in Quicken, this account balances report works as a business balance sheet. | |
Cash Flow | Summarizes the money flowing into and out of business accounts by income and expense categories and by account transfers. |
Cash Flow Comparison | Compares cash flows by category totals from two periods. |
Missing Checks | Lists all the business checks you've written and flags any gaps in the check number sequence. |
Payroll | Summarizes transactions that use payroll in the category name. |
Profit And Loss Comparison | Compares one period's income and expense with a previous period's income and expense. |
Profit And Loss Statement | Summarizes a business's revenues and expenses for a particular period of time. |
Project/Job By Business Tag | Shows income and expenses by business tag. |
Project/Job By Project | Shows income and expenses by job or project. |
Schedule C | Displays profit and loss data by business, which is what you need to complete the Schedule C tax form(s). |
Tax Schedule | Shows all the individual transactions for each business income amount and deduction amount reported on your Schedule C tax form. |
Okay, if you've read or even skimmed the reports I describe in Tables 7-1 through 7-8, you're probably a little overwhelmed. Quicken produces a bunch of different reports. How do you know which one provides the answers you want? What are you supposed to do? Sift your way through three dozen of these babies?
Thankfully, the answer is no. Quicken also provides something called EasyAnswer reports. In effect, EasyAnswer reports let you identify the question that you want a report to answer. After you identify the question, Quicken produces the appropriate report. Here's how this all works:
Click the All Reports and Graphs button and choose EasyAnswer.
Quicken displays the EasyAnswer topic in the Reports & Graphs window.
Indicate your question.
To tell Quicken what your question is, click one of the questions, and then use the drop-down list boxes that accompany each question to further refine your question. For example, the "Where did I spend my money?" question lets you pick the period of time you're asking about: Last Year, Last Month, Current Year, Month to Date, and so on.
Click Show Report.
Quicken produces a report that answers your questions. For example, if you ask, "Where did I spend my money last year?" Quicken produces a Cash Flow report that summarizes the previous year's income and expenses by category.
You can do some neat things with the reports you create. I won't spend a bunch of time talking about these things, but I do want to give you a quick rundown of some of the most valuable tricks.
If you don't understand where a number in a report came from, point to it with the mouse. When you point to numbers, Quicken changes the mouse pointer to a magnifying glass marked with a +. Double-click the mouse, and Quicken displays a list of all the transactions that make up that number.
This feature, formerly known as QuickZoom, is extremely handy for understanding the figures that appear on your reports. If you double-click the Utilities number in the report in Figure 7-2, for example, Quicken displays the report shown in Figure 7-5.
Ah, yes. Two cable TV bills. And you're not even buying the premium channels package. Yikes.
You can sometimes fix erroneous report data right in a report window. If you select a report transaction and Quicken enables the Edit button (shown in the upper-left corner of the report window), you can click the button to display an Edit menu. The menu lists editing commands you can use to delete the selected transaction or to change the category, payee, or memo information.

If you're looking at the Quicken register and you select either the Payee or Category field, Quicken adds a mini-report button to the end of the field. (The actual mini-report button looks like a small piece of paper.) If you click the mini-report button, Quicken creates a small report that summarizes the transactions falling into the same category or transactions with the same payee, as shown in Figure 7-6.
If you click the Show Report button, which appears in the mini-report window, Quicken creates a transaction report for the same information shown in the mini-report.
If you use Microsoft Excel, you can export the report to the spreadsheet program. Just click the Export Data button and choose the Report To Excel Compatible Format option. Quicken displays a dialog box you use to name and locate a tab-delimited text file. (Any spreadsheet program worth its salt can open a tab-delimited text file.) You may need to use this feature if you want to use a spreadsheet to analyze the report data.
You can also copy the stuff that shows in a report window to the Clipboard. Just click the Export Data button and choose the Copy Report To Clipboard command. Then, to use the copied report, start your spreadsheet (or other) program and choose Edit

Customizing your reports
If you want to extract some financial tidbit, you can usually get what you want from one of the reports listed on the Reports menu, especially if you use the EasyAnswer feature to find the right report!
I should tell you something: Quicken is remarkably sophisticated in its reporting. You can customize any report you see on the Reports menu.
To customize these reports, click the Customize button to get to the nuts and bolts of your selected report.
I'm not going to describe the customization process. I feel kind of bad about this omission because a few people are probably out there who, late one night, will decide that they want to know how to filter, sort, and customize. Of course, there are also people who will decide late some night that they want to know how to replace the transmission on a 1971 Triumph Spitfire. And I'm not describing that here, either.
If you really want to customize your reports, just noodle around. You can't hurt anything.
If you do play around with these items, you can save any custom report specifications that you create. To do so, click the Save Report button at the top of the report window. Quicken displays a dialog box that asks you to supply a name for your customized report. (You can also provide a default report date range.) After you name the customized report, Quicken lists it whenever you choose Reports
You may notice that when Quicken displays the report window, it also displays a row of buttons, including Back, Customize, Delete, Export Data, Forward, History, Preferences, Save Report, and Sort (refer to Figure 7-2). Also appearing are the Date Range and the Subtotal By drop-down list boxes. Earlier in the chapter, in "Printing the facts, and nothing but the facts," I talk about what the Date Range drop-down list box does. So in the interest of fair play, I briefly discuss what the other buttons do. (Not all these buttons are available in every report document window. And sometimes Quicken uses different names to refer to them. I don't know why, really. Maybe it's just to keep you guessing.)
You really don't need to worry about these other buttons. Read through the discussion that follows only if you're feeling comfortable, relaxed, and truly mellow. Okay?
The Back and Forward buttons let you move back and forth between open report windows. The History button displays a list of the windows you've displayed; you can choose a previously displayed window by clicking it in the list.
The Delete button deletes the current report from the report list. You can use this button to, in effect, undo any changes you've made to a report and return to the default report specifications.
I talk about this option in the "Sharing report data with spreadsheets" and "Sharing report data in PDF files" sections, earlier in this chapter. Look there if you have questions.
The Sort button displays a list of sorting options that you can use for arranging information on the report. Enough said.
Say you get into this customization thing. If you do, you should know that you can save your customized reports by clicking the Save Report button. When you click Save Report, Quicken displays the Save Report dialog box, shown in Figure 7-7. Mostly, Quicken displays this dialog box so that you can give your creation a name. You also use this dialog box to indicate in which financial activity center Quicken should save your report.
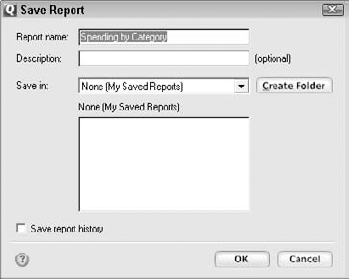
By the way, after you create a saved report, you can reproduce it by selecting the report from the My Saved Reports section of the Reports & Graphs Center.
When you click the Preferences button, Quicken displays a Preferences dialog box with a bunch of boxes and buttons that let you change the way the window looks or works.
If I were a really great writer — the Stephen King of computer books, for example — I might be able to whip up a riveting discussion of how the Preferences dialog box works. I'm going to do both you and my publisher a favor, however, by making a suggestion: Just play with these option settings if you're interested. You'll find it more fun and a better learning experience.
I briefly mention the Date Range box earlier in this chapter, but here I provide a slightly more detailed description. The Date Range box displays a drop-down list that you can use to specify what time period you want listed on your report: the current month, last year, the current quarter to date, and so on.
The Column drop-down list box displays a list that enables you to tell Quicken you want subtotal amounts by some criterion, as shown in Figure 7-8. Just select the criterion. Note that sometimes Column is replaced with Subtotal By.

The Customize button works pretty much the same no matter which report shows in the document window.
When you click this button, Quicken displays a dialog box that lets you enter the report title and specify the range of dates the report should cover by using text boxes. It also lets you choose from a variety of other options, too, such as which accounts to use, which transactions to use, and how the report's information should be arranged.
I love charts. I know that sounds goofy. But data graphics — as the snobs and academics call them — open up wonderful opportunities for communicating. And Quicken charts are really easy to use.
In fact, many times, Quicken will add a small chart to a report window. Take a look at Figure 7-8, for example, and see what I mean. You can also display just a chart, however.
To produce just a Quicken chart, first choose the report you want by using the Reports & Graphs window, which you get by choosing the EasyAnswer command from the Reports & Graphs window. Then select the report you want and click the Show Graph button. That's it. Easy as rolling off a log.
Note: Not all reports provide data that can be plotted in a graph. Accordingly, you won't see a Show Graph button in every report window.
Figure 7-9 shows a picture of a bar graph of income and expense figures, but you'll have much more fun looking at your own data in a picture. By the way, you can drill down (described earlier in this chapter in "Got a question about a number? Just zoom it") through a chart to see a report that describes the data being plotted.

You can memorize customized graphs the same way you memorize customized reports. Just click the Save Report button at the top of the graph window. Then, when Quicken prompts you, give the graph a name. To later reuse the graph, select the graph from the My Saved Reports section of the Reports & Graphs Center.
Before I forget, I need to tell you about one other variant of the Quicken reporting feature: QuickReports. Ah, yes, QuickReports. Here's the deal. Quicken supplies a quick-and-dirty report called, cleverly enough, a QuickReport. If you're working with the transaction list, you can produce a quick report that summarizes things, such as the checks written to a particular payee or the transactions assigned to a specific income or expense category.
To produce a QuickReport, first move the cursor to the field that you want to summarize in the report. Then right-click the field to display a shortcut menu. Typically, the second-to-last command will produce a QuickReport. The report shown in Figure 7-10, for example, is a QuickReport that shows the payments you've received from your Aunt Enid. She is such a sweetheart. (The name of the second-to-last command selected was, "Payments Received From Aunt Enid.)
Note: The very last command on the shortcut menu will usually (if selected) produce a mini-report, like that shown in Figure 7-6.
