
This chapter focuses on logging and system reporting in K2 blackpearl.
Logging: Is the process of storing information about events that occurred on the K2 blackpearl server.
System reporting: Is the process of collecting and analyzing data to measure the performance of the product, process, or activity against expected results. It is a collection of server, network, and application performance metrics.
Logging allows you to record information about process execution in K2 blackpearl. This information is typically used by workflow developers for debugging purposes, and additionally, depending on the type and detail of information contained in the logging information, by experienced system administrators or technical support personnel to diagnose common problems with K2 blackpearl.
System reporting is done in K2 blackpearl via Windows Performance Monitoring (PerfMon). PerfMon is a tool that goes unused far too often, and when it does get used, it is often misinterpreted. It is a vital and most valuable tool in determining overall system health and activity, and the most common use of PerfMon is to answer the burning question, "Why is my system running slow?" So, in this chapter the various K2 blackpearl counters for PerfMon will be discussed and how these can be used to monitor the overall system health and activity of K2 blackpearl.
As previously indicated, K2 blackpearl logging is used to store information about various events that have taken place on the K2 blackpearl server.
The base framework for the K2 server components is a hostable runtime environment that provides common infrastructure, such as communication, security, Single Sign-On, session management, logging, high availability, and server component federation.
Several server modules that provide different pieces of functionality are built into the Host Server. Each of these modules can make use of any of the common infrastructure components and are pluggable, allowing for the separation of modules onto different machines to maximize performance. The host environment also allows developers to build their own services that can be hosted within the framework. The server modules included with the platform are as follows:
SmartObject Server
Workflow Server
SmartFunction Server
Category Server
Environment Library
Event Bus
Dependency Server
User Rights Management Server
These server-side components are used for managing the operations of the K2 blackpearl environment. K2 server is one of the principle components responsible for running the processes that are exported to it from the designers. The K2 server requires access to its databases for the successful completion of the process instances and for successful running.
The logging feature is a useful feature common to all Host Servers. By default, messages are logged to a text (*.log) file, but the Host Server is capable of logging to different locations as well, such as the Windows Event log, the console, Microsoft Message Queuing (MSMQ), and SQL. All hosted servers and services use the same Logging Framework.
One of the first log files that is created in K2 blackpearl is the installation log file that is created during the installation process.
The K2 blackpearl installation log file allows you to troubleshoot installation issues. Occasionally a problem occurs with the K2 blackpearl setup, and you may have to use the installation log file as one of your tools to determine what the issue is.
During the installation and configuration of K2 blackpearl, a log file is created. Once the Configuration Manager has finished running, a link to the log file detailing the installation is available by clicking on this link surfaced through the Configuration Manager. The content of the installation log file is useful when diagnosing issues with the installation.
The log file is created by the Configuration Manager, and the installation log files can be found in the following location:
%PROGRAMFILES%K2 blackpearlConfigurationLog
The installation log file is called InstallReport.log, and an example of an installation log file is shown in Figure 19-1.

The installation log file contains details of the following:
System information:
Processer
System
Operating system
K2 components and version numbers:
K2 for Visual Studio
K2 for Visio
K2 blackpearl server
K2 Workspace
K2 SharePoint (MOSS) or K2 SharePoint (WSS)
K2 for Reporting Services
K2 Documentation
K2 blackpearl Configuration Manager
In addition to all this information, a detailed list of the relevant dependencies for each component are logged in the Installation log file.
The Installation log file is an excellent resource to debug installation problems with the K2 Support Team and will show details about the original installation, any upgrades to the K2 blackpearl server, and any SharePoint installation.
Once your K2 blackpearl installation is up and running, the K2 blackpearl Logging Framework allows you to view details across the several server modules that provide different pieces of functionality in the K2 blackpearl Host Server.
The Logging Framework listens for messages of various severity levels from a range of classes and extensions that interact with it. These messages range from informational messages to error messages to debugging information to warning messages.
The Logging Framework, out-of-the-box, supports recording and displaying these messages in several different locations, including the K2 server console, the K2 server log file, the Event log, an archive extension, and MSMQ.
The Logging Framework is also built with the flexibility to select which loggers are active and the severity levels of each logger. With the flexibility of the Logging Framework, you can turn on or off any standard loggers or custom loggers and set different severity levels to suit the dynamic needs of any business.
K2 blackpearl ships with five different logging extensions. Each extension handles messages differently and should be sufficient for standard business needs. The logging extensions that are shipped with K2 blackpearl are listed in the following table:
Logging Extension | Description |
|---|---|
| When the Console extension is turned on, messages are logged to the K2 server console when the server is running in console mode. |
| When the File extension is turned on, messages are logged to the K2 server log file. |
| When the Event log extension is activated, messages are recorded to the machine's Event log. |
| When the Archive extension is activated, messages are logged to SQL Server. This allows queries to be run against logged messages. |
| When using the MSMQ extension, messages can be logged to the Microsoft Messaging Queue. A logger can then be set up to monitor the Message Queue for messages and take action when necessary. |
Custom loggers can also be created and plugged into the Logging Framework. These logging extensions are controlled in the HostServerLogging.config file.
The K2 blackpearl Logging Framework contains its own XML-based configuration file, HostServerLogging.config. This consists of all the Logging Framework configuration settings as well as a list of message categories and specific predefined messages.
The HostServerLogging.config file can be found in the following location:
%PROGRAMFILES%K2 blackpearlHost ServerBin
The HostServerLogging.config file is a user-friendly and flexible configuration system, one that enables you to easily customize these configuration values postdeployment. Configuration data is stored in plain text files that are both readable and writable. Any standard text editor, XML parser, or scripting language can be used to interpret and update the configuration settings.
At run time, the HostServerLogging.config file is used to hierarchically compute a unique collection of configuration settings for each request. These configuration settings are calculated only once and then cached on the server. Any changes to the configuration file are detected and automatically applied to the affected applications. Hierarchical configuration settings are automatically calculated and cached again whenever a configuration file in the hierarchy is changed.
A typical HostServerLogging.config file looks as shown in Figure 19-2

The Logging Framework queues the messages in an internal "first in, first out" principle until the logging thread has been scheduled to obtain and process them.
Starting the Logging Framework forces the initialization of internal settings from the HostServerLogging.config file. The information in the HostServerLogging.config file settings section is stored as key/value pairs. The K2 blackpearl Logging Framework loads the values from the HostServerLogging.config file without the need to change the K2 blackpearl Logging Framework's source code.
The next sections discuss the composition of the HostServerLogging.config file.
The appSettings section in the HostServerLogging.config file contains the general settings for the Logging Framework, including things such as date formats, log file sizes, and so on.
The appSettings section in the HostServerLogging.config file looks as follows:
<appSettings>
    <!-- Set Date format-->
    <add key="DateFormat" value="yyyy-MM-dd hh:mm:ss" />
    <!-- Set base Log Level; should be "All"-->
    <add key="LogLevel" value="All" />
    <!-- Create Checksum/Hash for each row in logfile -->
    <add key="RowHash" value="False" />
    <!-- Adust Logger Thread Priority Low/Normal/High -->
    <add key="ThreadPriority" value="Low" />
    <!-- Enable/Disable Async Queueing True/False-->
    <add key="AsyncQueueEnabled" value="True" />
    <!-- Message Logged was an Exception, Include Stack Trace -->
    <add key="IncludeStackTrace" value="False" />
    <!-- Keep Log Files below this size. 0 = No Limit -->
    <add key="MaxFileSizeKB" value="0" />
    <!-- Keep Log Files below Timespan days:hours:minutes:seconds -->
    <add key="MaxFileTimeSpan" value="0:0:0:00" />
    <!-- Preserve Log Files SequenceNumber between restarts -->
    <add key="PreserveSequence" value="True" />
    <!-- Add GUID per log entry -->
    <add key="AddGUID" value="True" />
    <!-- Set MSMQ Path-->
    <add key ="MSMQActive" value="false"/>
    <add key="MSMQPath" value=".private$SCQueue"/>
</appSettings>
The general settings of the appSettings xssection along with a description and their possible values can be seen in the following table:
Key | Description | Possible Values |
|---|---|---|
| Use this key to format the Log Entry's date format. All date formats are supported using the standard notation used. If this value is left blank, the complete default ISO 8601 format (yyyy-mm-dd hh:mm:ss) will be used. | User defined |
| Each log message has an associated log level. The level gives a rough guide to the importance and urgency of a log message. The log file keeps track of a log level that was specified and discards log requests that are below this level. | All, Debug, Info, Warning, Error |
| The | True, False |
| Every thread has a base priority level. The priority level of all executable threads is used to determine which thread is allocated the next available piece of CPU time. Only when there are no executable threads at a higher level does scheduling of threads at a lower level take place. This key allows one to adjust the Logger Thread Priority to Low, Normal, or High. Note: It is recommended that you set the ThreadPriority to Low as setting the Thread Priority to Normal or High would mean that the thread priority of the K2 blackpearl Logging Framework takes precedence to the K2 blackpearl server activities, making the K2 blackpearl server slower. | Low, Normal, High |
| Allows you to enable or disable the asynchronous queuing. Note: Set this value to False to ensure that all error messages are logged. This is helpful when a configuration change prevents the Host Server from starting. | True, False |
Specify whether or not to include a Stack Trace when the message logged was an exception. By default this key will be set to False. The | True, False | |
| Specify the maximum size for log files here; a 0 value will specify that there is no limit on the size of the file. When the set maximum size has been reached, a new log file will be created. | User-defined |
| Allows you to keep log files for a specific time span. This is configured in the format days:hours:minutes:seconds. | User-defined |
| Allows you to preserve log files sequence numbers between restarts. | True, False |
| Allows you to add a GUID per log entry. | True, False |
| Allows you to toggle MSMQ between active and inactive. | True, False |
| Allows you to set the MSMQ path. | User-defined |
The Extensions section in the HostServerLogging.config file contains details around the various logging extensions available for the Logging Framework.
The Extensions section in the HostServerLogging.config file looks as follows:
<Extensions>
    <Extension Name="ConsoleExtension"
                 type="SourceCode.Logging.Extension.ConsoleExtension">
          <Property Name="Shorthand"
                   value="true"/>
    </Extension>
    <Extension Name="EventLogExtension"
                 type="SourceCode.Logging.Extension.EventLogExtension" />
    <Extension Name="FileExtension"
                 type="SourceCode.Logging.Extension.FileExtension" />
          <Property Name="LogFileName"
                   value="HostServer.log"/>
          <Property Name="LogFilePath"
                   value="" />
          <Property Name="HashAlgorithm"
                   value="CRC32" />
    </Extension>
    <Extension Name="MSMQExtension"
               type="SourceCode.Logging.Extension.MSMQExtension">
          <Property Name="QueuePath"
                   value=".private$SCQueue"/>
    </Extension>
    <Extension Name="ArchiveExtension"
               type="SourceCode.Logging.Extension.ArchiveExtension">
          <Property Name="HostServerConfigFileName"
                   value="K2HostServer.config"/>
          <Property Name="ConfigDBConnectionName"
                   value="HostserverDB"/>
    </Extension>
  </Extensions>
The Extensions section contains the following extensions and properties; the following table also includes a description and the possible values:
Extension | Property | Description | HashAlgorithm values: |
|---|---|---|---|
|
| With the All the relevant information is still being logged, but it is not being displayed. Note: By default timestamps are added for better debugging purposes. To see the timestamps in the console output, modify the Shorthand value to read False. | True, False |
|
| Allows you to define the file name of the log file created. Define the file name by changing the value to the required file name. | User-defined |
|
| Allows you to specify the directory where the log file should be saved. If this value is left blank, the current execution path for the assembly will be used. | User-defined |
|
| Allows you to specify the Hashing Algorithm. | CRC32, MD5, SHA1[a] |
|
| Allows you to set the path to the MSMQ. | User-defined |
|
| Allows you to set the name of the configuration file for the Host Server. | User-defined |
|
| Allows you to set the database connection name for the specific archive. | User-defined |
[a] HashAlgorithm values: CRC32: Cyclic Redundancy Code (CRC) is a type of hash function used to produce a checksum that detects errors after transmission or storage. A CRC is computed and appended before transmission or storage and verified afterwards to confirm that no changes occurred. The most commonly used CRC algorithm is CRC-3 used by applications such as Ethernet, PNG, ZIP, and other archive formats. CRC32 produces a checksum with a length of 32 bits. MD5: MD5 is a widely used cryptographic hash function with a 128-bit hash value and is commonly used to validate the integrity of files. SHA-1: The Secure Hash Algorithm (SHA) was developed by the National Institute of Standards and Technology (NIST) with the help of the National Security Agency (NSA). SHA-1 is a cryptographic message digest algorithm similar to MD5. It differs in that it adds an additional expansion operation. The SHA-1 takes a message of less than 264 bits in length and produces a 160-bit message. SHA-1 is used by popular security applications and protocols such as TSL, SSL, PGP, SH, S/MIME, IPSec. | |||
The ApplicationLevelLogSettings section in the HostServerLogging.config file allows you the flexibility to select which loggers are active and the severity levels of each logger. The Logging Framework gives you the flexibility to turn on or off any standard loggers or custom loggers and set different severity levels to suit the dynamic needs of any business.
The ApplicationLevelLogSettings section in the HostServerLogging.config file looks as follows:
<ApplicationLevelLogSettings>
    <ApplicationLevelLogSetting Scope="Default">
      <LogLocationSettings>
        <LogLocation Name="ConsoleExtension" Active="True" LogLevel="Info" />
        <LogLocation Name="FileExtension" Active="False" LogLevel="All" />
        <LogLocation Name="EventLogExtension" Active="False" LogLevel="Debug" />
        <LogLocation Name="ArchiveExtension" Active="False" LogLevel="Debug" />
        <LogLocation Name="MSMQExtension" Active="False" LogLevel="Debug" />
      </LogLocationSettings>
    </ApplicationLevelLogSetting>
  </ApplicationLevelLogSettings>
The ApplicationLevelLogSettings section contains the log locations, states, and log level details listed in the following table:
Log Location | Description | Possible Values |
|---|---|---|
| By setting the | All, Debug, Info, Warning, Error |
| By setting the | All, Debug, Info, Warning, Error |
| By setting the | All, Debug, Info, Warning, Error |
| By setting the | All, Debug, Info, Warning, Error |
| By setting the | All, Debug, Info, Warning, Error |
The Category section in the HostServerLogging.config file allows you to define specific categories of the Logging Framework and allows you to create different categories for different services and events inside K2 blackpearl. This allows you to easily create a relationship between different message entities and categorize them.
The Category section in the HostServerLogging.config file looks as follows:
<CategoryList>
  <Category CatID="0" Name="General">
      General Events
  </Category>
  <Category CatID="1" Name="System">
      System Events
  </Category>
  <Category CatID="2" Name="Client">
      Client Events
  </Category>
  <Category CatID="3" Name="Security">
      Security Events
  </Category>
  <Category CatID="3" Name="Communication">
      Communication Events
  </Category>
  <Category CatID="6" Name="SmartFunctions">
      SmartFunctions
  </Category>
  <Category CatID="7" Name="Authorization Provider">
      Authorization Provider
  </Category>
  <Category CatID="8" Name="SmartObjects">
      SmartObjects
  </Category>
  <Category CatID="9" Name="DependencyService">
      Dependency Service
  </Category>
  <Category CatID="10" Name="UserRoleManager">
      UserRoleManager Server
  </Category>
  <Category CatID="11" Name="CategoryServer">
      Category Server
  </Category>
  <Category CatID="12" Name="WorkflowServer">
      Workflow Server
  </Category>
  <Category CatID="13" Name="LiveCommServer">
      Live Communication Server
  </Category>
  <Category CatID="14" Name="EventBus">
      Event Bus
  </Category>
  <Category CatID="15" Name="EnvironmentServer">
Environment Server
</Category>
<Category CatID="16" Name="SystemAudit">
System Audit
</Category>
<Category CatID="17" Name="WorkActivity">
Work Activity
</Category>
</CategoryList>The HostServerLogging.config file contains a list of possible message categories that can be used when logging messages. These categories are specifically applicable to the K2 blackpearl server and are fully customizable. These categories are especially helpful when saving the log file as a .csv file and viewing the logged information in Microsoft Excel.
The individual category entry in this categories' list contains the information in the following table:
Category ID | Category Name | Category Description |
|---|---|---|
0 |
| General Events |
1 |
| System Events |
2 |
| Client Events |
3 |
| Security Events |
3 |
| Communication Events |
6 |
| SmartFunctions |
7 |
| Authorization Provider |
8 |
| SmartObjects |
9 |
| Dependency Service |
10 |
| User Role Manager Server |
11 |
| Category Server |
12 |
| Workflow Server |
13 |
| Live Communication Server |
14 |
| Event Bus |
15 |
| Environment Server |
16 |
| System Audit |
17 |
| Work Activity |
The HostServerLogging.config file contains a list of predefined and parameterized messages. This includes known Debug, Informational, Warning, or Error messages that can be opened so that they can be used in the planning of firing events or other actions based on known expected messages.
These known messages can be individually configured for severity, category, and forced logging methods. For example a specific known error message can be categorized as "info" and forced to always log to the console and custom logger, regardless of the overall logging level.
A standard message looks as follows:
<Message Msg Severity="Debug" Category="16" Name="SQLInitSucceed" >
      Sql initialized (Svr:{0}, DB:{1})
</Message>
An individual message entry in this predefined and parameterized message list contains the elements in the following table:
Attribute | Message Sample | Description |
|---|---|---|
Unique Message ID |
| Used to specify a specific number for the message. |
Message Severity |
| Used to specify what the specific severity of the message is. |
Category ID |
| Used to specify what category to assign the message to. |
Message Name |
| Used to specify a specific name for the message. |
Message Text |
| Used to specify the message text, including the optional parameters which are also included and can be customized completely for the local requirements. |
The Logging Framework can be used either during run time or to log a predefined message by providing the message ID. Predefined messages can have parameters that must be resolved by the framework.
Logging custom run-time messages is done by the application hosting the Logging Framework, and this calls a logging method, providing the Severity, Name, Source, Text, and Category of a message. The framework then constructs a message object and writes it to the configured logging target(s).
Logging static predefined messages during run time is done by the application hosting the Logging Framework, which calls a logging method, passing only the source and unique attributes of a message. The Logging Framework then retrieves the predefined message for the XML configuration file, based on the unique message ID. The Logging Framework continues to inspect the Severity, Category, and Force Logging directives presented in the attributes of the message.
If the predefined message contains any optional parameters, the Logging Framework resolves these parameters as necessary before writing the message to the forced or configured logging target(s).
On the K2 blackpearl server, you can enable detailed logging options to help with troubleshooting and debugging. Changing the logging detail level can be useful when you are attempting to debug problems or if you just want to see what is happening on the K2 blackpearl server.
There are four distinct types of messages that can be surfaced through the Logging Framework. The severity levels of these messages are described in the following table:
Message Type | Description |
|---|---|
Debug | General debugging information. Useful when trying to trace what is happening on the K2 Host Server. |
Info | General data about K2 Host Server activity such as sessions starting and users authenticating themselves. |
Warning | Display warnings from the server. |
Error | Display data about errors that occur within the server or in components that the server is using. |
To turn on the detailed logging, follow these steps:
Open
%PROGRAMFILES%k2 blackpearlHost ServerBinHostServerLogging.configwith a text editor.In the
appSettingssection, change the values in the following table:Default Value
Configured Value
<add key=:"IncludeStackTrace"
value="False" />
<add key="IncludeStackTrace"
value="True" />
In the
ApplicationLevelLogSettingssection, change the values in the following table:Default Value
Configured Value
<LogLocation
Name="ConsoleExtension"
Active="True" LogLevel="Info" />
<LogLocation
Name="ConsoleExtension"
Active="True" LogLevel="All" />
<LogLocation
Name="FileExtension" Active="False"
LogLevel="All" />
<LogLocation
Name="FileExtension" Active="True"
LogLevel="All" />
<LogLocation
Name="EventLogExtension"
Active="False" LogLevel="Debug" />
<LogLocation
Name="EventLogExtension" Active="True"
LogLevel="All" />
<LogLocation
Name="ArchiveExtension"
Active="False" LogLevel="Debug" />
<LogLocation
Name="ArchiveExtension" Active="True"
LogLevel="All" />
<LogLocation
Name="MSMQExtension" Active="False"
LogLevel="Debug" />
<LogLocation
Name="MSMQExtension" Active="True"
LogLevel="All" />
After you have made your changes to HostServerLogging.config, save your changes. The K2 blackpearl Service will need to be restarted in order for this change to take effect and for the K2 blackpearl server to send logging information to the configured locations.
Depending on which logging location you have configured, you can see the detailed logging information by either running the K2 blackpearl server in Console mode, by viewing the K2 blackpearl Server log file, by viewing the Event log, by viewing the Archive, or by viewing the MSMQ.
You can also run the K2 blackpearl server in Console mode by using the K2 blackpearl shortcut (Start
To run the K2 server in Console mode follow these steps:
Open the Services manager (Start

Scroll down to the K2 blackpearl server service, select it, and click the Stop Service button.
Once the service shows as stopped, you can close the Services Manager.
Right-click on the K2 blackpearl server item in the start menu (Start
Enter the K2 Service account's username and password, and click OK.

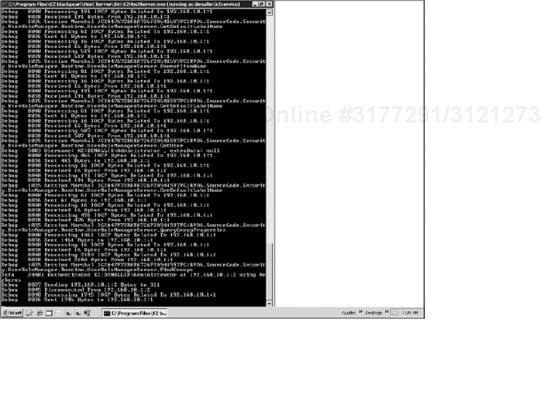
This will open the K2 blackpearl server in console mode (see Figure 19-4). Console mode is a useful troubleshooting tool, as all error and informational messages are sent to the console window, so you can watch what is going on. It is important that you run the service as the Service Account in order to accurately troubleshoot permissions and other errors.
When the File extension is turned on, messages are logged to the K2 blackpearl server log file. This log file is saved to the location specified in the properties of its Logging Framework configuration file.
If no path is specified, the K2 blackpearl server log file can be found in the following location:
%PROGRAMFILES%K2 blackpearlHost ServerBin
The name of the K2 blackpearl server log file is also taken from the Logging Framework configuration file, and if nothing is specified, the default value for the file is:
HostServerYYMMDD_x.logThe K2 blackpearl server log file looks like Figure 19-5.

The .csv (comma-separated value) file format is often used to exchange data between different applications. To view the K2 blackpearl server log file in a more usable format, you can save the log file with a .csv file extension, which when opened displays the file in a more accessible format in Excel.
To view the log file in Excel follow the following steps:
Browse to the log file in the
%PROGRAMFILES%K2 blackpearlHost ServerBindirectory or in the custom-defined directory stipulated in the Logging Framework configuration file.Change the log file's extension from
.logto.csvby renaming the file in Windows Explorer.Double-click the log file to open the file in Excel.
The logged information is now displayed in Excel for easy application and reference.
Filters can also be used to organize the information in various ways and to surface and sort the data that is most relevant to you.
When the Windows Event log extension is activated, the Logging Framework logs messages to the machine's Event log.
You can access the Event log in one of the following ways:
Start
Start
Under the Application node in the Event Viewer, you can sort for all messages of source SourceCode.Logging.Extension.EventLogExtension. See Figure 19-6.

When the Archive extension is activated, the Logging Framework logs messages to SQL Server. This allows queries to be run against logged messages.
By default, messages are logged to the HostServerDB connection. This can be modified to log messages to another location by changing the properties associated with this extension in the Logging Framework configuration file.
When you use the MSMQ extension, the Logging Framework logs messages to Microsoft Message Queuing. A logger can then be set up to monitor the Message Queue for messages and take action when necessary. This is useful when you are running multiple K2 blackpearl servers, in a server farm, for example, and one machine is set up to handle all of the logging.
The K2 blackpearl object model is broken down into a few high-level areas:
Assemblies ending with Client: Are used for working with run-time aspects of K2 entities, such as processes and SmartObjects.
Assemblies ending with Authoring and Design: Are used during design time for creating entities.
Assemblies ending with VisualDesigners: Are used for visually representing entities at design time.
And finally, assemblies ending with Management: Are used for managing servers and services.
Under the Management assemblies that the K2 blackpearl platform provides, there are Supporting and Management assemblies. One of these assemblies is SourceCode.Logging.
SourceCode.Logging provides the classes for extending and logging to the K2 blackpearl Host Server log and delivering the output via different mechanisms, such as e-mail, text file, and the console.
The SourceCode.Logging assembly has the following namespaces:
SourceCode.LoggingSourceCode.Logging.Extension
For more extensive information on
SourceCode.Loggingsee the K2 blackpearl Developer Reference.
If the five out-of-the-box logging extensions that come standard with K2 blackpearl do not meet your business needs, the Logging Framework makes it easy to create a class using the supporting and managing assemblies that plug into the architecture as a custom extension to fit different business needs.
Creating custom loggers is out of the scope of this chapter, but if you would like to find some examples of custom loggers, please refer to K2 blackmarket. K2 blackmarket was created in order to facilitate project and code sharing in the K2 Underground community. Sharing projects and code with other members of the community can greatly enhance the learning experience as well as reduce the learning curve that is inherently part of getting to know new technologies. You can access the K2 blackmarket through the K2 Underground community Web site located at
www.k2underground.com.
When you are installing K2 blackpearl in a completely distributed environment where there are separate servers for the database server, K2 blackpearl server, application server, and SharePoint server, the "double-hop" authentication issue often arises.
The double-hop issue has to do with passing of credentials between, for example, a client, the Web server (first hop), and the database server (second hop) for authentication and access.
Often when you encounter the double-hop issue, you may see one of the following errors on the K2 blackpearl server:
NT AUTHORITYANONYMOUS LOGON
The request failed with HTTP status 401: Unauthorized.
When you encounter the double-hop issue, you need to use Kerberos. In a nutshell, Kerberos is a secure ticket-based protocol for authenticating a request. With delegation you simply allow another server/service to allow a Kerberos ticket to be created for another service on the originating user's behalf. This can be done at the computer level by using full delegation or with constrained delegation. Constrained delegation means that the Kerberos delegation can be executed only against a limited set of services.
For more information about Kerberos, see Chapter 5.
The Service Principal Name (SPN) is a name that uniquely identifies an instance of a service to a client within Active Directory. SPNs cannot be duplicated in a given domain and must be specified for each name/alias that can be used to access the host.
Kerberos logging can be very helpful in diagnosing Kerberos authentication issues. Kerberos logging will display errors and notifications in the System Event log. It is a good idea to clear the Events in the System Event log so that new errors and warnings are easier to see.
To enable Kerberos logging on the Web server, perform these steps:
In these steps, you will edit the Registry settings to enable logging for Kerberos. Modifying the Registry should be done carefully, so please double-check the settings and follow the steps carefully.
Open the Registry Editor (Start
Navigate to the following node: HKEY_LOCAL_MACHINE
Right-click on the Parameters item, and create a new DWORD entry with the following property:
Name: LogLevel
Value: 1
If the LogLevel parameter already exists, change the value to 1.
Close the Registry Editor.
Restart the server.
Another useful Kerberos troubleshooting tip is to output a log file for Kerberos. This can be done by adding the following two entries in the Registry:
In these steps, you will edit the Registry settings to enable an output log file for Kerberos. Modifying the Registry should be done carefully, so please double-check the settings and follow the steps carefully.
Open the Registry Editor (Start
Navigate to the following node: HKEY_LOCAL_MACHINE
Right-click on the Parameters item, and create a new DWORD entry with the following property:
Name: KerbDebugLevel
Value: ff
If the
LogLevelparameter already exists, change the value toff.Right-click on the Parameters item and create a new DWORD entry with the following property:
Name: LogToFile
Value: 1
If the
LogLevelparameter already exists, change the value to1.Close the Registry Editor.
Restart the server.
The Kerberos log file is written to the following location:
%WINDOWS%System32lsass.log
Please be aware that you need to switch off log to file when opening the output file lsass.log because of file locking. You can do this by changing LogToFile from "1" to "0". From the preceding you can see that K2 blackpearl logging allows you to record information about process execution in K2 blackpearl. This information is typically used by workflow developers for debugging purposes, and additionally, depending on the type and detail of information contained in the logging information, by experienced system administrators or technical support personnel to diagnose common problems with K2 blackpearl.
K2 blackpearl makes use of Windows Performance Monitoring for system reporting, specifically using a tool called System Monitor (PerfMon.exe).
PerfMon is a process associated with Windows and is a solution to monitor, manage, and archive thousands of events that are generated by devices across the entire network. This is accomplished by a loadable driver that reprograms devices with performance counters so that user-level code can access these counters, and you can create traces of server activity.
Mastering the System Monitor controls helps you to analyze real-time traces and load and interpret logs. Through System Monitor you can also detect bottlenecks by capturing key performance counters.
The Performance Monitor is an administrative tool used to keep track of a range of processes and provides a real-time graphical display of the results. The Performance Monitor can be used to:
Assist with the planning of upgrades.
Track processes that need to be optimized.
Monitor results from tuning and configuration changes.
Analyze a workload and its effect on the resource usage to help identify bottlenecks.
The K2 blackpearl Logging and Performance Monitoring Framework makes use of the Performance Monitor to display specific counters that are relevant to the K2 blackpearl server activities.
Microsoft provides two interfaces for System Monitor, PerfMon, and a Microsoft Management Console (MMC) version called Performance Logs and Alerts.
Because of the fact that the MMC version does not allow real-time monitoring, you should only use the MMC Performance Logs and Alerts when you need just logs and alerts. PerfMon should be used when your aim is to collect live data. PerfMon does everything that the MMC version does.
Performance Logs and Alerts (see Figure 19-7) can be opened in the following way:
Start
File

PerfMon (see Figure 19-8) can be opened in one of the following ways:
Start Figure 19-8 Administrative Tools
Start

Once you launch PerfMon, you will get a graph with a trace that provides you with a graphical display of all system activities. You can use PerfMon to monitor the utilization of system resources and to collect and view real-time performance data in the form of counters for server resources such as processor and memory use.
PerfMon can be used to assist you with the planning of upgrades, the tracking of processes that need to be optimized, the monitoring results of tuning and configuration scenarios, and the understanding of a workload and its effect on resource usage to identify bottlenecks. Bottlenecks can occur on practically any element of the system and may be caused by a malfunctioning resource, the system not having enough resources, or a program that dominates a particular resource.
K2 blackpearl provides K2 blackpearl-specific counters to PerfMon which allow you to monitor the K2 blackpearl server.
In order to activate the newly added K2 blackpearl monitoring functionalities, right-click anywhere on the graph. Select the Add Counters option (shown in Figure 19-9).
Result: The Add Counters dialog box is displayed.
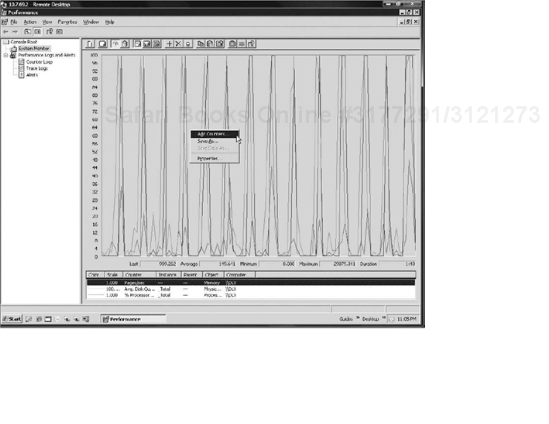
You can now add the counters you want to monitor to the Performance Monitor user interface, and K2 blackpearl adds some specific counters that are useful for quickly getting an overall impression of how healthy your system is and where the problems are, if they exist.
The idea here is to see the counters that will be at low or zero values when the K2 blackpearl system is healthy and at high values when something is overloaded. A "perfectly healthy" system would show all counters flat lined at zero. Perfection is however unattainable, so you'll probably never see all of these counters flat-lined at zero in real life.
K2 blackpearl provides you with a number of K2 blackpearl-specific counters to monitor various aspects of the system.
The K2 blackpearl Logging and Performance Monitoring Framework has added K2 blackpearl–specific counters to the list generally available in the Performance Monitor. So, generally, the Performance Monitor includes the following K2 blackpearl-specific counters:
K2 processes
K2 Worklist items
K2 Worklists
Process memory usage
Process modules loaded
Process thread counts
Transmission Control Protocol (TCP) information
The following table describes the particular K2 blackpearl–specific counters that you have available in the Performance Monitor:
Counter | Description |
|---|---|
K2 Process Total WaitStart | The total number of K2 processes waiting on a Start Rule (From K2 Transaction DB) |
K2 Processes Started | The number of K2 processes started by the K2 server |
K2 Processes Started Per Second | The number of K2 processes started per second by theK2 server |
K2 Processes Total Active | The number of K2 processes that are currently in an active state |
K2 Processes Total Completed | The number of K2 processes that are currently in a completed state |
K2 Processes Total Deleted | The number of K2 processes that are currently in a deleted state |
K2 Processes Total Error | The number of K2 processes that are currently in an error state |
K2 Processes Total Escalated | The number of K2 processes that reached an escalation |
K2 Processes Total Running | The number of K2 processes that are currently in a running state |
K2 Processes Total Stopped | The number of K2 processes that are currently in a stopped state |
K2 Worklist Items Finished | The number of K2 Worklist items that were finished by the K2 server |
K2 Worklist Items Finished Per Second | The number of K2 Worklist items that were finished by the K2 server per second |
K2 Worklists Opens | The number of K2 Worklists that have been opened by the K2 server |
The number of K2 Worklists that have been opened by the K2 server per second | |
Process Memory Usage | The K2 server process memory usage in bytes |
Process Modules Loaded | The number of modules loaded by the K2 server |
Process Thread Count | The number of threads running in the K2 server process |
TCP Bytes Received Per Second | The number of TCP bytes received by the K2 server per second |
TCP Bytes Received Total | The number of TCP bytes received for the duration of the K2 server running instance |
TCP Bytes Sent Per Second | The number of TCP bytes sent by the K2 server per second |
TCP Bytes Sent Total | The number of TCP bytes sent for the duration of the K2 server running instance |
TCP Concurrent Connections | The number of concurrent client connections for the duration of the K2 server running instance |
TCP Connections Opened | The number of TCP connections opened for the duration of the K2 server running instance |
TCP Connections Opened Per Second | The number of TCP connections opened for the duration of the K2 server running instance per second |
So, as you can see, these K2 blackpearl counters give you a great deal of flexibility when it comes to system reporting. You merely need to choose the ones most applicable to your system and add them to the Performance Monitor user interface.
Once you've chosen the counters you want, you can add them to the Performance Monitor user interface as follows:
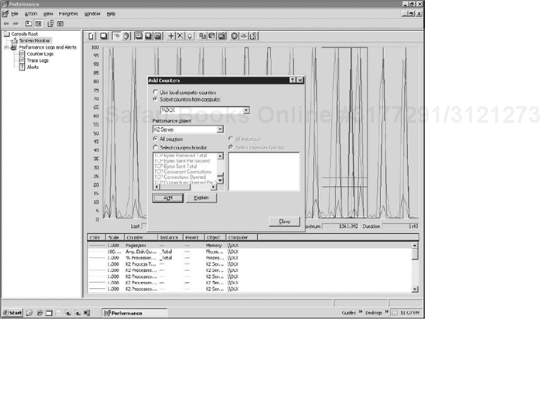
In the Add Counters dialog box, select K2 server from the Performance object drop-down list.
Select the relevant counters from the list (see Figure 19-10).
Click Add.
Click Close.
The performance of the selected counters will now be displayed in the main user interface.
PerfMon lets you create charts, alerts, logs, and reports to monitor an instance of K2 blackpearl.
Charts can monitor the current performance of selected objects and counters, for example, the number of K2 Worklists that have been opened by the K2 server per second.
Using a chart can be helpful for the following tasks:
Investigating why K2 blackpearl is slow or inefficient
Continually monitoring K2 blackpearl to find intermittent performance problems
Discovering why you need to increase capacity
Displaying a trend as a line chart
Displaying a comparison as a histogram chart
Charts are also useful for short-term, real-time monitoring of a local or remote K2 blackpearl server and can be used when you want to monitor an event as it occurs.
You can use PerfMon alerts to monitor the current performance of selected counters. When a counter exceeds a given value, the log records the date and time of the event. An event can also generate a network alert. You can have a specified program run the first time or every time an event occurs. For example, an alert can send a network message to all system administrators that the Process Memory Usage is exceeding the expected limits.
Logs allow you to record information on the current activity of selected objects, which allows you to analyze this at a later stage.
Log files provide a wealth of information for troubleshooting or planning. Whereas charts, alerts, and reports on current activity provide instant feedback, log files enable you to track counters over a long period of time. Thus, you can examine information more thoroughly and document K2 blackpearl system performance.
Reports allow you to display constantly changing counter and instance values for selected objects. Values appear in columns for each instance. You can adjust report intervals, print snapshots, and export data. Use reports when you need to display the raw numbers.
So, by making use of Windows Performance Monitor and by providing new specific counters, K2 blackpearl allows you to use system monitoring to help you identify where your system problem is coming from. If this tool is used with correct configuration and planning to suit your K2 blackpearl environment, then the system administrator can benefit from being able to tackle problems in less time, thus, making your K2 blackpearl server more efficient.
In this chapter we have discussed two key aspects behind the scenes of K2 blackpearl: logging and system reporting.
Logging is the process of storing information about events that occurred on the K2 blackpearl server. It allows you to record information about process execution in K2 blackpearl. This information is typically used by workflow developers for debugging purposes, and additionally, depending on the type and detail of information contained in the logging information, by experienced system administrators or technical support personnel to diagnose common problems with K2 blackpearl.
System reporting is the process of collecting and analyzing data to measure the performance of the product, process, or activity against expected results. Using system reporting you can collect performance data automatically from your K2 blackpearl server. You can view logged counter data or export the data to spreadsheet programs or databases for analysis and report generation, which allows you to query the data and analyze the data as needed for overall performance assessment, trend analysis, and capacity planning.
In the next chapter we look at using the K2 Workspace and the robust reporting capabilities it provides.