Configuring Instrumentation
Although any enterprise application needs instrumentation to satisfy operators, it is always useful if the platform also has instrumentation built in so you as an application developer don't have to be concerned about all the details of supporting instrumentation. Just like logging and tracing, you can enable performance counters and WMI from within the application configuration or the configuration tool for both the client side and the service side. You can also set the performanceCountersEnabled property to ServiceOnly. Listing 3-21 shows how you do this in an application configuration file.
Example. Application Configuration with Instrumentation Enabled
<?xml version="1.0" encoding="utf-8"?>
<configuration>
   <system.serviceModel>
      <diagnostics wmiProviderEnabled="true" performanceCounters="All" />
      <client>
         <endpoint address="http://localhost:8080/QuickReturns/Exchange"
            binding="basicHttpBinding" bindingConfiguration=""
            contract="ITradeService" name="basicHttpBinding" />
      </client>
   </system.serviceModel>
</configuration> |
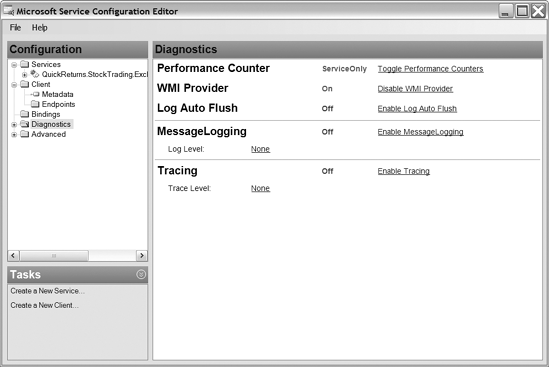
In Figure 3-14, you see the Diagnostics window in the Microsoft Service Configuration Editor that you can use to enable performance counters and WMI events. This results in the marked changes in the configuration shown in Listing 3-21.
Microsoft Service Configuration Editor with instrumentation enabled