
Chapter 11: Publishing Model Content
Once you've captured information in your Sparx repository, you will inevitably want to make that information available to your stakeholders. Expecting your stakeholders to have the ability or desire to navigate your repository using Sparx is not practical. They need information in a form with which they are comfortable. Fortunately, this is an area where Sparx, once again, shines, which brings us to the subject of this chapter – publishing model content.
In this chapter, we will learn different approaches to publishing model content for consumption by others in your enterprise. Unlike previous chapters, where we explored the use of the ArchiMate® language and the best ways to use it, this chapter is all about the publishing features of Sparx.
This chapter includes the following sections:
- Generating document reports
- Introducing report templates
- Generating HTML content
- Using charts
- Creating custom SQL queries
- The copy-and-paste approach
As usual, we will first look at what you will need to complete this chapter.
Technical requirements
Of course, you will need Sparx Systems' Enterprise Architect installed on your computer. We have included the report templates used in this chapter in the repository for this chapter. You can access the repository at the following GitHub address: https://github.com/PacktPublishing/Practical-Model-Driven-Enterprise-Architecture/blob/main/Chapter11/EA%20Repository.eapx.
You will need Microsoft Word, or a similar word processor, installed on your system to view and edit the documents generated by Sparx. Familiarity with Word is helpful but not altogether necessary. Sparx can generate documents in Microsoft Word format or Rich Text Format (RTF) for editing in other tools.
You will also need a web browser installed on your system to view and navigate the HTML pages generated by Sparx. Familiarity with HTML is helpful but not absolutely necessary.
Familiarity with Structured Query Language (SQL) is a plus for one section of this chapter. If you're not familiar with SQL, simply skip the section titled Creating custom SQL queries.
If you've never worked with report generators in the past, the concept of building templates may be new to you. We will cover templates in detail in this chapter, as it is key to understanding the publishing function. As with other report generators, understanding the underlying data structure is beneficial. Detailed coverage of the Sparx repository data structure is beyond the scope of this book; however, we will point you to resources that can be of great help in this regard.
Let's get started.
Generating document reports
The process for generating reports in Sparx is fairly straightforward:
- You can simply identify the scope of the model elements to be included by selecting a package from the project browser, and then navigate to Publish > Model Reports > Report Builder and select Generate Documentation.
The following screenshot illustrates this navigation:

Figure 11.1 – Generating a report
When this action is taken, the following dialog appears:
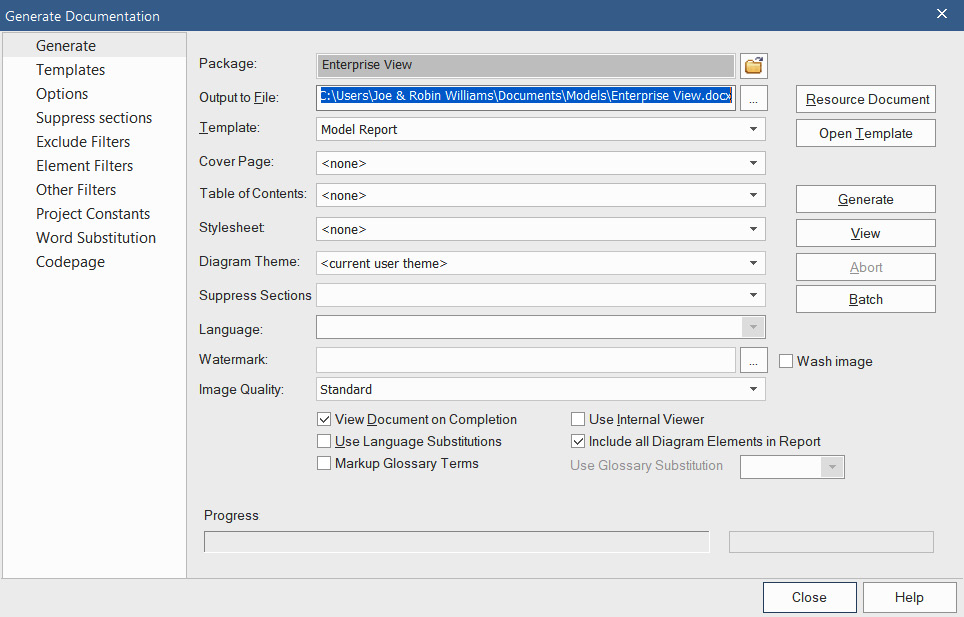
Figure 11.2 – Generating the documentation dialog
As you can see, there are a lot of options in this dialog. For now, we will focus on the two that are required, the name and location of the output file and the report template to use:
- Output to File: This field lets you select a suitable location for the output file. The output file type indicates the type of file to be generated. In our example, the filename takes on the folder name from the project browser, and the .docx file type indicates that a Microsoft Word document will be created.
- Template: This field lets you select a report template. For our purposes, select the system-supplied template called Model Report.
RTF Files
Sparx supports the generation of .rtf files. RTF stands for Rich Text Format and is an early standard for sharing files across platforms. While Microsoft Word can edit both .rtf and .docx files, .rtf files tend to be much larger than their native Microsoft Word counterparts. You may also run into formatting options that Microsoft Word does not directly support. Still, .rtf files may be a good option when using tools other than Microsoft Word.
- Next, check the box for View Document on Completion.
- Now, press the Generate button.
As the report is created, the progress bar is updated. When it's complete, the document will be opened in Microsoft Word.
The following figure is an excerpt of the generated report:
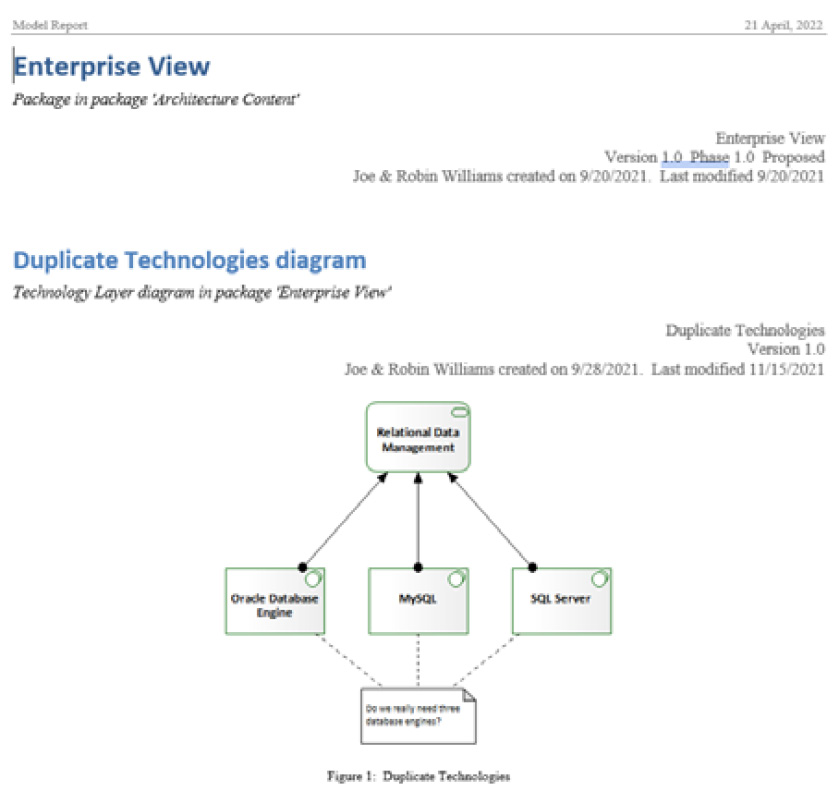
Figure 11.3 – A partial report output
If you were following along using the provided repository for this chapter, you may have noticed that it took a long time to generate this report. You also may have noticed that the report is almost 200 pages long. That's because we selected a high-level package with a substantial amount of content. This is an important observation for organizing and maintaining your repository going forward. You should always consider how you will use your information.
We will review these and other approaches for organizing your repository in the next chapter. Another reason this report is so large is because of the large amount of information to be included for each model element in the report, as specified by the template.
Now that we have an idea of how to generate a report, let's turn our attention to report templates.
Introducing report templates
To better understand report templates, it's best to have a conceptual understanding of the Sparx repository structure. A Sparx repository is a collection of model elements. We place these elements within packages and represent them in one or more diagrams.
Elements, packages, and diagrams have various attributes. Attributes include things such as requirements, files, issues, constraints, or rules. Elements often have relationships or connectors to other elements. There are relationships that you create in a diagram by dragging a connector from one source element to another target element.
There are also parent-child relationships. For example, a package may contain or be a parent to many elements, diagrams, and other packages. An element may be nested within another parent element. Elements, attributes, connectors, diagrams, and packages all contain fields such as names, notes, and dates.
Report templates provide the specification of precisely what type of information to place on the report, where to place it, and how to format it. The information in a template includes elements, attributes, connectors, and diagrams, along with fixed text and formatting information.
We include this information in the template by selecting specific report sections and then specific fields for each section. Report sections are sets of opening and closing tags, much like what you see in an HTML document. These report sections have a hierarchy based on their relationships with each other. This all should become clearer as we view the template builder within Sparx. Let's go through the process of creating a simple report template from scratch:
- Open the model repository for this chapter and navigate to Publish > Model > Reports > Templates options.
A new blank template opens, as shown in the following figure:
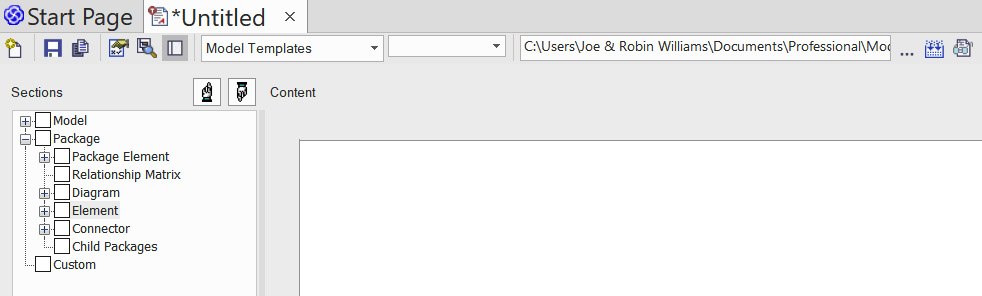
Figure 11.4 – A new report template
The panel on the left is where we specify the report sections to include in the template.
- Expand the tree section labeled Package and check the box next to the Element section.
When you do this, Sparx places the appropriate opening and closing tags on the template panel to the right, as illustrated in the following figure:
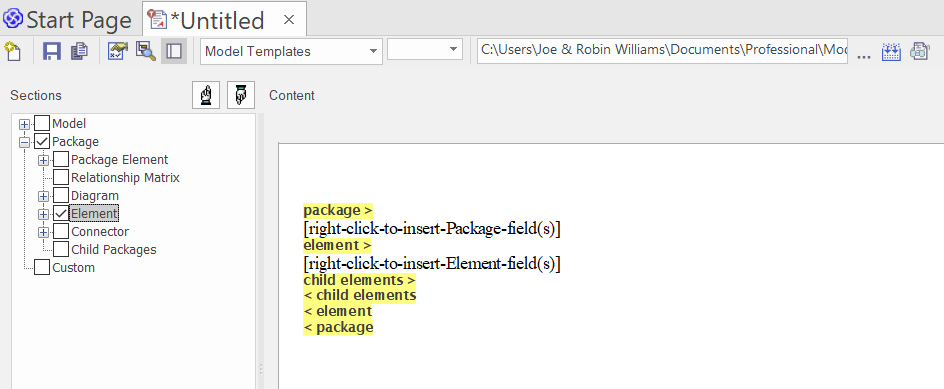
Figure 11.5 – The section tags on the template
As you can see, the highest-level tag is the package> tag. Nested within the package tag is the element> tag. Nested within the element tag is the child elements> tag. At the bottom of the template are the complementing closing tags for each of the opening tags in reverse order, <child elements, <element, and <package.
Note that the Package section was checked and its tags included in the template for us when we checked the Element section. Elements must be nested within a package. The child elements section is also checked by default. If you expand the Element section in the Sections panel, you will see a large list of report sections that represent the attributes of an element.
Once we specify the report sections, we need to identify the fields to include for each section. Sparx has provided a hint on how to do this by including fixed text within the Package and Element sections.
- Where it says [right-click-to-insert-Package-field(s)], remove this text and replace it with This package is named ''. Note the single quotation marks at the end of the previous sentence.
- Place your cursor in between the single quotation marks and right-click. Sparx will present you with a context menu to select the fields available in the package report section.
- From the context menu, select the Name field.
- Select the entire line and set the format to Arial, 18, and underlined.
- Repeat these steps for the Element section. Indent and set it to Arial and 14. Your template should look something like the following:

Figure 11.6 – My First Template
Save the new template and name it My First Template.
- In the project browser, navigate to Enterprise View and select Equipment.
- Press the F8 key to load the Generate Documentation dialog.
- Select My First Template as the template name. It should be located under the Custom Templates section.
- Press the Generate key. The report is created in the specified output area.
If you had the View Documentation on Completion checkbox checked, Microsoft Word should open the output report, which should look something like the following:
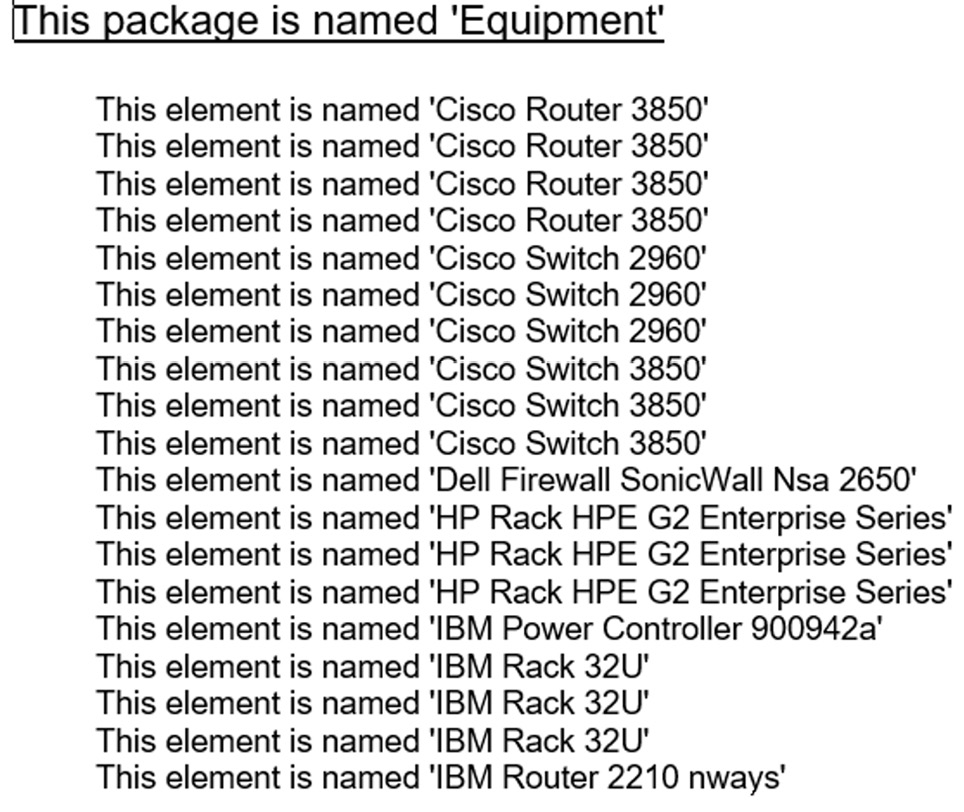
Figure 11.7 – The My First Template results
In another example, we will show you how to copy an existing template. For this example, we will use the DuplicateTechnologies template created in Chapter 7, Enterprise-Level Technology Architecture Models. We will save the template to a new template group for easier reference. The steps are as follows:
- From the Template Editor tab, press the New template button (
 ), and the following dialog opens:
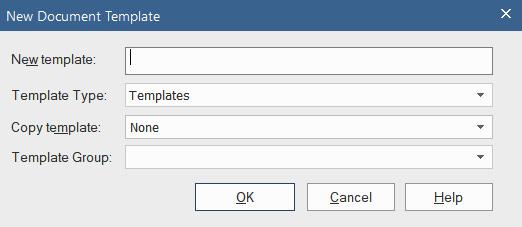
Figure 11.8 – The New Document Template dialog
- Name the new template My Second Template.
- In the Copy template field, select DuplicateTechnologies from the drop-down list.
- In the Template Group field, enter Practical Model Driven Enterprise Architecture.
- Press OK, and the new template opens in the Template Editor tab.

Figure 11.9 – My Second Template
Logically, this template behaves as depicted in the following pseudo-code:
For each package> selected
print the package name {Pkg.Name}.
Print a fixed text table header
For each element> in package>
print the {Element.Name} in table column 1
For each connector> attached to element>
look up the source> element>
Print the source> element> {Element.Name} in table column 2
Hopefully, this gives you a basic idea of how report templates work. Don't be misled by these simplistic examples, however. We have seen absolutely beautiful reports generated by Sparx. Unfortunately, a more detailed review of complex reporting templates is beyond the scope of this book. To refine your knowledge of report publishing, we suggest the following:
- Play with this new template by adding your own report sections and fields. Explore the available fields within each report section. This is also an excellent way to discover Sparx features that you may not have been aware of. Specifically, try including the report sections for child elements and child packages. Regenerate the report to see how the report content changes.
- There may be cases where the elements you wish to report on are not located within a single package. They may be scattered across multiple packages in the repository. In such cases, you can allow a model diagram to control the elements included in a report by including the Element subsection, nested within the Diagram section of the template.
- Explore the system templates provided by Sparx. You can open them in Template Editor. You won't be able to modify them, but you can copy them into new templates and modify the copy.
- Explore the Sparx help system, specifically the section titled Model Publishing. It's an excellent resource: https://sparxsystems.com/enterprise_architect_user_guide/15.2/model_publishing/documentingprojects.html.
Future-proofing your templates
As your repository grows, so will your collection of custom report templates. It's not unusual for a collection of templates to become unwieldy over time, making it difficult to find the specific template you need. To combat this effect, we recommend the following:
- Pay attention to the template names. Use descriptive names that include how a given template differs from others.
- When creating a new template, assign it to a specific template group. This will allow you to organize your templates and help narrow your search when the time comes to use the template. You can browse template groups from the Resources browser:

Figure 11.10 – Template groups in the Resources browser
We will explore template fragments in the next section.
Template fragments
Commonly formatted sections of a template can be defined in a template fragment, which, in turn, may be included in multiple report templates. In Chapter 7, Enterprise-Level Technology Architecture Models, we used the DuplicateTechnologies template to identify potential duplicate technologies by listing technology services and all of the technologies assigned to each service.
However, as we can see from Figure 11.9, the only aspect of this template that is specific to technology services or technologies is the fixed text table header. Indeed, we can use this template to report on elements in any package and the elements connected to those elements. The only thing we need to change is the table header row. Everything between the element> tags can go into a template fragment. The Sparx Enterprise Architect User Guide provides some guidance on the use of fragments: https://sparxsystems.com/enterprise_architect_user_guide/15.2/model_publishing/rtf_template_fragments.html.
In the repository for this chapter, we've included another template called My Third Template, which includes a template fragment called My First Fragment. It produces the same results as My Second Template.
Now, let's look at other features of the report template.
Including diagrams in your report
Including diagrams in your report is straightforward. You need to decide whether you want to include diagrams at the package level or diagrams nested within an element. The Diagrams Demo template in this chapter's repository shows how to include a diagram image at the package level. The diagram is centered on the page and includes a figure number and diagram name:

Figure 11.11 – The Diagram Demo template
Now, let's look at the various means of getting just the content you're looking for in a document.
Document options
There are two ways to specify options for a document – through the Generate Documentation dialog or the Document Options dialog. The main difference between these dialogs is that the options selected from the Generate Documentation dialog are transitory.
They are, in effect, only for the current report generation. The options specified in the Document Options dialog are saved with the template and are applied each time the template is invoked. You can access the Generate Documentation dialog anytime by pressing the F8 key or by navigating to Publish > Model Reports > Report Builder > Generate Documentation.
You can access the Document Options dialog by pressing the document options button from the ribbon on the Template Editor tab, as indicated in the following screenshot:
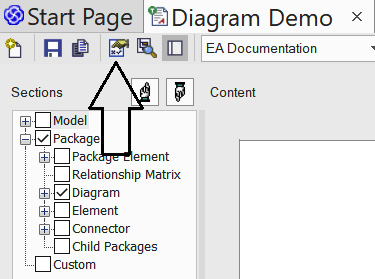
Figure 11.12 – The document options button
The effects of the specific options are self-explanatory, so we won't go over them all. Three types of filters are available:
- Exclude Filters allows us to exclude selected connector and diagram types, or exclude the details for the selected attributes in templates that would otherwise include those details.
- Element Filters allows us to specify the criteria for the elements we want to include in the document.
- Other Filters allows us to specify only the attributes to include in the document.
The element filters and other filters both include two checkboxes, one to add the filter to the document, and another called Required to indicate that the attribute in question must be present for the object to be included in the report.
There are a few menu options available in the Generate Document dialog that are not in the Document Options dialog:
- Suppress Sections allows us to select entire sections to be left out of the generated document.
- Project Constants allows us to define custom fields with fixed values to include in report templates. This can be used for anything from copyright notices to client names.
- Word Substitutions lets us define substitutes for certain words or phrases in a document. This may be useful for organizations that employ specific taxonomies in their model.
Excluding packages and diagrams from a document
You may find it necessary to exclude certain packages or diagrams from a report. This can be done as follows:
- Packages can be excluded by selecting a package and navigating to Design > Model > Manage > Report Options.
- Diagrams can also be excluded. From a diagram's Properties dialog, select Diagram and check the box labeled Exclude Image from Documentation.
Creating more complex documents
The Sparx document generation capabilities don't end with what we've covered so far, but comprehensive coverage of all of the capabilities and possibilities would require a book of its own. One capability that's worth mentioning, however, is what Sparx refers to as virtual documents.
Using this capability allows us to define complex documents containing sections from multiple areas of the repository independent of the repository structure and each using different templates. Standard fixed-text sections can be combined and mixed with variable sections. The virtual document can contain a cover page and a table of content, and use a standard style sheet. More information on virtual documents can be found in the Sparx user guide at the following address: https://sparxsystems.com/enterprise_architect_user_guide/15.2/model_publishing/virtualdocuments.html.
Hopefully, we've provided you with the fundamentals of document report generation. One effect that you may notice is that as your repository grows, so does the number of report templates and the size of their output. This is not a bad thing, as pulling information from your repository is its primary benefit. One disadvantage of document reports, however, is that as they are regenerated, they are replaced in their entirety, and they require a sequential access method. Now, we will turn our attention to a form of publishing that addresses this and other issues – web publishing.
Generating HTML content
The content of your repository can be made available for web access in one of three ways:
- WebEA
- Prolaborate
- Generating static web pages in HTML
WebEA is a feature of the Sparx Systems Pro Cloud Server. The Pro Cloud Server and Prolaborate are products provided by Sparx Systems that require separate licenses. While those products have great features, they are beyond the scope of this book. We will focus here on the static HTML pages that you can generate right from the product you have installed on your system.
By static, we mean that the information in HTML form is a copy of what is in your repository. When you change the repository, you must regenerate the HTML pages. Like the document report generator, you can select subsets of your repository to make them available via HTML. Unlike the document report generator, that subset will be fully navigable. The web pages generated contain a mixture of HTML, JavaScript, CSS, images, and similar constructs. All page references are relative, and all the necessary files are generated to allow you to simply drop the entire package structure into your web server's content area without modification. The only thing you may wish to change is the logo image that's displayed at the top of the page.
During the process of viewing and testing the generated web content, you will likely want to display the pages from your local system. Web browsers often don't like to access local files, so you may have to do some configuration in your web browser. We like using Chrome to test our page, but to do that, we must start Chrome from the command line with the following command-line option:
chrome.exe --allow-file-access-from-files
To configure your browser to view local files, see the section named Browser Behavior on the following Sparx user guide web page: https://sparxsystems.com/enterprise_architect_user_guide/15.2/model_publishing/htmlreport.html.
Once again, we will use this chapter's repository to demonstrate the generation of HTML:
- Open the repository for this chapter.
- In the project browser window, select and expand the view called Enterprise View.
- Open the Publish as HTML dialog by navigating to Publish > Model Reports > HTML > Standard HTML Report. The following screenshot shows the dialog:
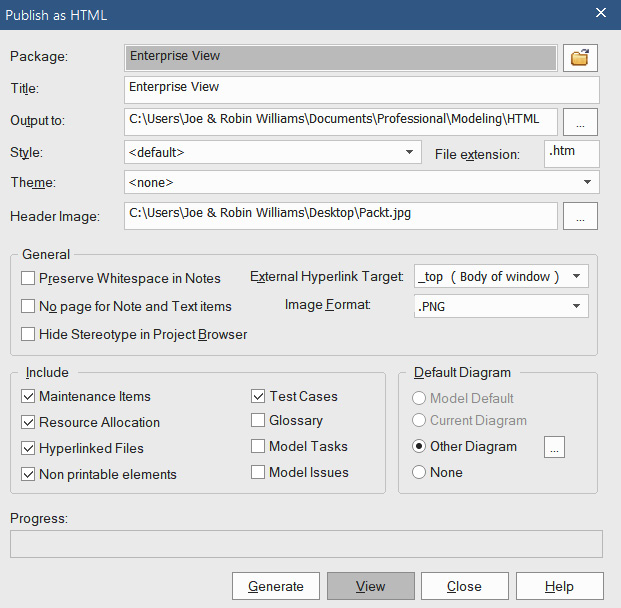
Figure 11.13 – The Publish as HTML dialog
- Select an appropriate output path.
- Optionally, select an image to be displayed on the header. We've selected the Packt Publishing logo.
- In the Default Diagram section, select Other Diagram and navigate to a diagram to be displayed on entry to the website.
- Press the Generate button. Sparx updates the progress bar and notifies us when complete.
- Press the View button to view the output in your default browser.

Figure 11.14 – The HTML report view
You can navigate through the web report by selecting a diagram or element from the navigation panel on the left, or by clicking on an element in the displayed diagram.
The contents of the output folder should look like the following:
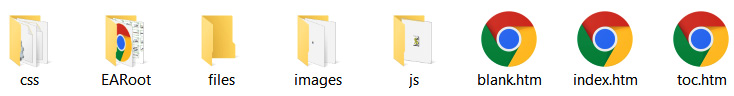
Figure 11.15 – The content of the HTML report output folder
Point your favorite web server to this folder or place the folder in the server's context area, and you've got yourself a published model. That's all there is to it. Of course, you should probably notify your stakeholders when this occurs so that they know to access it. It's not uncommon to publish such content at regular intervals so that stakeholders can see the progress you've made in the model.
Another way to show progress is by displaying status, trends, and statistics through the use of graphs and charts. That is the subject of our next section.
Using charts
Charts and graphs are an excellent way of presenting another view of your enterprise. They can be used to report on the progress of a particular project or to illustrate the state of a particular aspect of the enterprise. Whatever your need, chances are that Sparx has the charting ability to satisfy it. Reviewing all of the charting capabilities of Sparx is beyond the scope of this book; however, we would like to show you some basics and how to get started with charting. We will do this by creating a simple dashboard in the Sparx repository. Let's get started:
- If it's not already open, open the repository for this chapter. Select Enterprise View from the project browser and create a new folder called Dashboard.
- With the new Dashboard folder selected, press the New Diagram button from the browser panel's ribbon.
- From the New Diagram dialog, select the Extended perspective and select the Dashboard diagram type, as shown here:
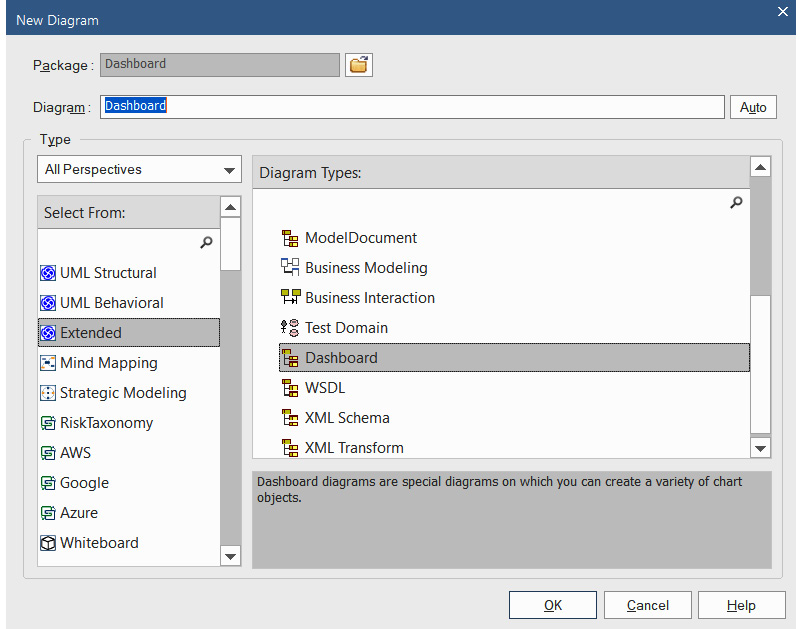
Figure 11.16 – The New Diagram dialog
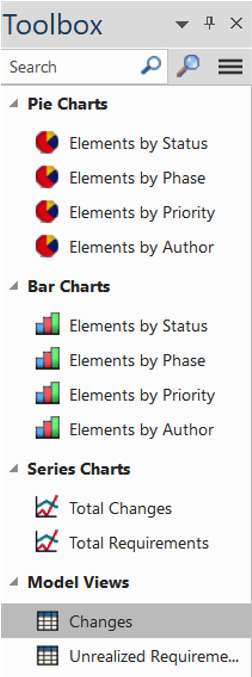
Figure 11.17 – The Dashboard toolbox
- Under Pie Charts, drag the Elements by Status object onto the diagram. Sparx opens the Find Package dialog, allowing us to select the package on which to report:
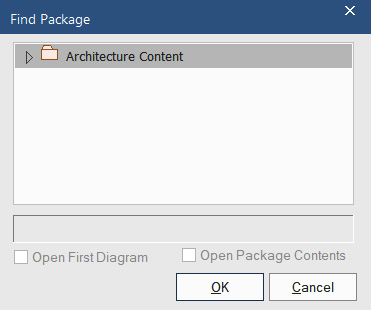
Figure 11.18 – The Find Package dialog
- Expand the package to reveal the sub-packages and select the ABC Trading Service package nested within the Enterprise View > Technology Services package hierarchy.
- Press OK.
Sparx places a pie chart on the diagram and immediately opens the following diagram:
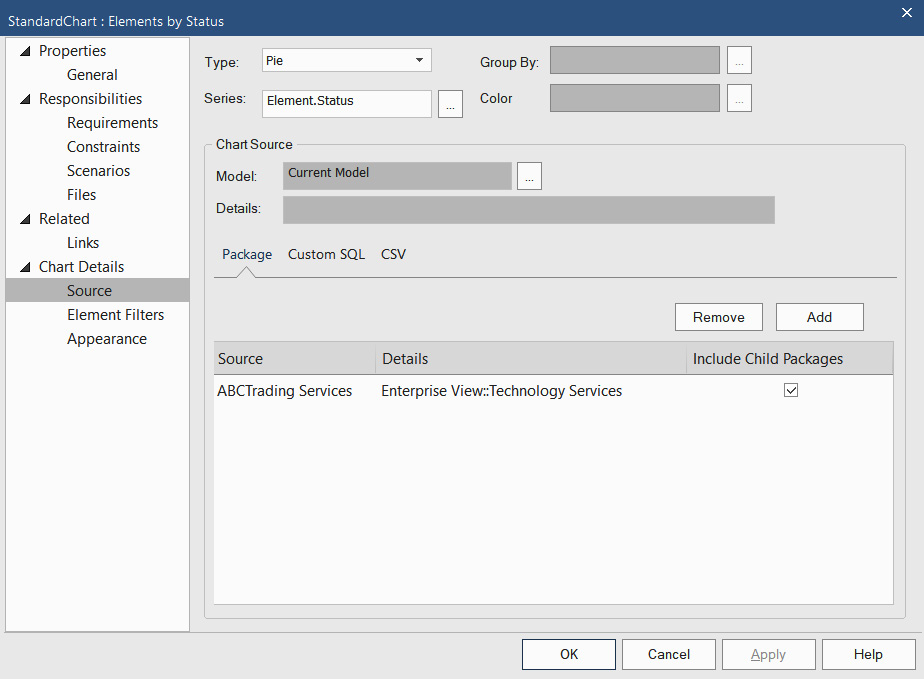
Figure 11.19 – The StandardChart : Elements by Status dialog
- Take some time to explore this dialog:
- Note that additional sources can be added to the chart.
- Sources can be from package selections, custom SQL queries, or .csv files. This means that you can pull in information from external sources.
- Click the button next to the Model field to see the other types of sources that this chart might accept.
- Data for this chart can come from sources external to Sparx.
- In the dialog panel on the left, under Chart Details, select Appearance. Note the various options for displaying labels in this chart.
- Select the General properties and change the name of the chart to Technology Services by Status.
- Press OK.
The diagram should look like the following figure:

Figure 11.20 – Technology Services by Status
- Move this chart to one side of the diagram. Using the same steps as previously described, drag the Elements by Phase bar chart from the diagram toolbox onto the diagram. Use the same package as the source. Name the chart Technology Services by Phase. The diagram should now look something like the following figure:
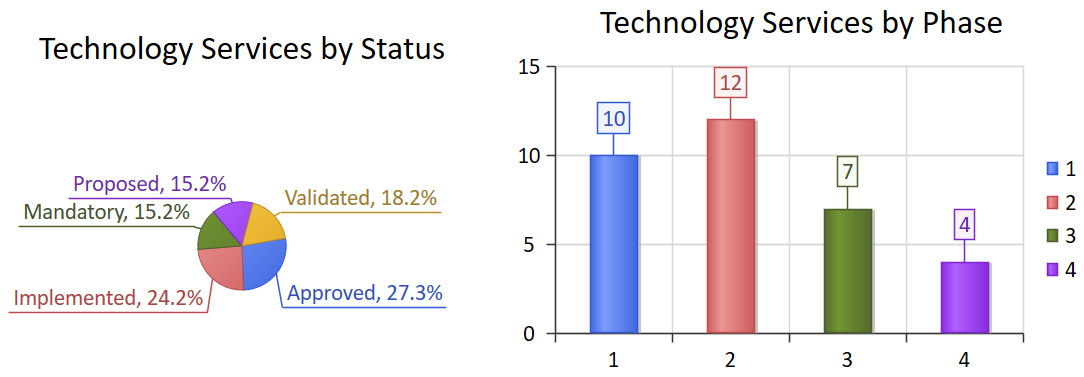
Figure 11.21 – The combined charts
- Select one of the charts on the diagram and right-click. A context menu is displayed. One of the options on this menu is Refresh Chart. This must be done anytime the underlying data changes.
Where Did These Values Come From?
You may be wondering where the status and phase values came from. These are standard fields available on all elements in Sparx. We simply changed the default values with arbitrary values to better demonstrate the capabilities of these charts.
This diagram can be included in a document report or HTML page. It can be treated just like any other diagram. We can even make this the default diagram for the HTML report.
We've barely touched on the capabilities of the charting features. There are many more chart types and options available, but hopefully, this will get you started. You can learn more about them in the Sparx user guide at the following location: https://sparxsystems.com/enterprise_architect_user_guide/15.2/model_publishing/charts.html.
We saw that custom SQL queries were one of the options for defining the source of data for a chart. Let's take a little closer look at it next.
Creating custom SQL queries
If you're a keen observer, you'll have noticed that the subject of custom SQL queries has popped up in a couple of areas. SQL is an option for specifying the source used in document template fragments, charts, and custom queries. While the subject of SQL is well outside the scope of this book, for those advanced users who are familiar with SQL, we wanted to make you aware of the capability and provide you with some of the resources you'll need to work with it in Sparx.
In a nutshell, a custom SQL query allows us to provide the data expected for charts and template fragments by executing a SQL SELECT statement against the internal tables of the Sparx repository. The SQL statement must return each of the fields expected by the template fragment or chart. This is ideal for situations where the data we're looking for is not neatly contained within a single package or element type. You can learn more about using custom SQL queries in a chart from the following link: https://sparxsystems.com/enterprise_architect_user_guide/15.2/model_publishing/chart_query.html.
The problem with the custom SQL query approach is that the Sparx internal tables are not easily known to us. Sparx doesn't advertise its internal table structure. You won't find much coverage of this subject in the Sparx user guide. This is somewhat understandable, as they need the flexibility to change that structure at will to provide more and better functionality in future releases.
If we were ambitious enough, I'm sure we could do some poking around and discover a few interesting tidbits about the internal table structure. But we're not! After all, why should we go through all of that trouble when it's already been done for us? Thomas Kilian has produced the publication, Inside Enterprise Architect – Querying EA's Database, available at http://leanpub.com/InsideEA, in which he lists all of the Sparx tables that he's discovered and identified their content and use.
If you're interested in playing around with this feature, the best way to test SQL queries is by using the SQL Scratch Pad in the search facility in Sparx. Here's a sample navigation recipe:
- Open the search facility – Explore > Search > Model.
- Press the new search button on the Search tab's ribbon.
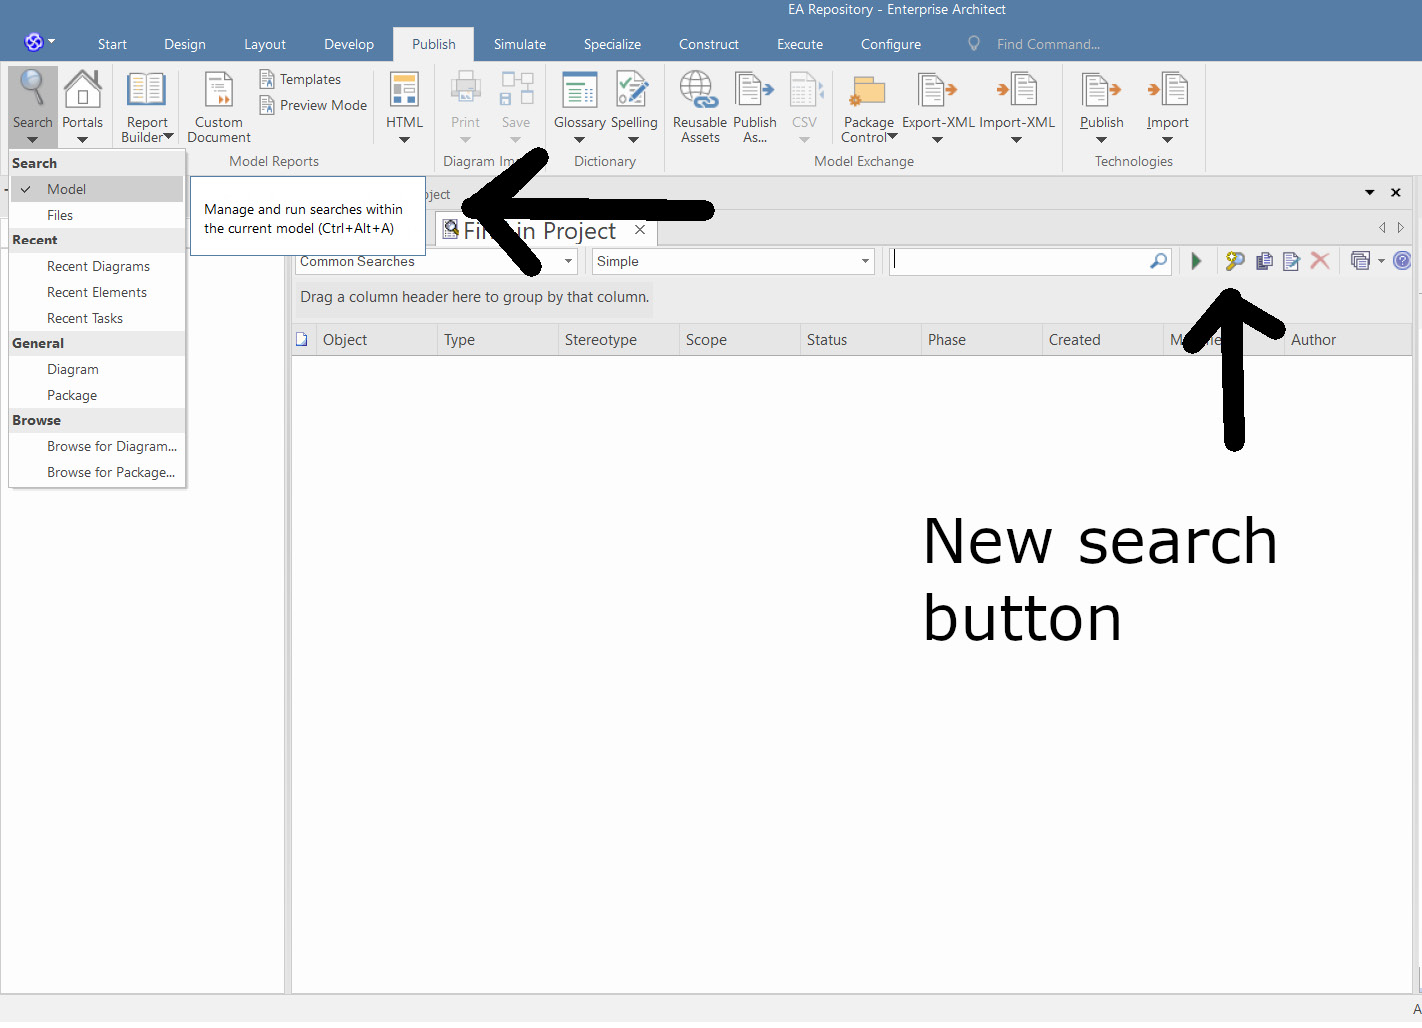
Figure 11.22 – Opening the search facility
- In the resulting New Search dialog, provide a name such as Test and select the SQL Edit radio button:
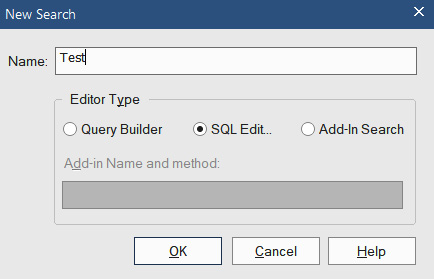
Figure 11.23 – The New Search dialog
- Press the OK button. In the upper panel of the resulting search tab, select SQL Scratchpad.
- In the SQL Scratch Pad editor, enter a SQL query such as the following:
select status, name from t_Object where stereotype = "ArchiMate_TechnologyService"
- On the Search tab's ribbon, press the run button (the green arrow) next to the new search button. The search results panel should be populated with multiple rows of status and name fields.
- On the search results panel, drag the status column header onto the grouping panel just above the search results panel. Your results should look something like the following screenshot:
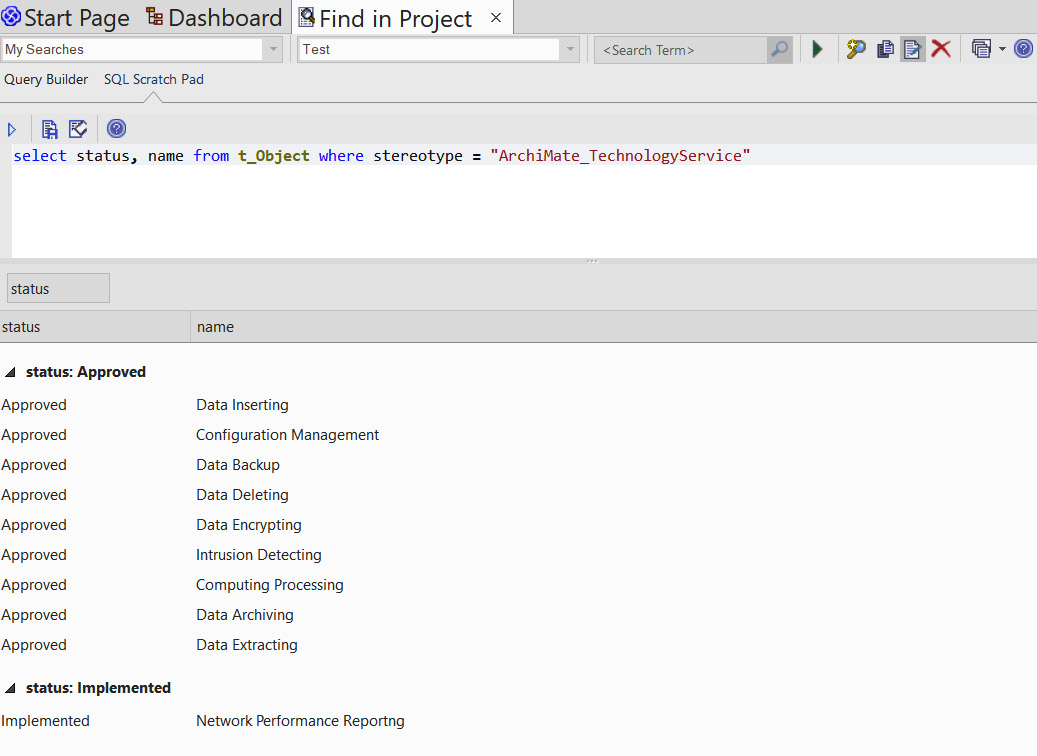
Figure 11.24 – The SQL query results grouped by status
The SQL Scratch Pad editor uses what Sparx refers to as the Common Code Editor. It has IntelliSense features such as code completion. For example, when entering the table name followed by a period, a drop-down list of the available fields from that table will appear. Of course, another way to discover the available fields is to enter the following statement:
select * from t_Object
Once you have tested your query and are satisfied that it returns the appropriate results, you can save the query, or copy the SQL statement and paste it into the appropriate area of the document fragment or chart builder dialogs.
SQL queries are not for the faint of heart. This is definitely a subject for advanced users. Now, let's move on to a simpler subject that everyone can take advantage of and that is used most often – the simple copy-and-paste method of publishing.
The copy-and-paste approach
We would be remiss if we didn't mention the simplest publishing mechanism of all, copy-and-paste. For simple, one-off communications and documents, this is indeed the simplest means of conveying model diagrams. Because most are already familiar with this approach, we won't spend much time on this subject. There are just a couple of things to go over for new Sparx users.
There are two ways to select and copy diagrams. You can use the menus by navigating to the following:
- Layout > Diagram > Select > Select All Elements
- Layout > Diagram > Select > Copy Selected Element(s)
You can also simply drag your mouse cursor over the elements you wish to copy and press Ctrl + C.
When it comes to pasting the clipboard contents, you may get a bit of a surprise. Sparx (Enterprise Architect version 15.2 and earlier) places a border around all diagrams, copied using the aforementioned means. Here's an example of the default border:
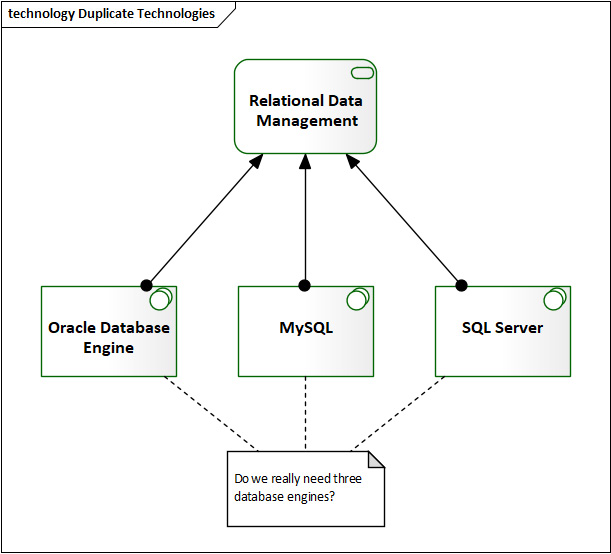
Figure 11.25 – A Sparx-generated border around a diagram
If you don't mind this border, then you're in business. Otherwise, you'll need to paste the image into a tool such as Microsoft Paint and crop out the portions of the diagram you need before pasting it into a document. This is how all of the diagram images in this book were produced.
Summary
Next to gathering information, publishing is the most important capability of your enterprise repository. There wouldn't be much use for a repository if it didn't have such capabilities. Fortunately for us, Sparx has a rich set of publishing features.
We've barely brushed the surface of what this tool can do. However, we're afraid that delving any deeper into the various features and uses of this tool at this time would lose all but the most adamant and determined reader. There's a better way to learn, which is to experience it for yourself. Go forth and model!
Within the chapters of this book, we have endeavored to teach you one of the only modeling languages specifically intended for the enterprise architect, ArchiMate®, using one of the most popular, feature-rich, and affordable tools of the enterprise architect, Sparx Systems' Enterprise Architect. We hope we have succeeded.
The best architectural decisions are based on the best information. We believe that it is the primary job of the enterprise architect to make such information available. Whether your organization makes architectural decisions by consensus, committee, decree, or yourself, you now have the tools necessary to make those decisions correctly. You have the tools necessary to design, generate, structure, organize, and clearly communicate information about your enterprise. You have the tools to accurately identify and communicate the current state of your enterprise, the options available for moving forward, the reasons for selecting one path over another, and an understanding of the consequences of selecting the wrong path. With such information and knowledge, how could you not succeed?