Preface
Coauthor Venkat Reddy Konasani and I, Shailendra Kadre, both work for Hewlett-Packard in Bangalore, India. He and I have been friends for a while, long before he started working for Hewlett-Packard. I had been becoming more and more interested in business analytics, using it in my work and thinking about doing a book on the subject. I was aware that he was a trainer in business analytics, and I attended a few of his training sessions. I was really impressed with his effective, simple presentation style, not to mention the content of his lectures. Here, I realized, was the perfect partner for the book I had in mind. It didn’t take long for us to decide to join forces to write this book.
But before starting work on this volume, we spent a couple years looking at books on business analytics and predictive modeling. Some of them were really good. But most of them were too intense and deep on the theory and mathematics of statistical algorithms, which are an integral part of this subject. Some people like books that take that tack, but most practitioners—even those in the industry—don’t have the deep background in the math required or the interest in learning it. Working professionals, particularly newcomers to the field of business analytics, are not very comfortable with the deep theoretical treatment of statistical algorithms generally provided in most of the books available on analytics. The market need we discerned, therefore, was to simplify the presentation of algorithms for professionals who don’t need to know the details to succeed in their work. Besides, once introduced to the subject, one can always refer to the advanced texts on statistics if such academic rigor is required.
The good news is that today’s analytics software, like SAS, is designed to do most of the math. Thus, we strongly felt there was a need for a book like this one, which takes the power of the software into account and, at the same time, simplifies the mathematical concepts involved in the process. With this motivation in mind, we started our work and strongly feel we have been successful in showing you how to use SAS to perform common analytical procedures while providing the basic knowledge of statistics required. The book keeps the theoretical part as simple as possible yet uses numerous real business scenarios to explain the concepts and the way they are used in the industry. Venkat’s working experience with the world’s leading banks and his vast experience working with students as an analytics trainer has come in handy in designing the case studies and examples used in this book.
As usual, readers are the best judge, and we invite you to join us in an active dialogue on this point so that subsequent editions can be improved. Please feel free to reach out to us at [email protected] and [email protected].
Whenever we look at books on technical subjects, we ask ourselves particular questions to decide whether the book is worth the investment of money, time, and effort. We think you probably do the same, so here are answers to the questions you may be asking.
What Is the Authors’ Training and Experience?
Both of us are working professionals in the field of business analytics with years of experience in real-life business problems. We currently work for HP India in Bangalore. We are postgraduates in either engineering or statistics from India’s top technology institutes—the Indian Institute of Technology (IIT). This is Shailendra’s second book with Apress, after Going Corporate: A Geek’s Guide, published in 2011.
What Does the Book Cover?
This book is basically a first course in analytics using SAS. You will get the foundational knowledge needed to be successful in the field. It has 13 chapters, each uniquely designed to develop a step-by-step understanding of the subject. Numerous real-life examples are provided with data and SAS code so that you, after completing this book, feel comfortable working on actual business challenges. Here’s a rundown of the content in each chapter:
- Chapter 1 starts with the basics of business analytics and presents some use cases to build a background for the upcoming chapters. We cover some of the most widely used analytical techniques. Next we move on to analytical tools including the most widely used analytics tool in technology today: SAS.
- Chapters 2, 3, and 4 impart the basic code-level knowledge you need in order to work with the SAS software. In these chapters, we discuss the basics of SAS, followed by data handling in SAS, and, finally, important SAS functions and procedures. These chapters give you a foundation in the SAS software, which will be required throughout this book, while working with real-life business scenarios on business analytics.
- Chapters 5 and 6 cover the basics of statistics and simple descriptive statistical techniques. They are the foundation-building chapters in statistics.
- Chapter 7 proceeds—since you have a solid foundation on statistics and SAS—to the life-cycle steps in analytics. Any analytical problem solving starts with data exploration, validation, and data cleaning. In this chapter, we document some of the most creative data-cleaning techniques used in the industry.
- Chapter 8 is all about testing. Testing hypotheses is a concept that is linked to many other statistical topics. In this chapter, we explain how to test hypotheses in simple terms.
- Chapter 9 begins the journey into advanced topics. The first steps in predictive modeling are correlation and regression. We explain these concepts with abundant real-life examples.
- Chapter 10 shows that regression is a vast subject; it requires more than one chapter to explain. We discuss multiple regressions in this chapter, as well as concepts such as multicollinearity and adjusted R-square.
- Chapter 11 explains why logistic regression is a commonly used predictive modeling technique. In this chapter, we discuss model building using logistic regression.
- Chapter 12 demonstrates time-series analysis, along with its applications, as well as how to implement the ARIMA technique.
- Chapter 13 is all about big data. Considering the exponential growth and popularity of the big data analytics domain, we felt it was appropriate to end this book with the basics of big data. This final chapter introduces big data with real-time data and examples that demonstrate the code and use of Hadoop.
What Is Not Covered in the Book?
While this book prepares you well in the basics of analytics and SAS, the following topics are left for you to explore in more advanced resources. This list is not an exhaustive one.
- Advanced SAS programing techniques such as macros
- Advanced analytical concepts such as optimization, advanced operation research techniques, machine learning, and decision trees
- Advanced big data concepts such as MapReduce coding
What Are the Unique Features of the Book?
A simple style of presentation and hands-on, real-life examples are two things we are particularly proud of. The following are some unique design features of this book:
- It contains numerous examples right from the first chapter until the end.
- Every concept is explained using a business scenario or case study.
- It offers the right mix of theory and hands-on labs.
- It is written by industry professionals who are currently working in the field of analytics on real-life problems for paying customers.
- It simplifies complex statistical concepts.
- It offers SAS code and a sufficient number of data sets.
- The book is self-sufficient. You don’t need any other resource or reference to grasp the concepts.
Does the Book Contain Hands-on Exercises?
Yes! Every chapter has demos and hands-on examples. The data sets used in each case study are available to you through the book’s web page on Apress.com. You can download the data and code files to practice.
What Industry Examples Does the Book Cover?
The examples in this book are not limited to any particular domain. We have tried to cover as wide a spectrum of industries as possible. The following are some specifics:
- Analysis of loan defaulter data in the banking domain
- Examples from retailers such as Walmart
- Applications of analytics in social media analytics
- Analysis of call volumes data in a contact center
- Analysis of smartphone sales predictions
- Analysis of associations between customer profile variables
- Forecasting stock prices
- Testing machine quality in a manufacturing plant
- Getting insights into weblog data
- Predicting risk associated with each customer in loan data
- And many more
What Will You Learn in This Book?
This book will give you a solid, hands-on foundation in business analytics and SAS. You can expect to learn the following:
- How to apply analytics to real-life business problems
- How to build analytics models and draw useful inferences from them
- How to write SAS programs and how to handle data in SAS
- How to perform basic descriptive analysis to gain insights from the data
- How to explore, validate, and clean data in a systematic way
- How to find associations between variables
- How to test an assumption and accept or reject it statistically
- How to predict a dependent variable using several independent factors
- How to forecast future values using historical data
- How to find the probability of winning versus losing
- How to handle big data
- And much more
What Are the Prerequisites for Reading This Book?
This book doesn’t require a graduate-level degree in math or statistical background. No prior knowledge in statistics is in fact required. Studying math at the high-school level should be adequate to grasp most of the concepts explained in this book. Basic knowledge of computers and spreadsheets is required, though. An elementary knowledge of databases such as Microsoft Access and SQL will also help. A basic knowledge in computer programming is a plus.
Who Is This Book For?
This book is for working professionals, new graduates, students, and analytics enthusiasts. While designing this book, we envisioned our audience as follows:
- Anybody who wants to get hands-on with analytics
- Professionals who want to upgrade their analytical skills
- Anybody who wants to get started with SAS
- Graduate and postgraduate statistics and business analytics students
- Any new college graduate who wants to enter the world of analytics in domains such as retail, banking, insurance, and services
- Lecturers or teachers who want to teach a basic analytics course to students at the graduate or postgraduate level
- Individuals with nonstatistical backgrounds
- Anyone who wants to get a basic idea of big data analytics
Can I Use This Book for an Analytics Course?
You bet! The goal of this book is to impart the concepts rather than just giving information. All the concepts covered are self-contained and don’t require any further references. This book can be easily converted into a semester’s course as an introduction to SAS, analytics, and predictive modeling. It can be part of any undergraduate or postgraduate program that aims to introduce business analytics to students.
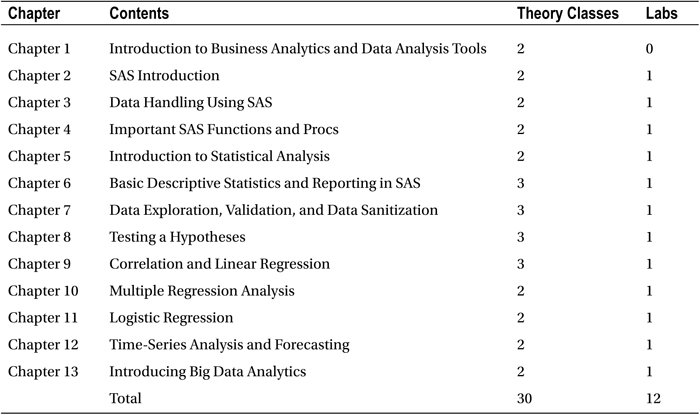
The following is the suggested class plan for a one-semester course. It consists of 30 classroom theory and 12 lab sessions. Course instructors can adapt it to suit their specific requirements.