
Advances in release readiness
P. Rotella Cisco Systems, Inc., Raleigh, NC, United States
Abstract
A key question in the software development industry is “how do we know when a release is ready to ship to customers?” Is the release sufficiently reliable, or are there too many residual bugs remaining? These questions are difficult to answer with any certainty. To help ensure reliability, many development teams rely on traditional metrics, such as severity 1 and 2 backlog levels, test case execution percentages, and pass rates for function testing. Often, these types of metrics are aggregated into a “quality index” that uses weighted averages to gauge “release health” throughout the lifecycle, but are mainly focused during the function and system testing of the integration branch, the new release’s total code base. These metrics and indices are considered useful, but usually there is not a known correlation between the key metrics/indices and the customer’s reliability experience. In other words, we merely assume they are good indicators of release health—evidence is usually lacking that moving these metric/index “levers” by this much results in changes in the customer reliability experience by that much.
Keywords
Release health; Release readiness; Software reliability; Software quality; Predicting reliability; Mathematical modeling; Test metrics; Bug fix metrics; Phase containment; Universal release criteria (URC) model; Best estimation technique; Resource/schedule/content (RSC) model
A key question in the software development industry is “how do we know when a release is ready to ship to customers?” Is the release sufficiently reliable, or are there too many residual bugs remaining? These questions are difficult to answer with any certainty. To help ensure reliability, many development teams rely on traditional metrics, such as severity 1 and 2 backlog levels, test case execution percentages, and pass rates for function testing. Often, these types of metrics are aggregated into a “quality index” that uses weighted averages to gauge “release health” throughout the lifecycle, but are mainly focused during the function and system testing of the integration branch, the new release’s total code base. These metrics and indices are considered useful, but usually there is not a known correlation between the key metrics/indices and the customer’s reliability experience. In other words, we merely assume they are good indicators of release health—evidence is usually lacking that moving these metric/index “levers” by this much results in changes in the customer reliability experience by that much.
Why is it important, even critical, prior to releasing software to understand the quantitative relationship between key metrics and field performance? After all, customers do demand high feature velocity and realize that reliability often suffers as a result of high new feature counts, lower cycle times, and increasingly large and complex code bases. But both enterprise and service provider customers are also under heavy pressure to provide very high levels of software reliability and availability to their user base, and consequently are unwilling to implement new releases without quantifiable acceptance criteria for key metrics, in addition to thorough acceptance testing in their labs.
Probably the most effective way to ensure high reliability for customers is to practice rigorous “phase containment”—improving upstream design, code development, and testing practices. This is certainly true, but even where the bug injection rate is low, we still need to be fairly certain, during the testing cycle, what the field reliability is actually expected to be and that it will be sufficiently high. And we need to be able to convince customers that engineering’s expectations are accurate and reliable.
Predictive Test Metrics
At Cisco, we have investigated many test metric candidates in an effort to predict field experience for our wide range of software products. Ideally, we would prefer to find highly predictive metrics in each of the major testing “dimensions”—incoming, fixed, and backlog bugs. These dimensions characterize the testing process well, and are routinely used in our corporate environment, as well as in many others. (There are other important testing “dimensions,” such as code coverage and key bug management, but studies of these are still in progress.)
To investigate the influences of these three major dimensions, our team gathered many metrics that are collected routinely during function and system testing on the main/integration branches of releases for a broad variety of major platforms. Our hope was to build a model, predictive of field reliability, that includes incoming, fix, and backlog variables. While we know that these dimensions are interdependent, they may turn out to be sufficiently orthogonal to not damage any resulting model because of high multicolinearity or other statistical difficulties.
The modeling work turned out to be quite successful: an incoming variable and a fix variable each correlated, in univariate linear regression models, with field reliability (the dependent variable) in the mid-80s% range, and in the multiple linear regression model that includes both independent variables, the correlation improved to the high-80s% level (since colinearity between the two is low).
The most highly predictive incoming bug variable is the cumulative count of incoming bugs discovered during the weeks of function and system testing. We have empirically determined that if 80% or more of the asymptote value of a Goel-Okumoto Shaped (GOS) cumulative incoming (S-shaped) growth curve is achieved during testing, the release is likely to be highly reliable in the field. In other words, if, with fairly constant test effort week to week, fewer and fewer bugs are found, at a certain point (i.e., 80% of the asymptote) in this weekly exponential decay, the release is likely to be in good shape. Here is a visual representation of this metric (Fig. 1).

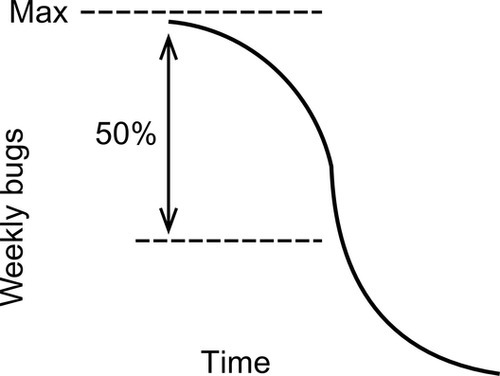
The highly predictive bug fix variable is the decline of the weekly bug fix rate—if this rate declines to about 50% of the maximum observed weekly rate, the release is likely to be even more reliable than if only the incoming growth curve objective is met. This bug fix metric gauges late code churn, which many have found to be very damaging to code reliability. Bugs fixed late in the testing period are often found to be inadequately tested, with a high percentage of the fixes causing collateral damage in the code. The following visual shows a weekly bug fixing profile, from the maximum weekly level to the end of testing. A reduction from the maximum of 50% or more is needed for high reliability (Fig. 2).
The modeled backlog metrics did not show strong predictive ability, largely because backlog reduction is already an important initiative, and under good control, for the company’s major releases, and the releases of many other companies.
Universal Release Criteria Model
We call the overall model the “universal release criteria (URC)” model—“universal” only in the sense that we see strong correlations with customer experience for all the Cisco waterfall, hybrid waterfall/agile, and agile systems evaluated. These correlations are on the order of ~ 70% for the 195 releases on 77 different products evaluated so far. These releases/products constitute a broad range of operating systems, end user applications, collaboration tools, and other software products. As long as integration branch testing results in ~ 150 or more bugs, the accuracy of the field reliability predictions is sufficient, varying from ± 9% at low cumulative growth levels to ± 4% as the release nears the 80% incoming goal; the error bars are similar for the fix rate (late churn) metric.
Feature-level URC is used in practice to identify features that are underperforming either in the desired weekly decay of test finds or bug fixes. Problematic features are good candidates for exclusion from the release. Accurate tagging of bugs and query construction are essential, and if this is the case, we can track and assess the testing and bug fixing progress of features as small as three or four KLOC (thousands of lines of new + modified + ported source code). This surgical approach to ensure release readiness makes the URC technology more directly actionable, an attribute in high demand during the final stages of release preparation.
Best Estimation Technique
We did not have, and could not find, a GOS routine that provides sufficient accuracy (<±15%) for calculations below ~ 60% of the software reliability growth curve’s asymptote value. In order to provide test and bug fix teams with accurate weekly statuses during the first half or so of the test period, we developed a method that incorporates an improved slope-change detection algorithm that achieves an average of ~± 7% measurement accuracy over the initial 60% of the growth curve. This novel approach has enabled us to give test and bug fix teams the ability to fairly accurately detect underachieving behavior early in the test cycle, giving them more time to implement remediation efforts. This technique is called the “best estimation technique ,” and is an example of how the need for close to real-time assessment of team behavior can be a practical outgrowth of the use of a well-known and powerful research method, the nonhomogeneous Poisson process (NHPP) growth modeling using the GOS method.
Resource/Schedule/Content Model
The terms of the cumulative incoming growth and weekly fix rate model can be used to track weekly testing and bug fixing progress, often in time to detect underachievement and make some adjustments in resourcing, scheduling, or content. But at a minimum, we can use this reliability prediction model to help plan future releases. An extension of the URC calculation/reporting tool is a “what-if” release planning mechanism that is used to estimate additional test and/or bug fixing resources needed to achieve the URC metric goals. These estimates are based on the predecessor release’s metrics performance. The test schedule time and content “dimensions” can likewise be adjusted, along with the resource dimensions, to optimize the release planning process. Our “resource/schedule/content (RSC)” model is the basis for a “what-if” capability in our release management toolset. This planning tool allows us to revise the test and bug fixing resources profile, the testing schedule, and the feature content to achieve improved URC metric results, based on URC metric values from underachieving predecessor releases. The RSC model can also be used in a “remediation” mode, where changes in resources, and/or schedule, and/or content can be adjusted during the test cycle. The resource/schedule/content planning questions exist, of course, in development and test environments that do not use the URC model ideas – therefore, we are developing a version of the RSC model that uses field bug levels of previous releases as a way to gauge how much additional resource, schedule, or content reduction is needed to achieve high reliability.
Using Models in Release Management
Release management staff, as well as the engineering groups, need to know, as soon as possible, if a release in testing is unlikely to meet customer reliability expectations. To provide this level of guidance, it is necessary to identify as accurately as possible the desired weekly incoming pattern as well as the desired weekly bug fix pattern. We routinely provide these weekly values by using the estimated new + modified + ported source code count for the upcoming release, multiplied by the historical defect density of the recent predecessor releases, to estimate the asymptote (i.e., the total bug content) of the new release. Fitting the growth curve to the test period and the fraction of the asymptote desired (80%), gives us a desired “target” curve for the cumulative incoming metric, and decomposing these values gives us the desired target curve for the weekly fix levels. Then, calculating the accuracy of the target curves, and the accuracies of the actual incoming growth and fix curves, enables us to construct error bars for all these curves, and in this way be quite sure if the teams are on track or underachieving each week during the test cycle.
For most teams, we goal these key metrics at aggressive levels in order to help them achieve best-in-class customer experience results (i.e., the software reliability experienced by the top 10% of the industry sector) for their customers in approximately three releases. For some teams, this timetable is too aggressive. To reach the goals, substantial changes need to be made, such as one or more of the following: adding resources, lengthening the test schedule, reducing the number of features, or substantially improving development and test practices. Some teams are not able to make substantial planning or process changes in three or four releases, particularly on short release-cycle projects. These teams are normally goaled less aggressively, but aggressively enough to ensure release-over-release improvement. Consistent release-over-release reliability improvement is the immediate goal, with best-in-class reliability as the longer-term objective. However, customer expectations are continually rising, even when best-in-class levels are reached, therefore release-over-release improvement continues to be critical.
Research to Implementation: A Difficult (but Rewarding) Journey
Software engineering research, with a keen eye toward practical application, is essential in an organization that is striving to achieve best-in-class software reliability. But taking research from the proof of concept stage to the pilot stage to productional implementation is invariably a difficult task/journey. Organizations, and the individuals who comprise them, do not accept change readily. Therefore, new methods, even those based on solid software engineering concepts and experimental results, must be straightforward, intuitive, and adequately tooled. But if these goals are met, the rewards are large, including the increased work satisfaction of the engineers as best-in-class reliability becomes a reality.